. 2020 Nov 15;26(22):6003-6016.
doi: 10.1158/1078-0432.CCR-20-1523. Epub 2020 Sep 4.

PD1 Blockade Enhances ICAM1-Directed CAR T Therapeutic Efficacy in Advanced Thyroid Cancer

Affiliations

PD1 Blockade Enhances ICAM1-Directed CAR T Therapeutic Efficacy in Advanced Thyroid Cancer

Katherine D Gray et al. Clin Cancer Res. .

Abstract

Purpose: Advanced thyroid cancers, including poorly differentiated and anaplastic thyroid cancer (ATC), are lethal malignancies with limited treatment options. The majority of patients with ATC have responded poorly to programmed death 1 (PD1) blockade in early clinical trials. There is a need to explore new treatment options.

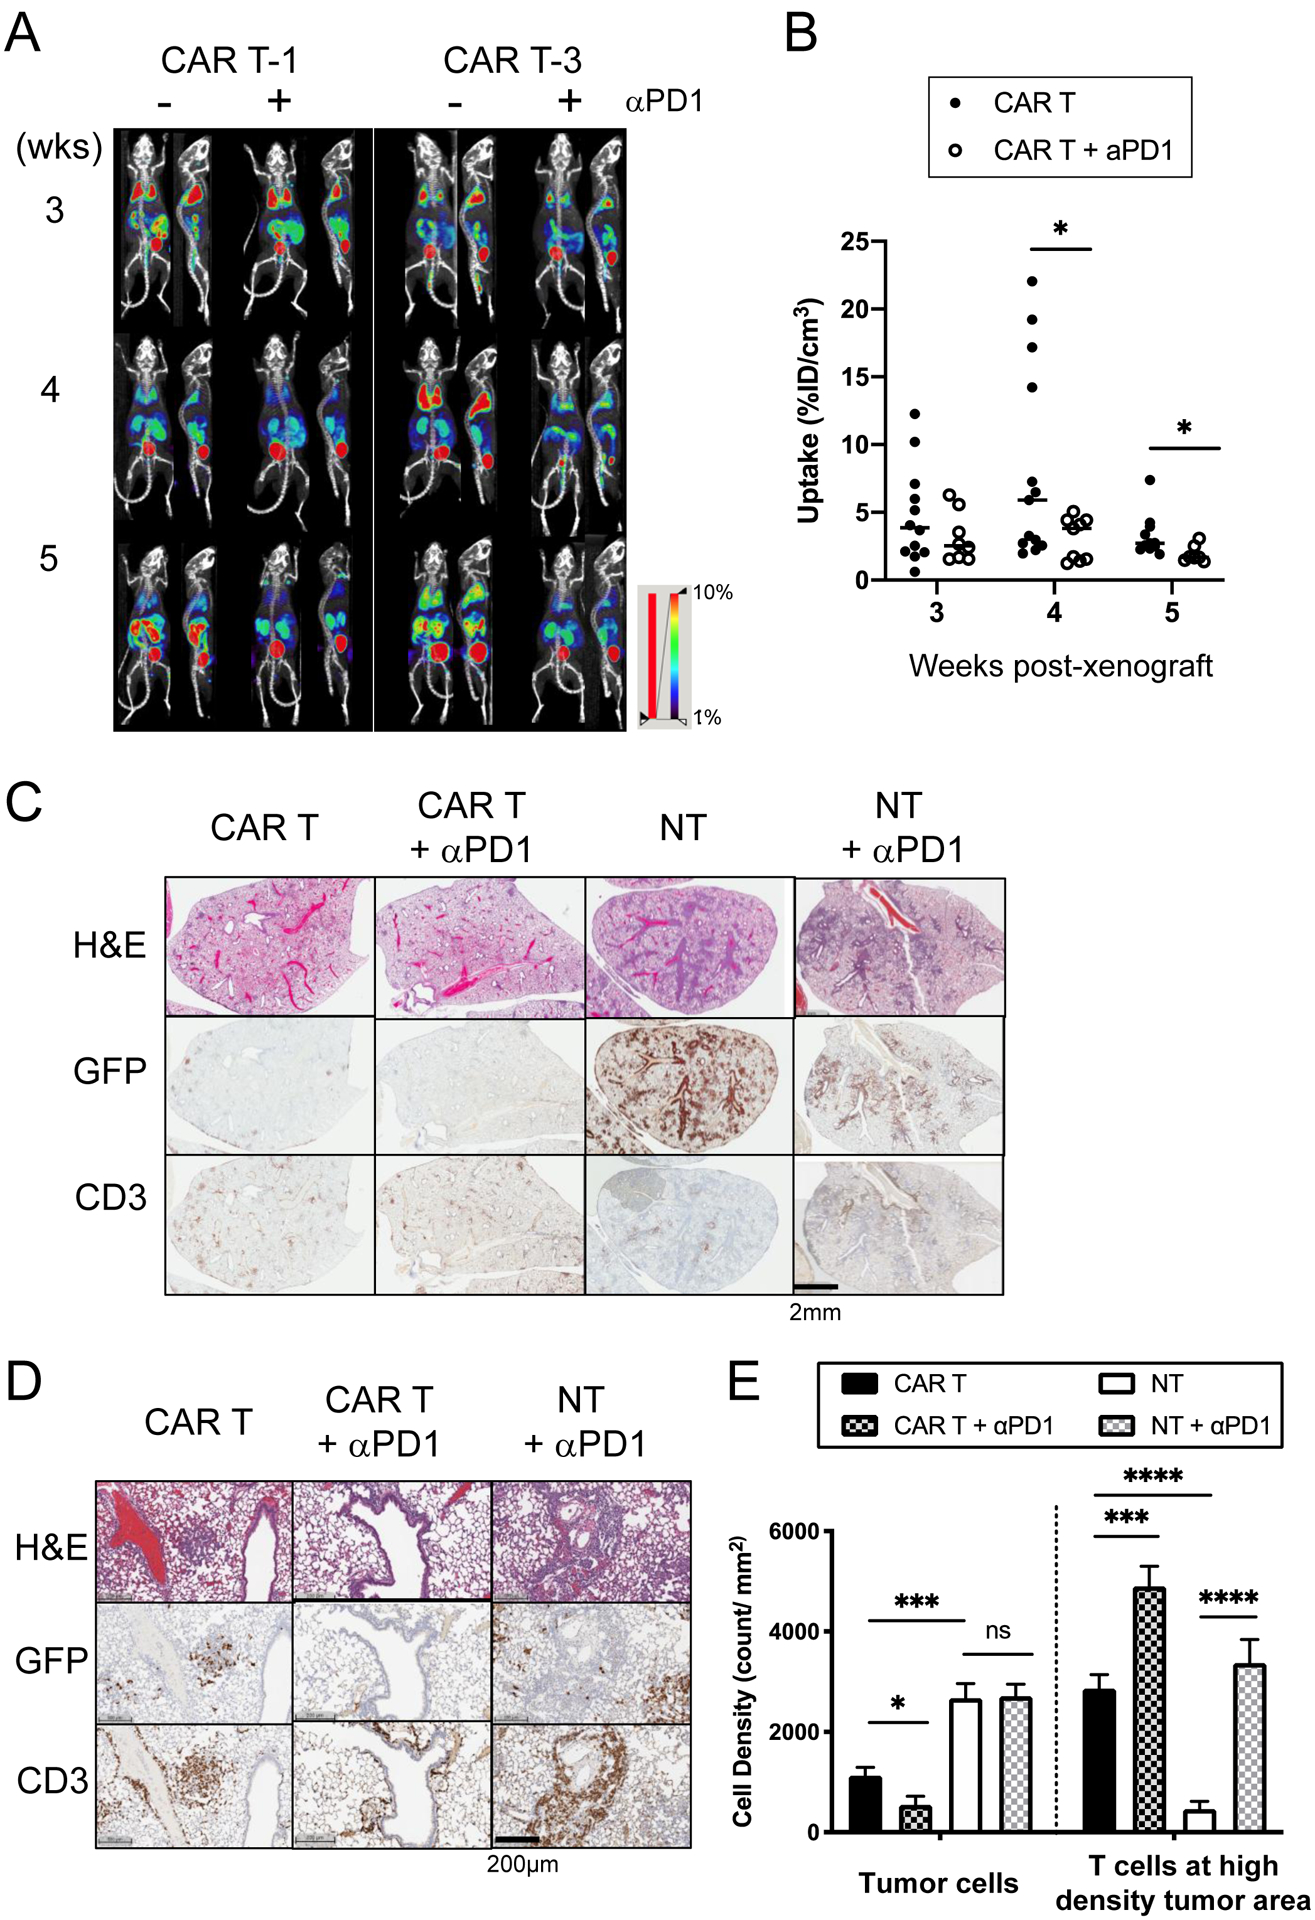
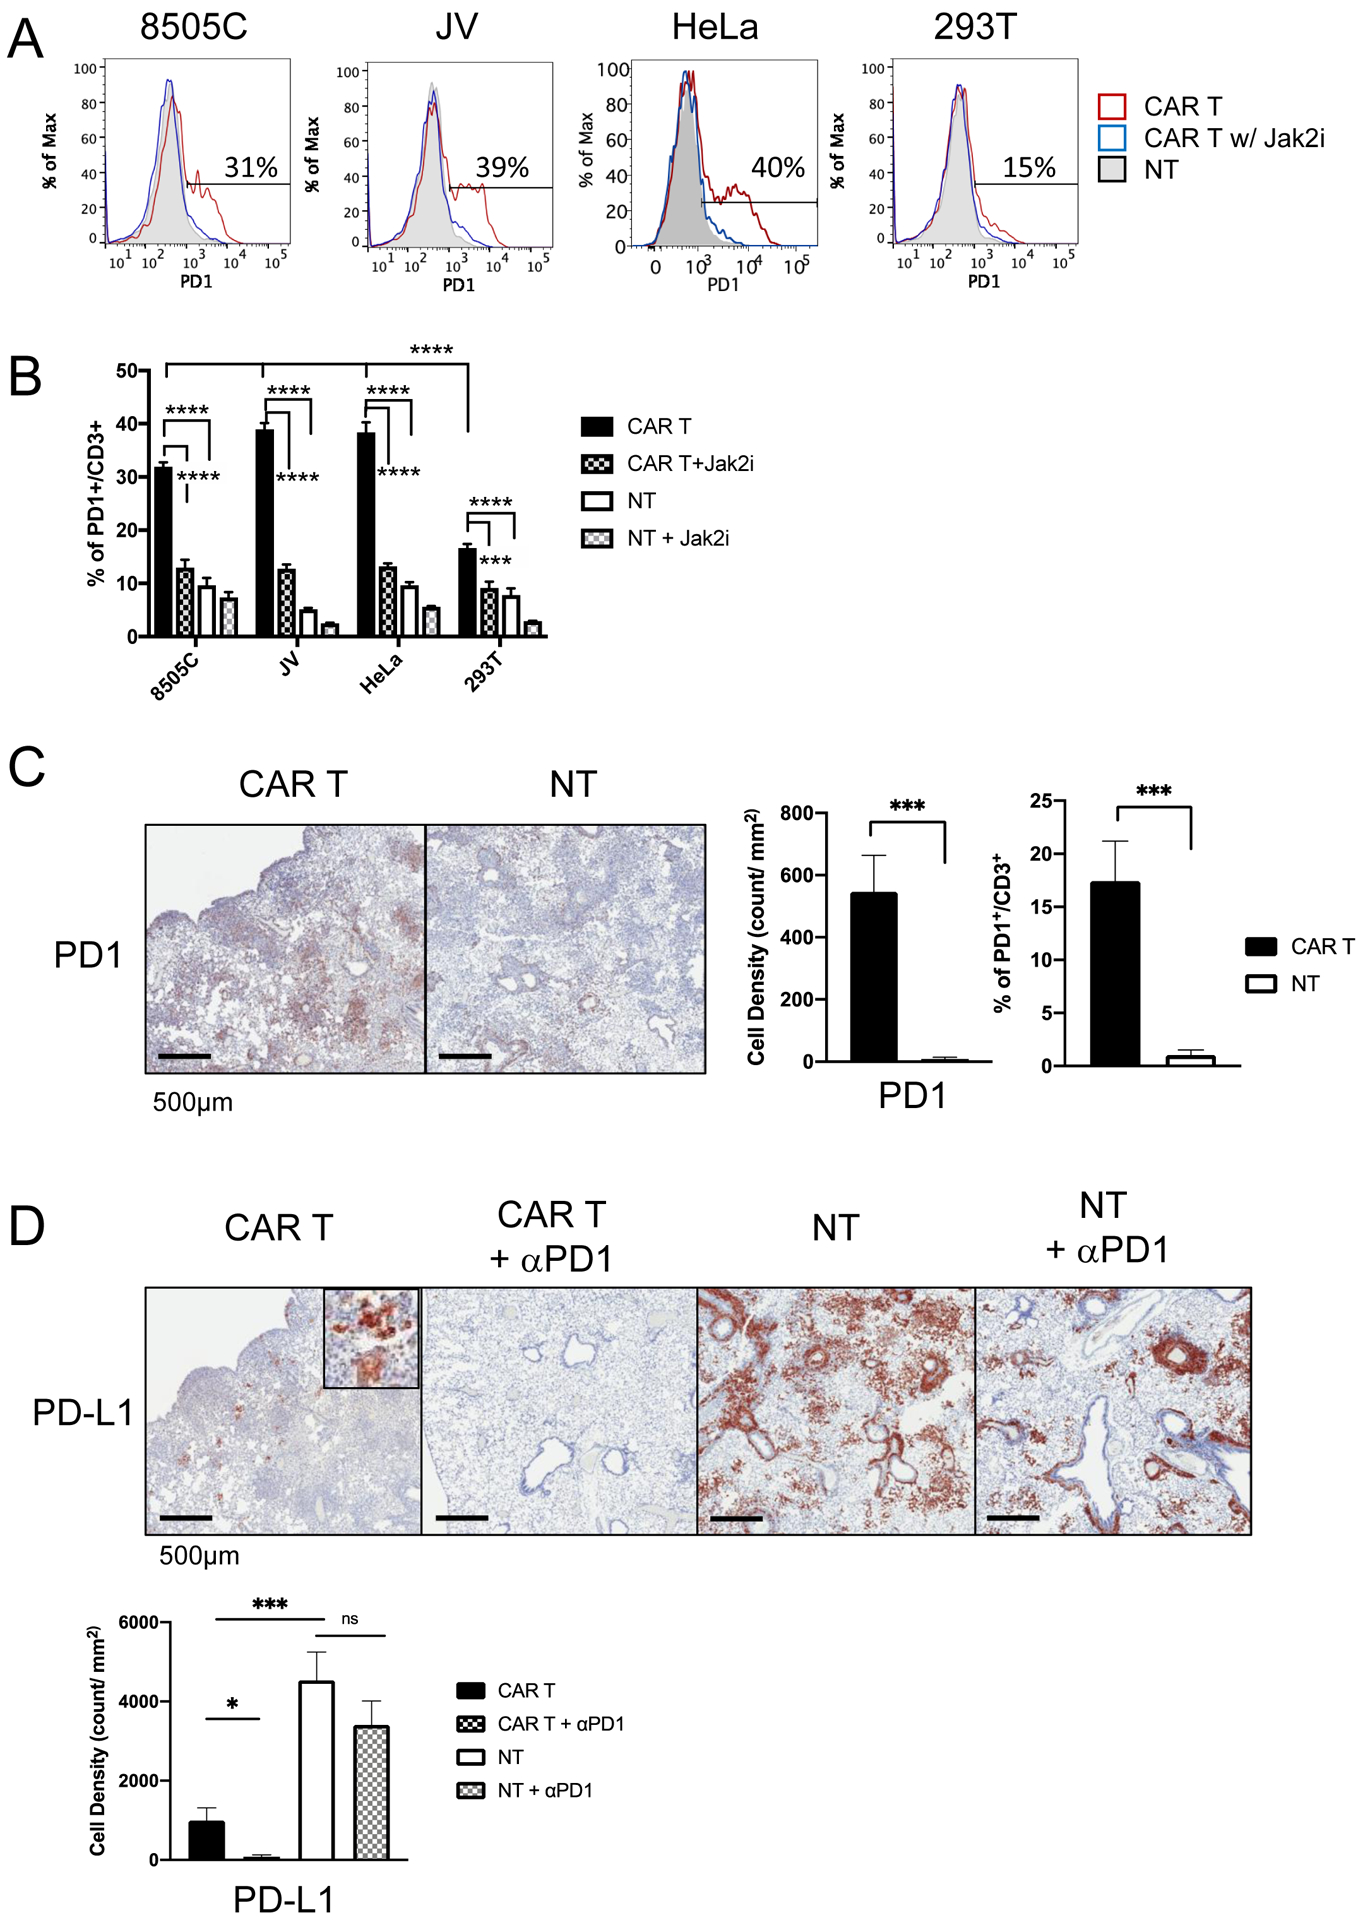
Experimental design: We examined the expression of PD-L1 (a ligand of PD1) and intercellular adhesion molecule 1 (ICAM1) in thyroid tumors and ATC cell lines, and investigated the PD1 expression level in peripheral T cells of patients with thyroid cancer. Next, we studied the tumor-targeting efficacy and T-cell dynamics of monotherapy and combination treatments of ICAM1-targeting chimeric antigen receptor (CAR) T cells and anti-PD1 antibody in a xenograft model of ATC.

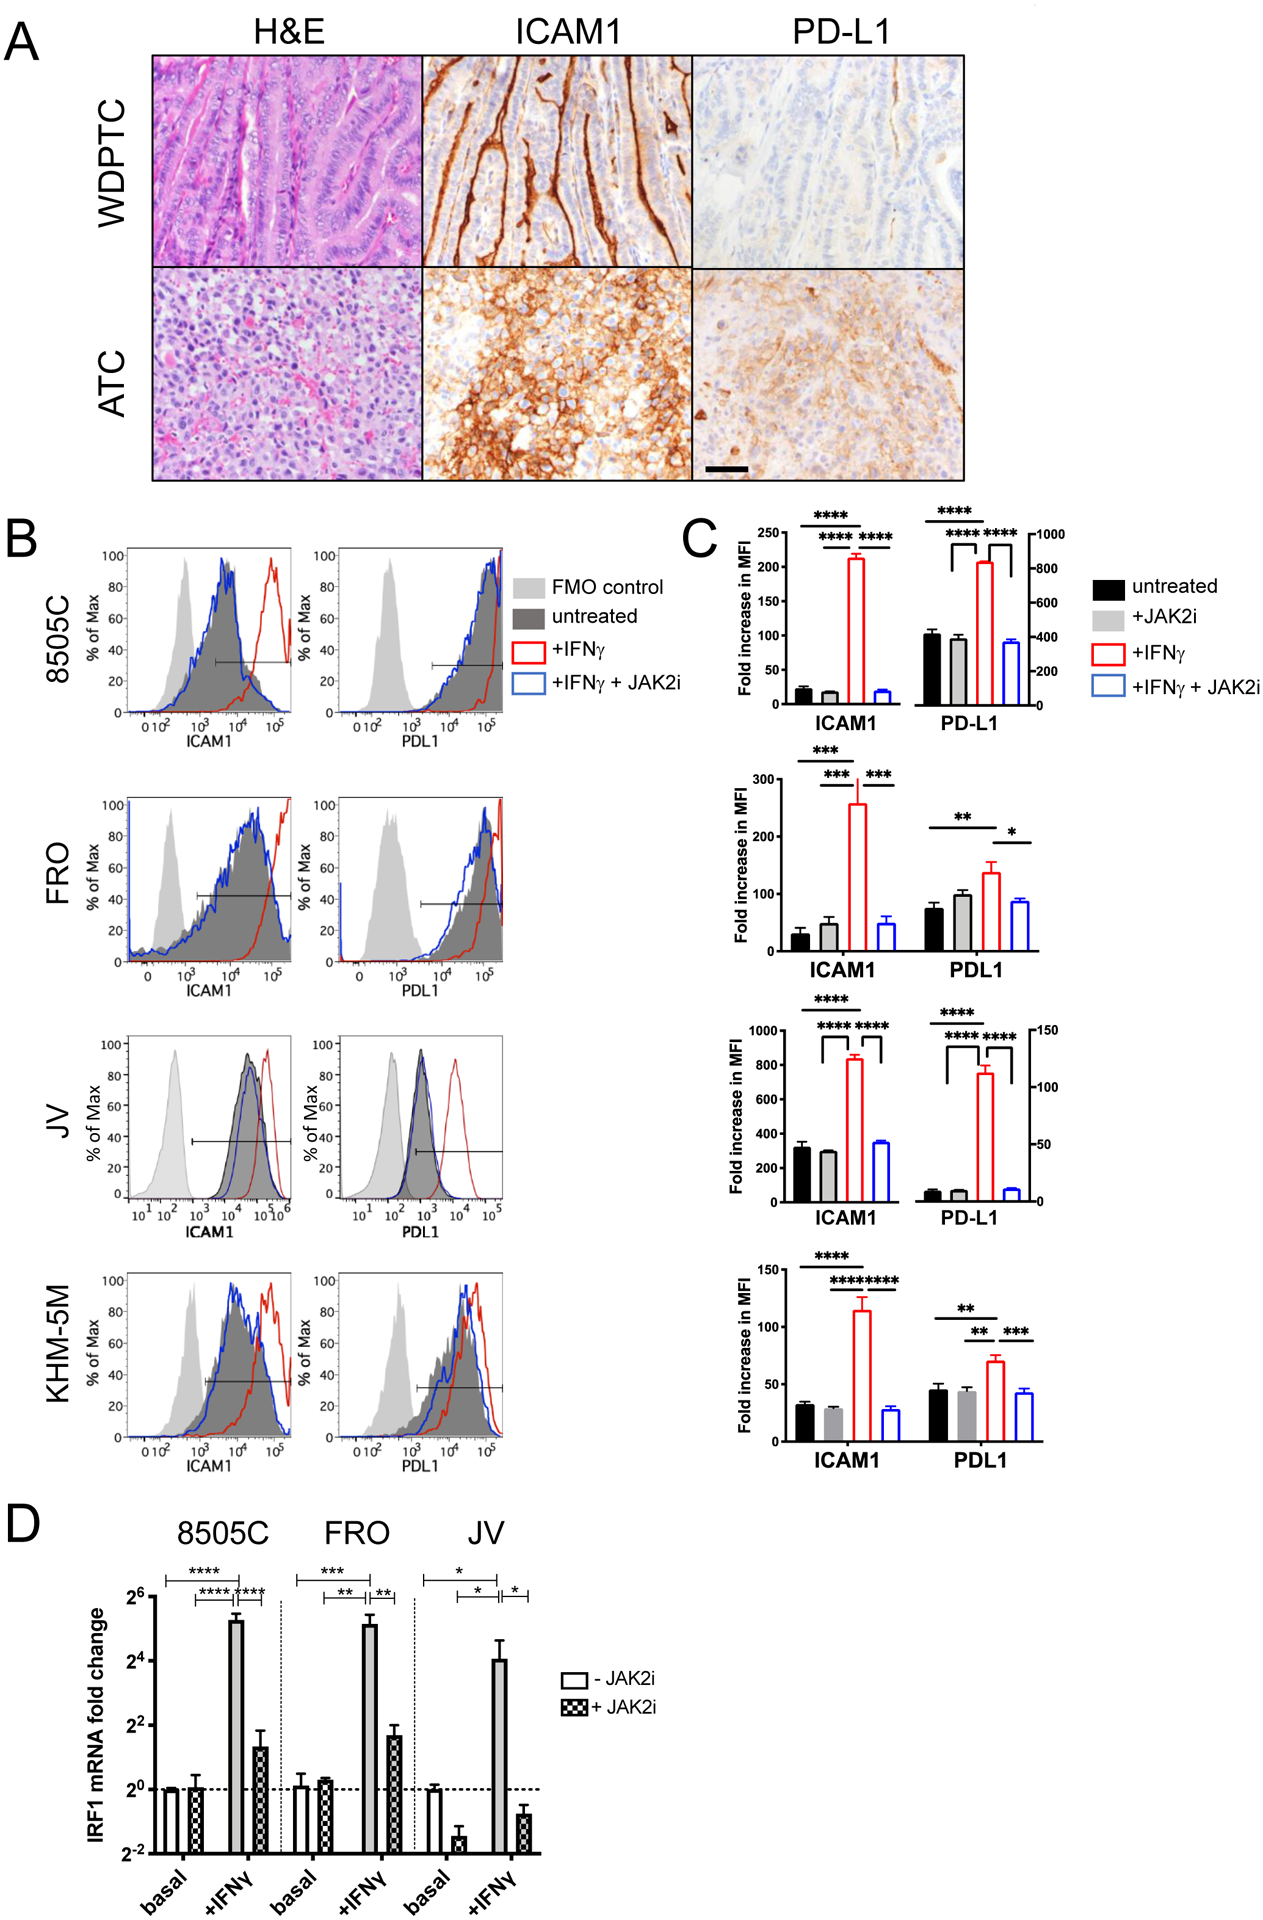
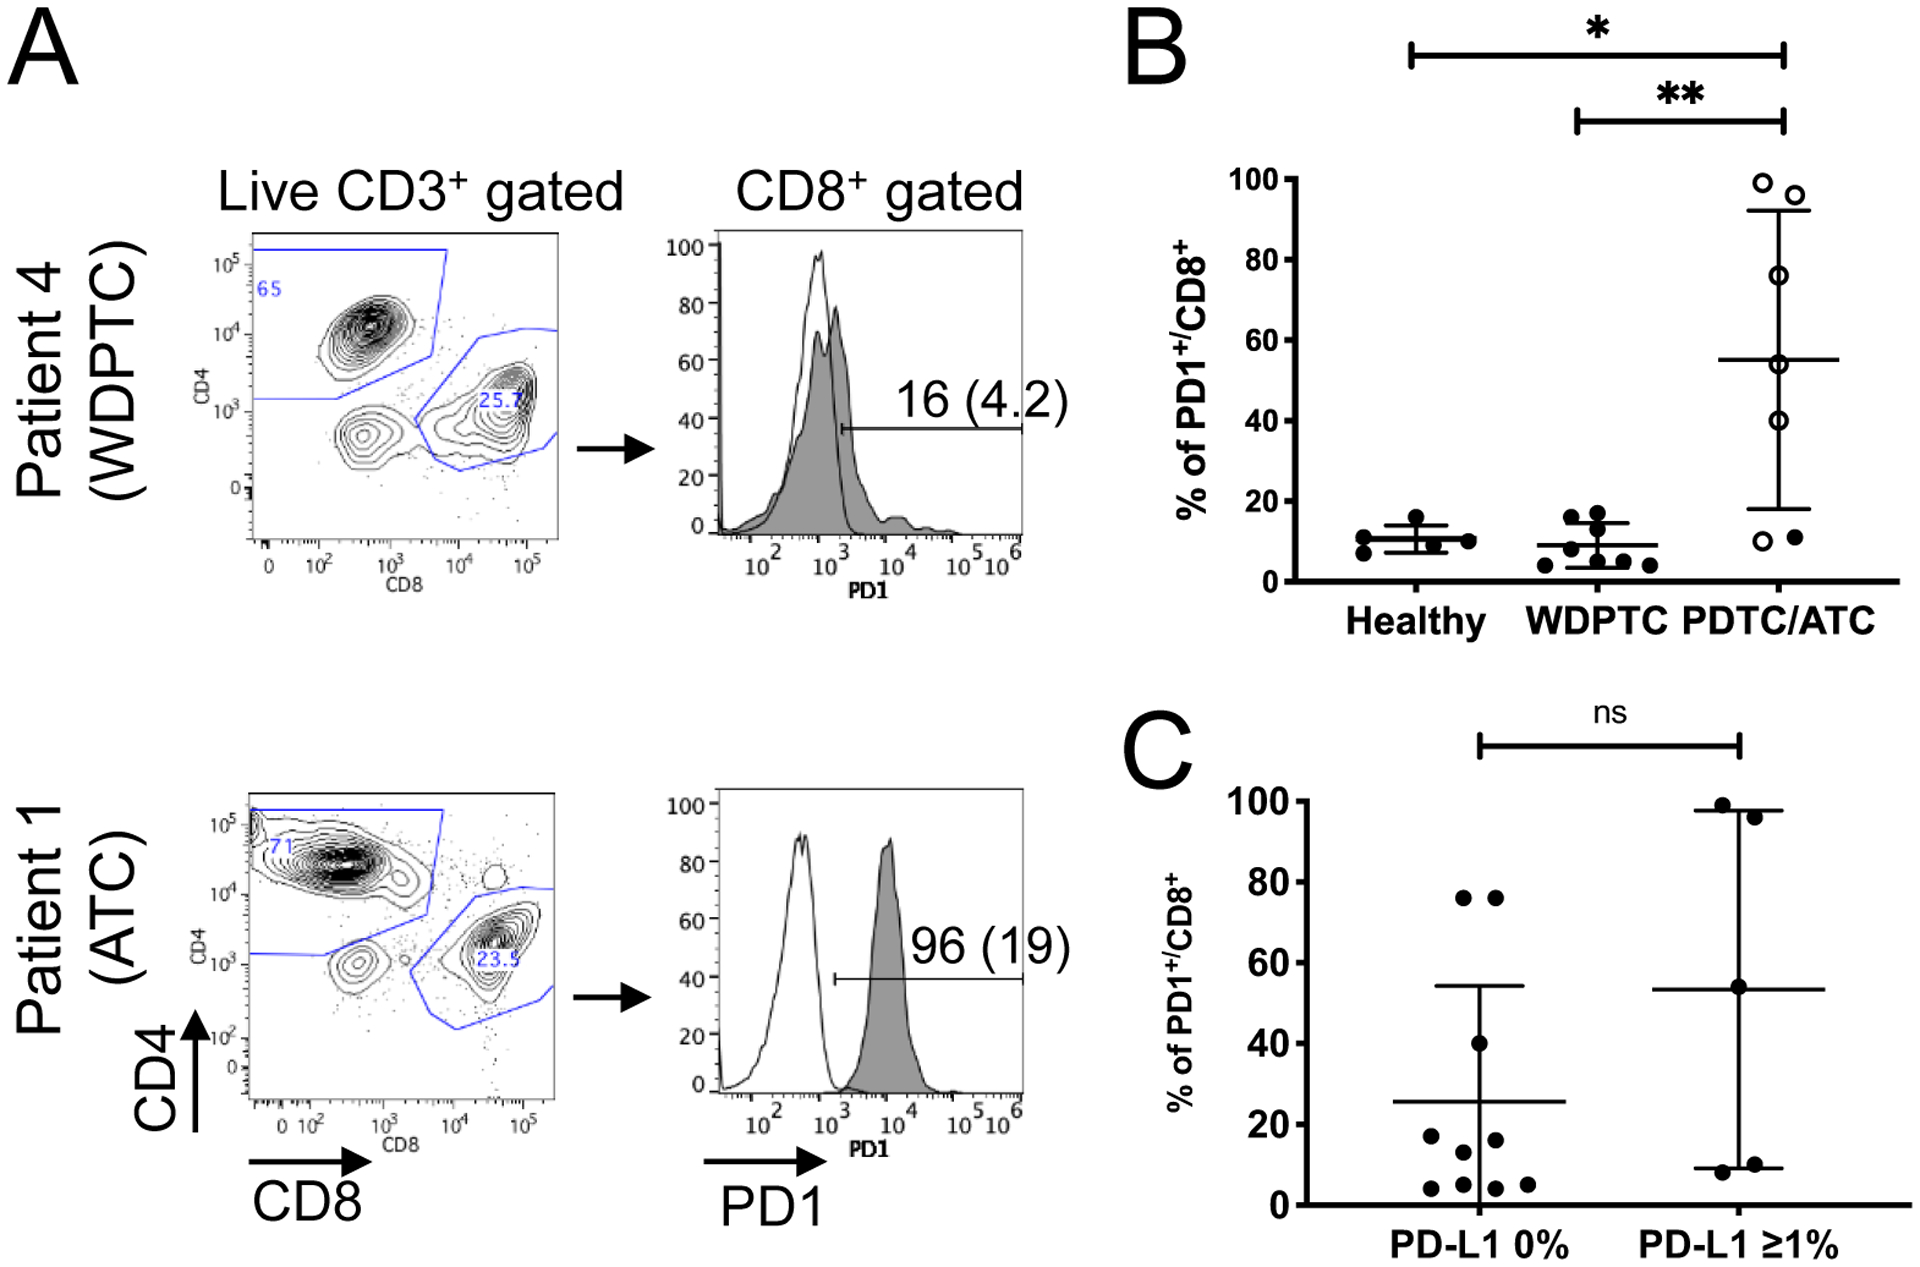
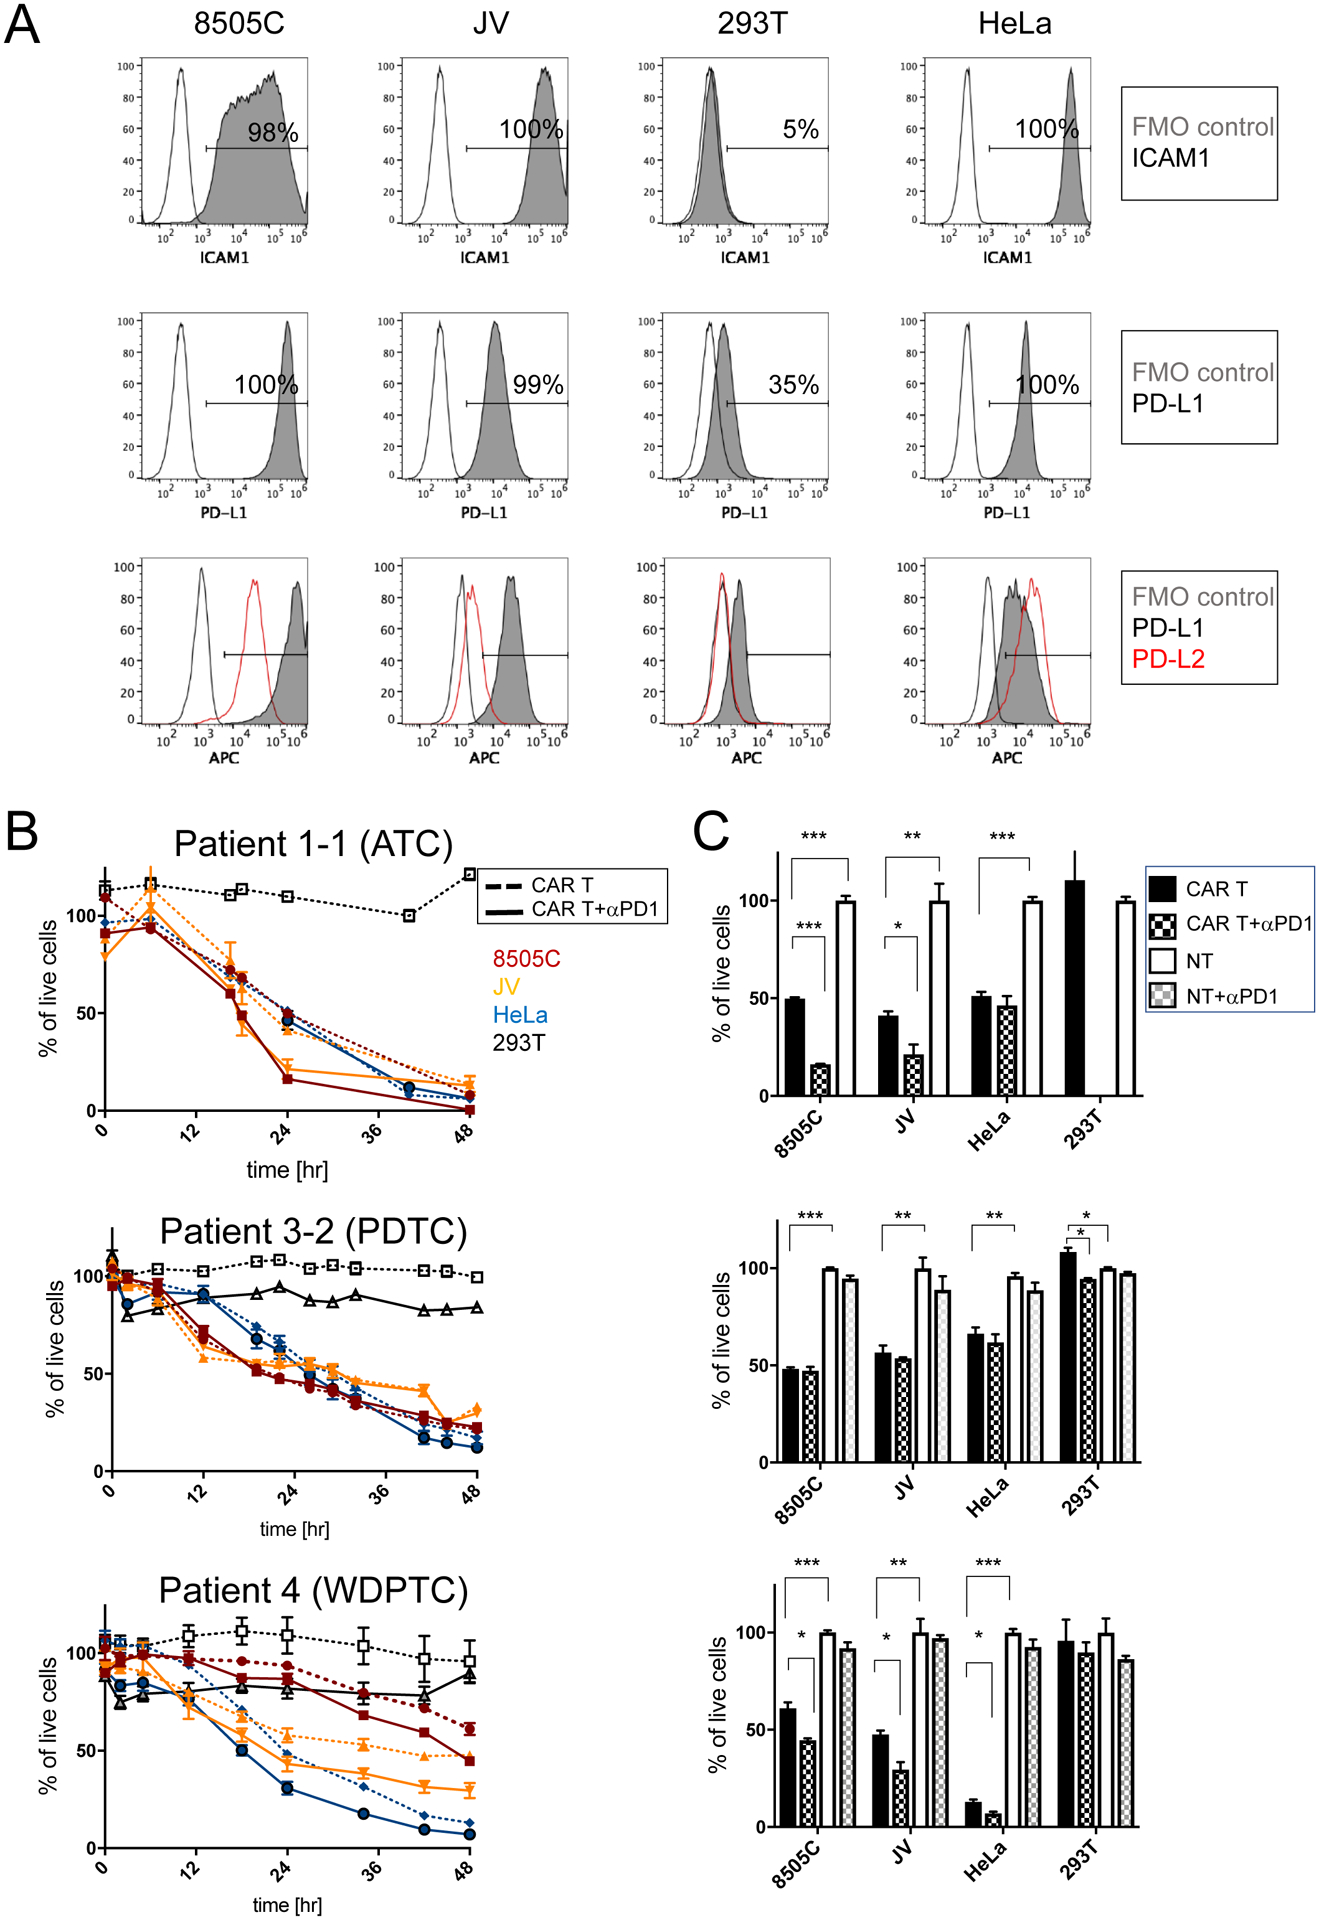
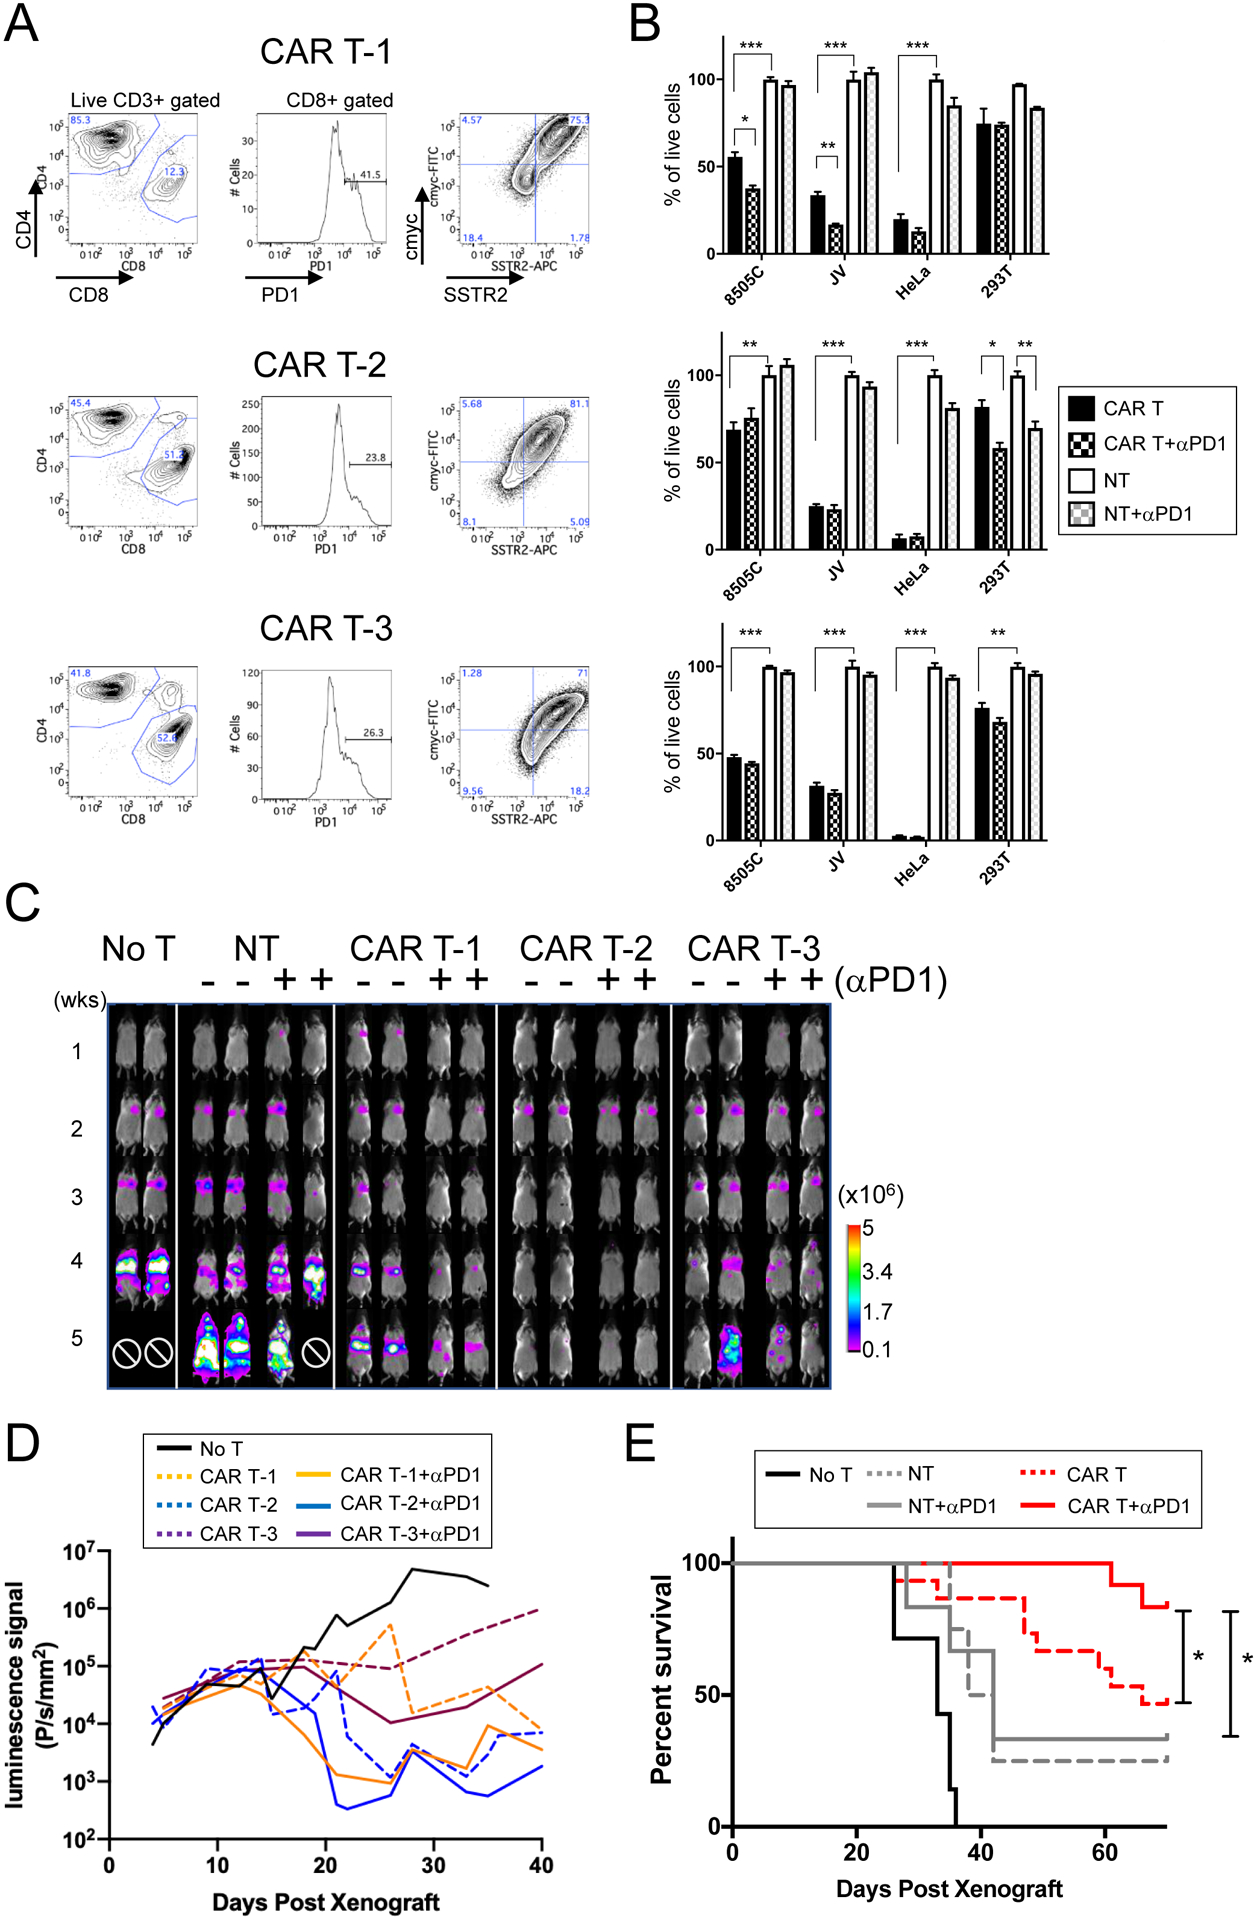
Results: Advanced thyroid cancers were associated with increased expression of both ICAM1 and PD-L1 in tumors, and elevated PD1 expression in CD8+ T cells of circulating blood. The expression of ICAM1 and PD-L1 in ATC lines was regulated by the IFNγ-JAK2 signaling pathway. ICAM1-targeted CAR T cells, produced from either healthy donor or patient T cells, in combination with PD1 blockade demonstrated an improved ability to eradicate ICAM1-expressing target tumor cells compared with CAR T treatment alone. PD1 blockade facilitated clearance of PD-L1 high tumor colonies and curtailed excessive CAR T expansion, resulting in rapid tumor clearance and prolonged survival in a mouse model.

Conclusions: Targeting two IFNγ-inducible, tumor-associated antigens-ICAM1 and PD-L1-in a complementary manner might be an effective treatment strategy to control advanced thyroid cancers in vivo.


Conflict of interest statement

Disclosure of Potential Conflicts of Interest: P.J. Christos reports grants from Weill Cornell Clinical and Translational Science Center during the conduct of the study. R. Zarnegar reports personal fees from Beckton Dickenson outside the submitted work. No potential conflicts of interest were disclosed by the other authors.

Figures

Figure 1.
Figure 1.. Expression and induction of ICAM1 and PD-L1 in thyroid tumor tissues and cell lines.
(A) Representative images showing H&E staining, ICAM1 IHC, and PD-L1 IHC of tumor tissues from WDPTC and ATC patients. Scale bar = 20 μm. (B) The surface expression of ICAM1 and PD-L1 was measured by flow cytometry. IFNγ (200 U/ml) with or without JAK2 inhibitor AZD1480 (1 μM) were added for 48 hours to examine its effect on ICAM1 and PD-L1 expression. The gates for positively stained cells are marked with horizontal bars within the plots. (C) The fold increases in mean fluorescence intensity (MFI) of ICAM1 and PD-L1 were normalized to fluorescence minus one (FMO)-stained control cells. Data represents mean ± sem. n = 4 −10 replicates. The analysis was repeated independently at least three times. (D) qPCR measurement of IRF1 mRNA expression in ATC cells 24 hours after IFNγ and/or AZD1480 treatment. Data represents mean ± sem of three replicates. The analysis was independently repeated at least two times. (*, P < 0.01; **, P < 0.01; ***, P < 0.001 by one-way ANOVA test (results were confirmed by the Kruskal-Wallis test)).
Figure 2.
Figure 2.. PD1 expression on T cells of thyroid cancer patients and healthy donors.
(A) Representative flow cytometry plots show CD4:CD8 distribution and PD1 expression from CD8+ T cells isolated from peripheral blood of thyroid cancer patients. The histogram plots show level of expression of PD1 (gray solid line) relative to FMO control (unfilled line). Percent positive for PD1 and MFI in parenthesis are shown. (B) The percentages of PD1+/CD8+ T cells are significantly higher in blood from PDTC/ATC patients compared to WDPTC patients or healthy donors. Open circles represent data from patients who presented lung metastasis at the time of diagnosis or recurrence (*, P < 0.05; **, P < 0.01 by Wilcoxon rank-sum test). (C) No significant correlation was observed in the percentages of CD8+/PD1+ T cells in thyroid cancer patient’s peripheral blood and PD-L1 expression in the tumor. ns = not significant. Statistical difference was analyzed using Wilcoxon rank-sum test.
Figure 3.
Figure 3.. Inhibition of PD1 leads to increased target cell killing by ICAM1-CAR T cells in vitro independent of PD1 expression levels.
(A) Representative flow cytometry plots of ATC cell lines 8505C and JV, and 293T and HeLa control cell lines, which are stained for ICAM1 (first row) and PD-L1 (second row) antibodies. FMO control and antibody-stained plots are indicated by unfilled and gray solid lines, respectively. Flow cytometry plots showing the level of expression of PD-L1 (gray solid line) and PD-L2 (red line) relative to FMO control (unfilled line) (third row). (B) Cytotoxicity of thyroid cancer patient-derived ICAM1-CAR T cells (for donor and CAR T information, refer to Supplementary Table 1) against target ATC cell lines and control cells were examined in combination with PD1 blocking antibody. Peripheral T cells were isolated from patients with ATC, PDTC, and WDPTC. 5×10³ target cells were co-cultured either with non-transduced T (NT) cells or anti-ICAM1 CAR T cells at a 2.5:1 ratio (1.25×10⁴ cells) in media (n = 3–7 per group and representative of two to three independent experiments). (C) Differences in target cell killing were compared at a timepoint when approximately 50% of the 8505C cells were killed (24 hr for ATC, 22 hr for PDTC, and 48 hr for WDPTC). Statistical significance was determined by one-way ANOVA for CAR T vs. CAR T + αPD1 and CAR T vs. non-transduced T (NT) cells. *, P < 0.05; **, P < 0.01; ***, P < 0.001. Data represents mean ± sem (results were confirmed by the Kruskal-Wallis test).
Figure 4.
Figure 4.. PD1 inhibition enhances the therapeutic efficacy and survival benefit of CAR T treatment in 8505C xenografts.
(A) ICAM1-targeting mAS CAR T cells were generated from three commercial donor T cells using automated process via CliniMACS Prodigy (31). Flow cytometry plots are shown for the CD4:CD8 distribution among resting peripheral CD3+ T cells, PD1 expression in CD8+ T cells, and frequencies of cmyc+ to estimate the CAR T lentiviral transduction rate and SSTR2+. (B) E:T assays were carried out with each donor CAR T and NT cells alone or with combination of anti-PD1 antibody (5 μg/ml). For each CAR T donor cells, matching NT cells from the same donor was used in the experiment (n = 3; *, P < 0.05; **, P < 0.01; ***, P < 0.001 by one-way ANOVA test; results were confirmed by the Kruskal-Wallis test). The analysis was independently repeated at least two times. (C) Representative weekly whole-body luminescence images of animals with 8505C xenografts, which received 106 ICAM1-CAR T (mAS) cells either with anti-PD1 antibody administration (+) or alone (−). Administration of CAR T (i.v.) and αPD1 antibody (i.p.) started ~5 days after 8505C injection into NSG mice. CAR T was a single treatment, while αPD1 antibody (150 μg/mouse) administration was twice a week for 8 weeks. CAR T cells made from three different donor sources are shown. ⊘ marks the death due to tumor burden. (D) Quantitation of lung luminescence signals (P/s/mm2) over time in mice with 8505C xenografts treated with CAR T and αPD1, CAR T, or no treatment (n = 7 for no T; n = 20 for CAR T; n = 12 for CAR + αPD1 from donor-matched T cells; P < 0.01 for CAR T-1 vs. CAR T-1 + α-PD1 by Wilcoxon rank-sum test). (E) Survival curve of animals with 8505C xenografts with various treatments and no treatment is shown (n = 7 for no T; n = 8 for NT; n = 6 for NT + α-PD1; n = 15 for CAR T; n = 12 for CAR T + α-PD1; *, P < 0.05 by the log-rank test). For survival analysis, CAR T cells and matching NT cells from three different donors was combined.
Figure 5.
Figure 5.. Administration of anti-PD1 antibody together with CAR T cells facilitated tumor killing and expansion of T cells specific to interaction with tumor cells in vivo.
(A) Longitudinal PET/CT images of NOTAOCT uptake in CAR T cells were taken in mice with 8505C xenografts treated with CAR T alone or co-administration of CAR T and anti-PD1 antibody. Images are maximum intensity projections of the entire mouse body (~20 mm-thick plane). PET intensity is pseudocolored in the range of 1–10%ID/cm3. (B) NOTAOCT uptake in the lung (%ID/cm3) were compared between CAR T and combination treatments of CAR T and anti-PD1 at each timepoint (n = 11–13 for CAR T; n = 7–9 for CAR T + α-PD1; *, P < 0.05 by Student’s t-test. The same statistical significance was retained by Wilcoxon rank-sum test; scatter dot represents each animal and horizontal bar marks the mean in each treatment group). (C) Representative IHC images of H&E, GFP for tumor, and CD3 for T cell staining in the lung lobes of xenografts, which received different treatments. (D-E) Quantitation of colocalization of CD3+ T cells and GFP+ tumor cells. Mouse lung tissues were harvested at 21 days post xenograft. (E) Cell density (absolute count/tissue area in mm2) was computed by digital analysis of CD3+ and GFP+ cells in high density tumor areas in the mouse lung. Two clusters of six different lung lobes from two mice were counted per treatment group (n = 12, *, P < 0.05; **, P < 0.01; ***, P < 0.001; ****, P < 0.0001 by Student’s t-test).
Figure 6.
Figure 6.. CAR T cell activity against tumor induces PD1 and PD-L1, which is rescued by anti-PD1 antibody in dual treatment.
(A) Representative flow cytometry plots of PD1 expression in T cells after incubation with target cells. ICAM1-CAR T (red line), NT (gray solid), and ICAM1-CAR T cells with JAK2 inhibitor AZD1480 (1 μM) (blue line). (B) Quantitation of the frequencies of PD1+ cells among CD3+ T cells in co-culture of CAR T or NT with different target cells. Data represents mean ± sem (n = 4–7; ***, P < 0.001; ****, P < 0.0001 by one-way ANOVA). (C) IHC images of PD1 in T cells infiltrating 8505C tumors in lung after CAR T or NT treatment. The cell density of PD1+ and CD3+ cells in the high density tumor spots in the mouse lung (n = 8–9 per group, data are combined from 1–2 tumor clusters in 3 distinct lung lobes from two mice for each group) was analzed by an imaging analysis software (HALO). The percentages of PD1+ cells among CD3+ T cells were compared for lung sections after CAR T or NT treatment (***, P < 0.001 by Student’s t-test). (D) IHC images of PD-L1 staining in mouse lung xenografted with 8505C tumor after treatments with CAR T or NT with or without anti-PD1 antibody. The cell density of PD-L1+ cells in the high density tumor area in the mouse lung was analyzed (n = 8–9 per group; *, P < 0.05; ***, P < 0.001 by Student’s t-test). Results confirmed by Wilcoxon rank-sum test and Krusal-Wallis test, where applicable.

References

    1. Cabanillas ME, McFadden DG, Durante C. Thyroid cancer. Lancet 2016;388(10061):2783–95 doi 10.1016/S0140-6736(16)30172-6. - DOI - PubMed
    1. Landa I, Ibrahimpasic T, Boucai L, Sinha R, Knauf JA, Shah RH, et al. Genomic and transcriptomic hallmarks of poorly differentiated and anaplastic thyroid cancers. J Clin Invest 2016;126(3):1052–66 doi 10.1172/JCI85271. - DOI - PMC - PubMed
    1. Smallridge RC, Ain KB, Asa SL, Bible KC, Brierley JD, Burman KD, et al. American Thyroid Association guidelines for management of patients with anaplastic thyroid cancer. Thyroid 2012;22(11):1104–39 doi 10.1089/thy.2012.0302. - DOI - PubMed
    1. Xu B, Ghossein R. Genomic Landscape of poorly Differentiated and Anaplastic Thyroid Carcinoma. Endocr Pathol 2016;27(3):205–12 doi 10.1007/s12022-016-9445-4. - DOI - PubMed
    1. Savvides P, Nagaiah G, Lavertu P, Fu P, Wright JJ, Chapman R, et al. Phase II trial of sorafenib in patients with advanced anaplastic carcinoma of the thyroid. Thyroid 2013;23(5):600–4 doi 10.1089/thy.2012.0103. - DOI - PMC - PubMed

Publication types

MeSH terms