

SYNGAP1 Controls the Maturation of Dendrites, Synaptic Function, and Network Activity in Developing Human Neurons
- PMID: 32887745
- PMCID: PMC7548701
- DOI: 10.1523/JNEUROSCI.1367-20.2020
SYNGAP1 Controls the Maturation of Dendrites, Synaptic Function, and Network Activity in Developing Human Neurons
Abstract
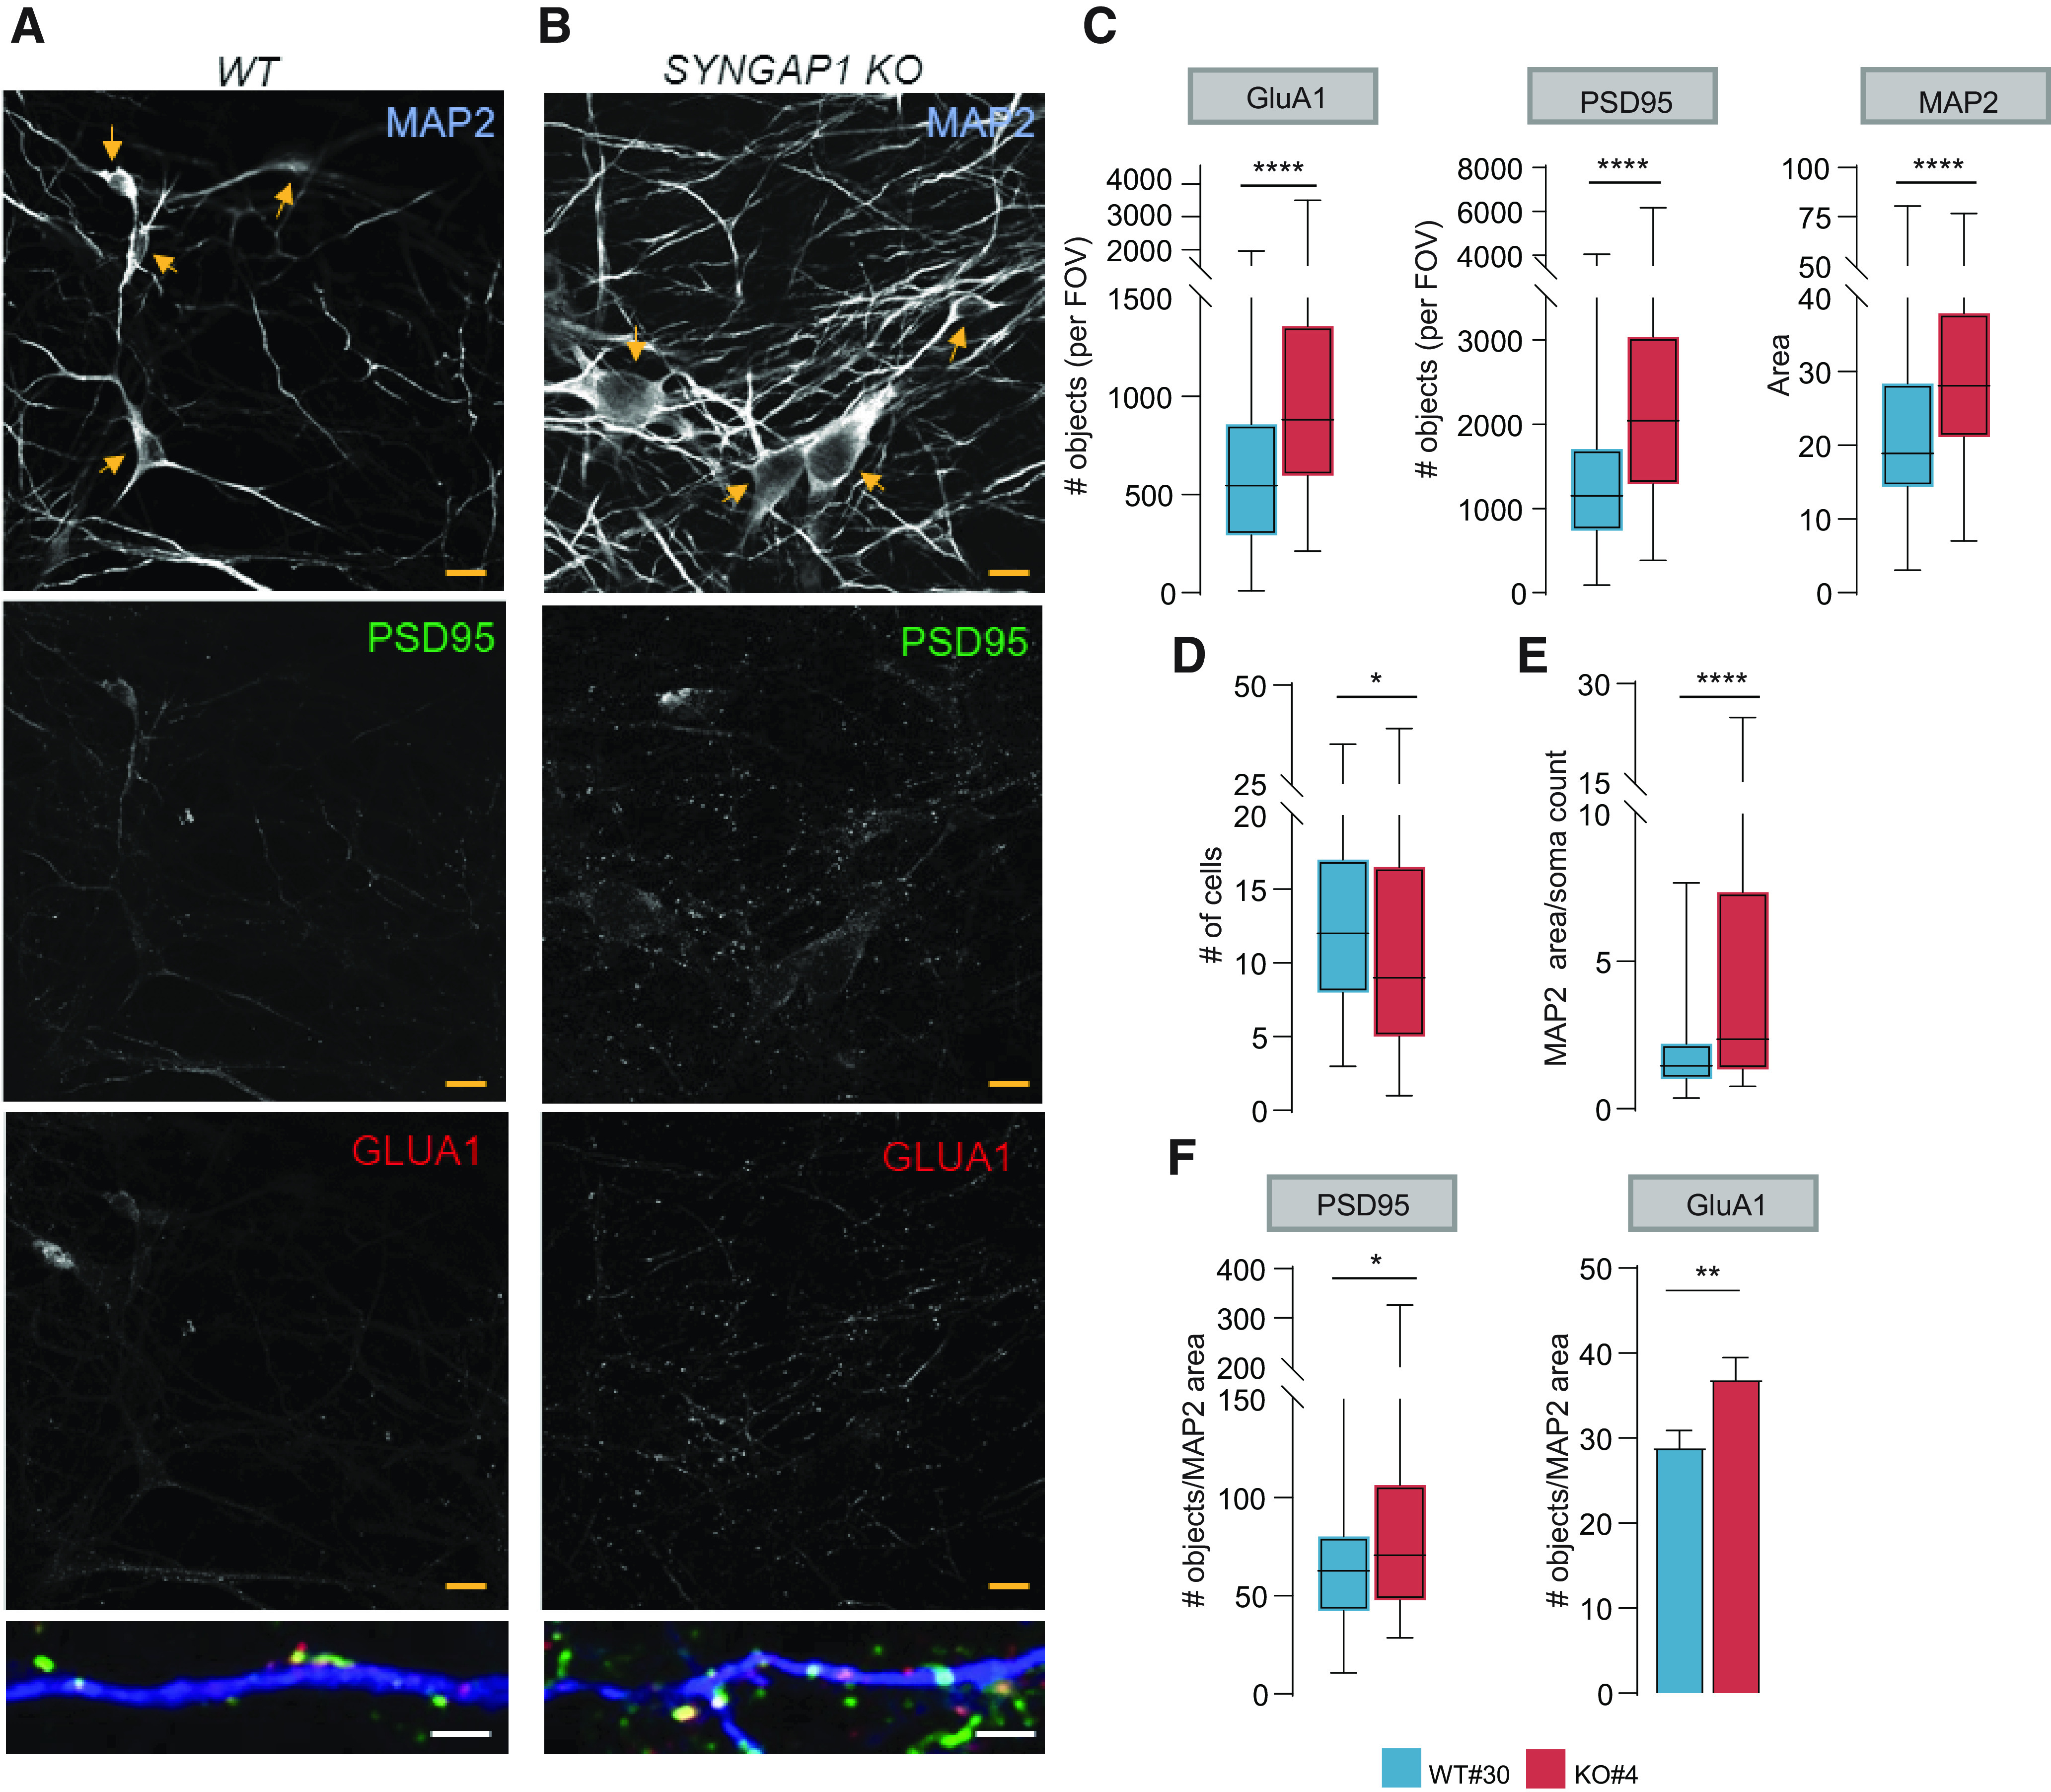
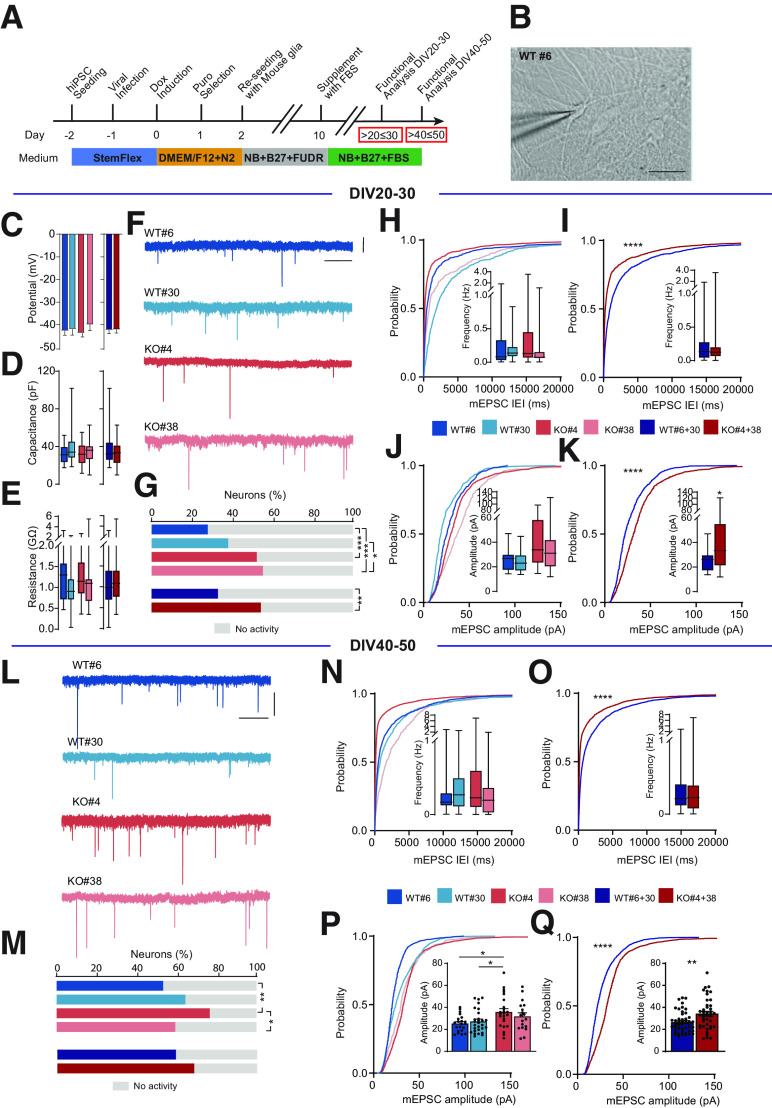
SYNGAP1 is a major genetic risk factor for global developmental delay, autism spectrum disorder, and epileptic encephalopathy. De novo loss-of-function variants in this gene cause a neurodevelopmental disorder defined by cognitive impairment, social-communication disorder, and early-onset seizures. Cell biological studies in mouse and rat neurons have shown that Syngap1 regulates developing excitatory synapse structure and function, with loss-of-function variants driving formation of larger dendritic spines and stronger glutamatergic transmission. However, studies to date have been limited to mouse and rat neurons. Therefore, it remains unknown how SYNGAP1 loss of function impacts the development and function of human neurons. To address this, we used CRISPR/Cas9 technology to ablate SYNGAP1 protein expression in neurons derived from a commercially available induced pluripotent stem cell line (hiPSC) obtained from a human female donor. Reducing SynGAP protein expression in developing hiPSC-derived neurons enhanced dendritic morphogenesis, leading to larger neurons compared with those derived from isogenic controls. Consistent with larger dendritic fields, we also observed a greater number of morphologically defined excitatory synapses in cultures containing these neurons. Moreover, neurons with reduced SynGAP protein had stronger excitatory synapses and expressed synaptic activity earlier in development. Finally, distributed network spiking activity appeared earlier, was substantially elevated, and exhibited greater bursting behavior in SYNGAP1 null neurons. We conclude that SYNGAP1 regulates the postmitotic maturation of human neurons made from hiPSCs, which influences how activity develops within nascent neural networks. Alterations to this fundamental neurodevelopmental process may contribute to the etiology of SYNGAP1-related disorders.SIGNIFICANCE STATEMENTSYNGAP1 is a major genetic risk factor for global developmental delay, autism spectrum disorder, and epileptic encephalopathy. While this gene is well studied in rodent neurons, its function in human neurons remains unknown. We used CRISPR/Cas9 technology to disrupt SYNGAP1 protein expression in neurons derived from an induced pluripotent stem cell line. We found that induced neurons lacking SynGAP expression exhibited accelerated dendritic morphogenesis, increased accumulation of postsynaptic markers, early expression of synapse activity, enhanced excitatory synaptic strength, and early onset of neural network activity. We conclude that SYNGAP1 regulates the postmitotic differentiation rate of developing human neurons and disrupting this process impacts the function of nascent neural networks. These altered developmental processes may contribute to the etiology of SYNGAP1 disorders.
Keywords: SYNGAP1; autism; development; epilepsy; iPSC; synapse.
Copyright © 2020 the authors.
Figures


References
-
- Aceti M, Creson TK, Vaissiere T, Rojas C, Huang WC, Wang YX, Petralia RS, Page DT, Miller CA, Rumbaugh G (2015) Syngap1 haploinsufficiency damages a postnatal critical period of pyramidal cell structural maturation linked to cortical circuit assembly. Biol Psychiatry 77:805–815. 10.1016/j.biopsych.2014.08.001 - DOI - PMC - PubMed
-
- Berryer MH, Hamdan FF, Klitten LL, Møller RS, Carmant L, Schwartzentruber J, Patry L, Dobrzeniecka S, Rochefort D, Neugnot-Cerioli M, Lacaille JC, Niu Z, Eng CM, Yang Y, Palardy S, Belhumeur C, Rouleau GA, Tommerup N, Immken L, Beauchamp MH, et al. (2013) Mutations in SYNGAP1 cause intellectual disability, autism, and a specific form of epilepsy by inducing haploinsufficiency. Hum Mutat 34:385–394. 10.1002/humu.22248 - DOI - PubMed
-
- Carvill GL, Heavin SB, Yendle SC, McMahon JM, O'Roak BJ, Cook J, Khan A, Dorschner MO, Weaver M, Calvert S, Malone S, Wallace G, Stanley T, Bye AM, Bleasel A, Howell KB, Kivity S, Mackay MT, Rodriguez-Casero V, Webster R, et al. (2013) Targeted resequencing in epileptic encephalopathies identifies de novo mutations in CHD2 and SYNGAP1. Nat Genet 45:825–830. 10.1038/ng.2646 - DOI - PMC - PubMed
-
- Clement JP, Aceti M, Creson TK, Ozkan ED, Shi Y, Reish NJ, Almonte AG, Miller BH, Wiltgen BJ, Miller CA, Xu X, Rumbaugh G (2012) Pathogenic SYNGAP1 mutations impair cognitive development by disrupting maturation of dendritic spine synapses. Cell 151:709–723. 10.1016/j.cell.2012.08.045 - DOI - PMC - PubMed
Publication types
MeSH terms
Substances
Grants and funding
LinkOut - more resources
Full Text Sources