

Revised estimates of ocean-atmosphere CO2 flux are consistent with ocean carbon inventory
- PMID: 32887875
- PMCID: PMC7474059
- DOI: 10.1038/s41467-020-18203-3
Revised estimates of ocean-atmosphere CO2 flux are consistent with ocean carbon inventory
Abstract
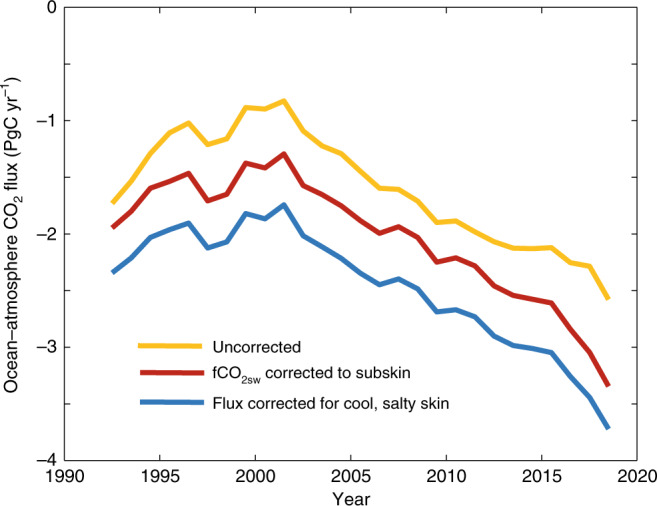
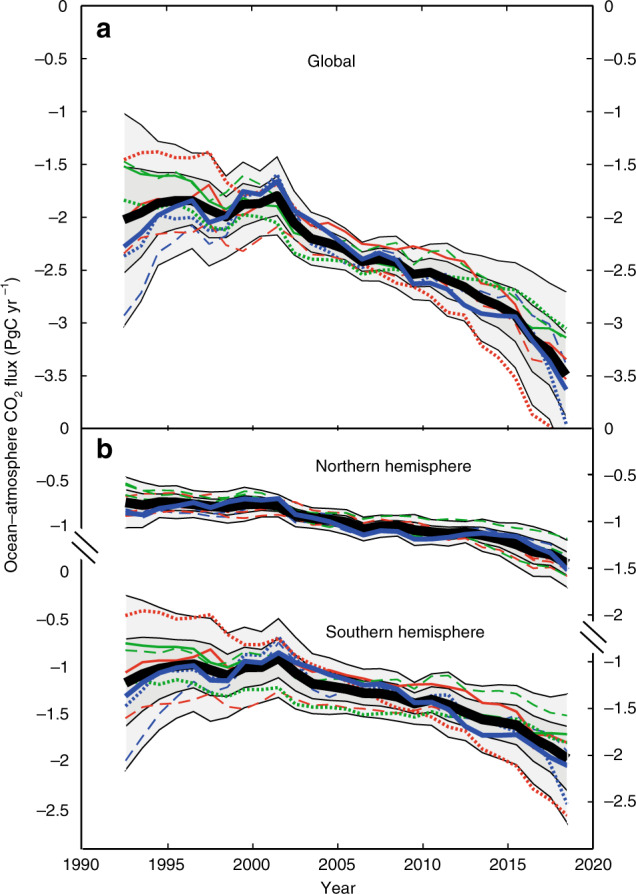
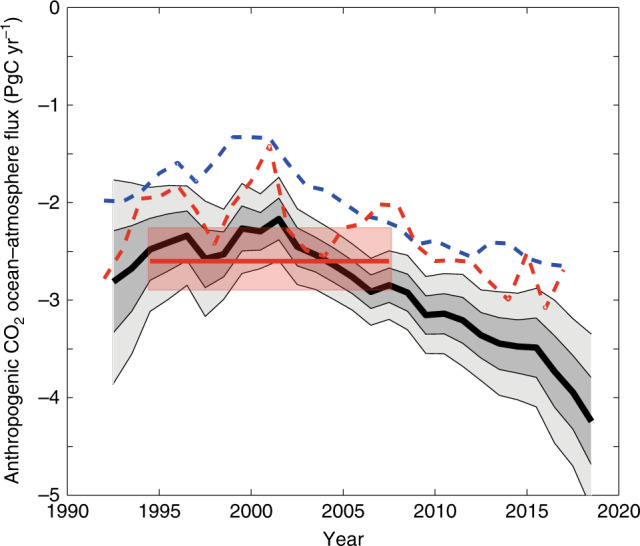
The ocean is a sink for ~25% of the atmospheric CO2 emitted by human activities, an amount in excess of 2 petagrams of carbon per year (PgC yr-1). Time-resolved estimates of global ocean-atmosphere CO2 flux provide an important constraint on the global carbon budget. However, previous estimates of this flux, derived from surface ocean CO2 concentrations, have not corrected the data for temperature gradients between the surface and sampling at a few meters depth, or for the effect of the cool ocean surface skin. Here we calculate a time history of ocean-atmosphere CO2 fluxes from 1992 to 2018, corrected for these effects. These increase the calculated net flux into the oceans by 0.8-0.9 PgC yr-1, at times doubling uncorrected values. We estimate uncertainties using multiple interpolation methods, finding convergent results for fluxes globally after 2000, or over the Northern Hemisphere throughout the period. Our corrections reconcile surface uptake with independent estimates of the increase in ocean CO2 inventory, and suggest most ocean models underestimate uptake.
Conflict of interest statement
The authors declare no competing interests.
Figures
References
-
- Bakker DCE, et al. A multi-decade record of high-quality fCO2 data in version 3 of the Surface Ocean CO2 Atlas (SOCAT) Earth Syst. Sci. Data. 2016;8:383–413. doi: 10.5194/essd-8-383-2016. - DOI
-
- Pfeil B, et al. A uniform, quality controlled Surface Ocean CO2 Atlas (SOCAT) Earth Syst. Sci. Data. 2013;5:125–143. doi: 10.5194/essd-5-125-2013. - DOI
-
- Sabine CL, et al. Surface Ocean CO2 Atlas (SOCAT) gridded data products. Earth Syst. Sci. Data. 2013;5:145–153. doi: 10.5194/essd-5-145-2013. - DOI
-
- Denvil-Sommer A, Gehlen M, Vrac M, Mejia C. LSCE-FFNN-v1: a two-step neural network model for the reconstruction of surface ocean pCO2 over the global ocean. Geosci. Model Dev. 2019;12:2091–2105. doi: 10.5194/gmd-12-2091-2019. - DOI
-
- Gregor L, Kok S, Monteiro PMS. Empirical methods for the estimation of Southern Ocean CO2: support vector and random forest regression. Biogeosciences. 2017;14:5551–5569. doi: 10.5194/bg-14-5551-2017. - DOI
Publication types
LinkOut - more resources
Full Text Sources
