. 2020 Sep 4;11(1):4413.
doi: 10.1038/s41467-020-18249-3.

Pharmacologically reversible zonation-dependent endothelial cell transcriptomic changes with neurodegenerative disease associations in the aged brain

Affiliations

Pharmacologically reversible zonation-dependent endothelial cell transcriptomic changes with neurodegenerative disease associations in the aged brain

Lei Zhao et al. Nat Commun. .

Abstract

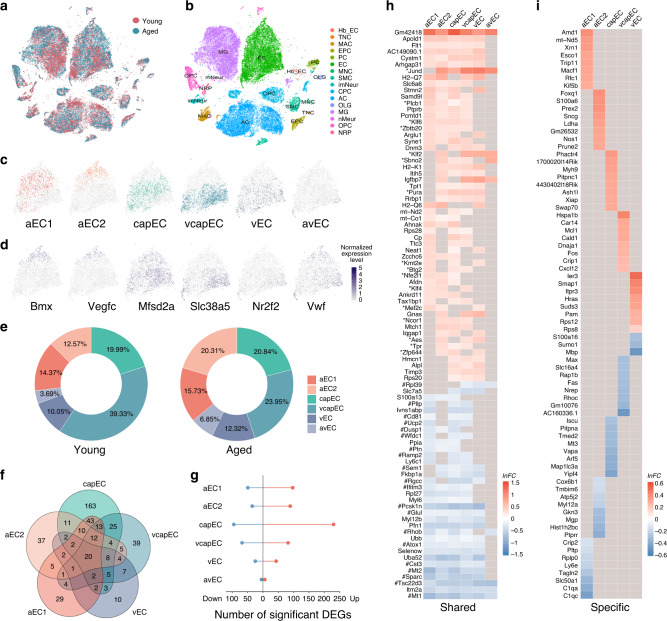
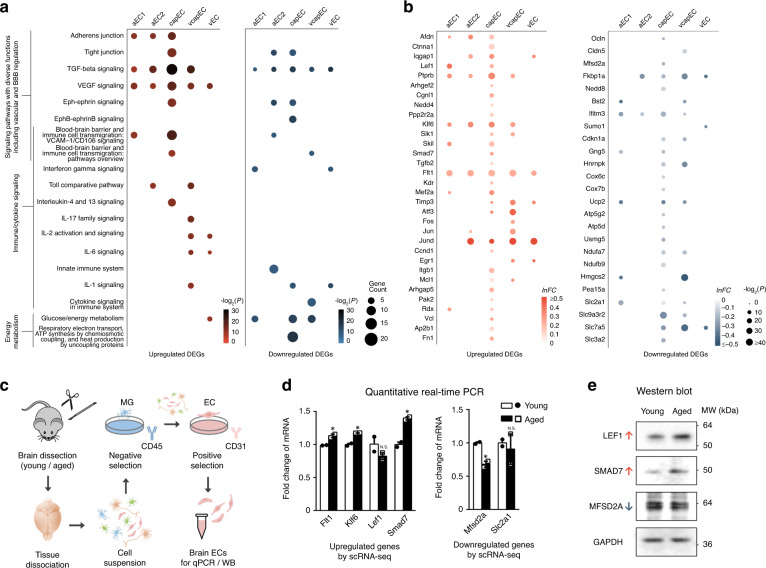
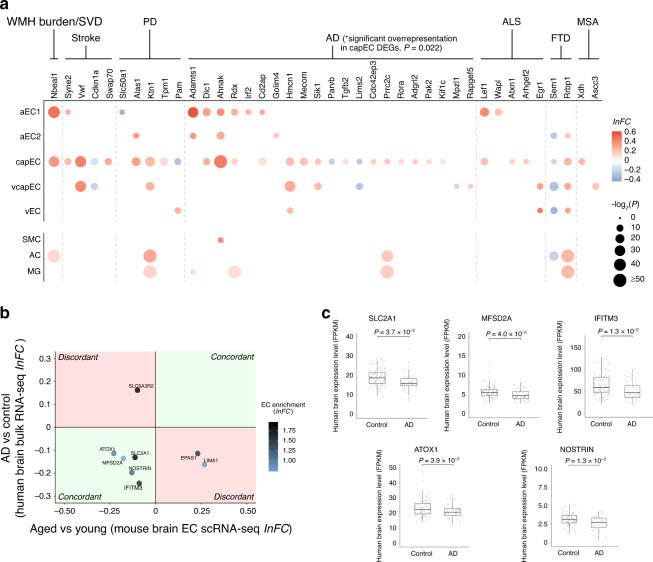
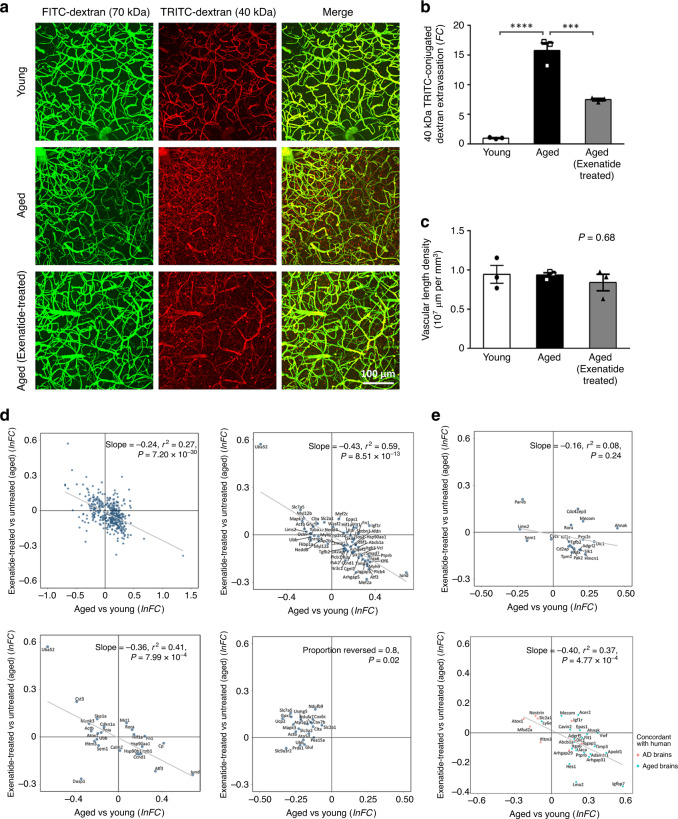
The molecular signatures of cells in the brain have been revealed in unprecedented detail, yet the ageing-associated genome-wide expression changes that may contribute to neurovascular dysfunction in neurodegenerative diseases remain elusive. Here, we report zonation-dependent transcriptomic changes in aged mouse brain endothelial cells (ECs), which prominently implicate altered immune/cytokine signaling in ECs of all vascular segments, and functional changes impacting the blood-brain barrier (BBB) and glucose/energy metabolism especially in capillary ECs (capECs). An overrepresentation of Alzheimer disease (AD) GWAS genes is evident among the human orthologs of the differentially expressed genes of aged capECs, while comparative analysis revealed a subset of concordantly downregulated, functionally important genes in human AD brains. Treatment with exenatide, a glucagon-like peptide-1 receptor agonist, strongly reverses aged mouse brain EC transcriptomic changes and BBB leakage, with associated attenuation of microglial priming. We thus revealed transcriptomic alterations underlying brain EC ageing that are complex yet pharmacologically reversible.


Conflict of interest statement

Exenatide used in the study was provided by AstraZeneca Hong Kong Limited. L.Y.C.Y. and J.H. were employed by Aptorum Group Limited and honorary research staff of CUHK. AstraZeneca Hong Kong Limited and Aptorum Group Limited had otherwise no role in the funding, design, or execution of the study.

Figures

Fig. 1
Fig. 1. Profiling mouse brain endothelial cell transcriptomes across age.
a t-SNE visualization of single-cell transcriptomes from young adult (2–3 months old, n = 31,555 cells from five mice, brown) and aged (18–20 months old, n = 12,367 cells from five mice, blue) mouse brains. b Primary cell type clusters identified based on marker gene expression patterns. Cell type abbreviations: EC endothelial cell, SMC smooth muscle cell, PC pericyte, MG microglia, AC astrocyte, NRP neuronal restricted precursor, OPC oligodendrocyte precursor cell, OLG oligodendrocyte, mNeur mature neuron, imNeur immature neuron, EPC ependymocyte, CPC choroid plexus epithelial cell, Hb_EC hemoglobin-expressing vascular cell, MAC macrophage, TNC tanycyte, MNC monocyte. c t-SNE visualization of EC subtypes, including two arterial (aEC1, n = 1141 cells and 526 cells; aEC2, n = 998 and 679 cells from young adult and aged groups, respectively), capillary (capEC, n = 1587 and 697 cells), venous and capillary (vcapEC, n = 3122 and 801 cells), venous (vEC, n = 798 and 412 cells), and arterial/venous (avEC, n = 293 and 229 cells) subtypes. Subsequent differential expression analyses for each EC subtype presented were based on these cells (i.e. sharing the same sample sizes). For visualization, different colors are used for the subtypes, and 6000 cells were subsampled and shown for better clarity. d Expression patterns of arterial (Bmx, Vegfc), capillary (Mfsd2a), venous (Slc38a5, Nr2f2), and arterial/venous (Vwf) marker genes in ECs visualized by t-SNE. For clarity, 6000 cells were subsampled and shown. e Proportions of EC subtypes obtained from each age group. Scale bar: normalized expression level. f Venn diagram showing the overlap of significant differentially expressed genes (DEGs) (FDR-adjusted P-value < 0.05 and |lnFC | > 0.1) between five EC subtypes. g Numbers of significant upregulated (red dots) and downregulated (blue dots) DEGs for each EC subtype. h Heatmap of shared (significant in ≥3 EC subtypes) upregulated (upper panel) and downregulated (lower panel) DEGs in the aged brain. Remarks: asterisks denote transcription factor/regulatory genes, and hashtags denote stress response genes by the Gene Ontology annotation. i Heatmap of EC subtype-specific upregulated (upper panel) and downregulated (lower panel) DEGs (i.e. significant differential expression with adjusted P-value < 0.05 and |lnFC| > 0.1 in only one EC subtype). Up to eight are shown for each EC subtype.
Fig. 2
Fig. 2. Pathway analysis and differential expression validation.
a Dot plots of important signaling pathways whose functions include vascular and BBB regulation, immune/cytokine signaling, respiratory electron transport chain, and glucose/energy metabolism pathways with significant enrichment in the aged brain for upregulated (left panel) and downregulated (right panel) EC DEGs. b Dot plots showing the differential expression profile of selected upregulated (left panel) and downregulated (right panel) genes in aged brain ECs associated with enriched pathways shown in a in the different EC subtypes. c Schematics of validation experiments by quantitative PCR and western blot for selected DEGs found by scRNA-seq (including Flt1, Klf6, Lef1, Smad7, Mfsd2a, and Slc2a1), in whole-brain ECs isolated by immunopanning. d Expression changes of selected genes in immunopanned ECs by quantitative PCR (for each gene, quantified as fold change relative to young adult group mean, error bars represent S.E.M.; Flt1: P = 0.036; Klf6: P = 0.011; Lef1: P = 0.28; Smad7: P = 0.012; Mfsd2a: P = 0.022; Slc2a1: P = 0.73; asterisks in the plot indicates P < 0.05 for easy visualization, two-sided unpaired t-test without adjustment for multiple comparisons; for each group, samples from n = 3 mice were pooled and measured in duplicate, resulting in two measurement values for each gene). e Western blot assays of the encoded proteins of a subset of aged brain EC-upregulated (LEF1, SMAD7) and downregulated (MFSD2A) genes in immunopanned ECs (samples pooled from three mice for each group). Source data underlying d, e are provided as a Source Data file.
Fig. 3
Fig. 3. Disease associations of aged brain endothelial cell differential expressions.
a Differential expression profiles of aged brain EC subtype DEGs whose human orthologs are GWAS genes of cerebrovascular or neurodegenerative diseases examined. capEC DEGs had the most overlap with a significant overrepresentation of AD GWAS genes (P = 0.022, hypergeometric test). The differential expressions of these genes in smooth muscle cell (SMC), astrocyte (AC), and microglia (MG) are also shown. Disease abbreviations: WMH burden white matter hyperintensity burden, SVD cerebral small vessel disease, PD Parkinson’s disease, AD Alzheimer disease, ALS amyotrophic lateral sclerosis, FTD frontotemporal dementia, MSA multiple systems atrophy. b Human AD brain differential expressions relative to age-matched control subjects (FDR-adjusted P-value < 0.05, y-axis) plotted against expression changes in pooled aged mouse brain ECs (x-axis), showing aged mouse brain EC DEGs whose human orthologs had concordant (first and third quadrants, light green) or discordant (second and fourth quadrants, light red) expression changes in human AD brains. Only DEGs with at least twofold EC-enrichment (lnFC of EC expression relative to other cell types >0.7) are shown, with color of dots representing the degree of enrichment. c Human brain expression levels of genes with concordant expression changes in human AD and aged mouse brains (n = 111 samples from 30 control brains, 58 samples from 16 AD brains; two-sided unpaired t-test with FDR-adjustment for multiple comparisons). Black horizontal line: median; upper and lower bounds of box: 75th and 25th percentiles respectively; upper and lower bounds of vertical lines: upper quartile + 1.5 × interquartile range or maximum (whichever is smaller), and lower quartile − 1.5 × interquartile range or minimum (whichever is larger), respectively.
Fig. 4
Fig. 4. Functional and transcriptomic reversal of ageing-associated endothelial changes by exenatide treatment.
a Three-dimensional rendered images (top view) of in vivo two-photon imaging of cerebral vasculature and blood–brain barrier (BBB) leakage in the mouse somatosensory cortex by co-injection of 70 kDa FITC-conjugated dextran (FITC-dextran, green) and 40 kDa TRITC-conjugated dextran (TRITC-dextran, red). FITC-dextran remained in the vasculature and allowed reconstruction of vessels, while extravasation of TRITC-dextran served as an indicator of BBB leakage which was quantified for young adult, aged and exenatide-treated aged mouse groups. b Volumetric quantification of TRITC-dextran extravasation showing BBB breakdown in aged (18–20 months old) relative to young adult mice (2–3 months old) (mean fold change (FC) in volume of extravasated TRITC-dextran relative to young adult group ± S.E.M. = 15.8 ± 1.3; P = 2.2 × 10−5 for aged vs young adult mouse group, 3 image stacks were acquired to obtain the mean for each animal, n = 3 mice for each group, one-way ANOVA with Tukey’s post-hoc test), which was significantly reduced by exenatide treatment (5 nmol/kg/day I.P. for 4–5 weeks starting at 17–18 months old, mean fold change relative to young adult group ± S.E.M. = 7.5 ± 0.2; P = 5.9 × 10−4 for exenatide-treated vs untreated aged mouse group, 3 image stacks were acquired to obtain the mean for each animal, n = 3 mice for each group, one-way ANOVA with Tukey’s post-hoc test). c, Cortical vascular length density from the three experimental groups (mean cortical vascular length density ± S.E.M. = 0.95 ± 0.11, 0.94 ± 0.03, 0.84 ± 0.11 × 107 μm per mm3 in young adult, aged and exenatide-treated aged groups respectively, P = 0.68, one-way ANOVA). Source data underlying b, c are provided as a Source Data file. d Reversal of brain capillary EC overall (left upper panel), vascular regulatory (right upper panel), immune/cytokine signaling (left lower panel) and energy metabolism (right lower panel) associated gene expression changes by exenatide treatment in aged mouse. e Reversal of aged mouse brain EC differential expressions whose human orthologs are AD GWAS genes in capEC (upper panel), or had concordant changes in human normal aged or AD brains in all ECs pooled (lower panel).

References

    1. Østergaard L, et al. Cerebral small vessel disease: capillary pathways to stroke and cognitive decline. J. Cereb. Blood Flow. Metab. 2016;36:302–325. - PMC - PubMed
    1. Erdő F, Denes L, Lange Ede. Age-associated physiological and pathological changes at the blood-brain barrier: a review. J. Cereb. Blood Flow. Metab. 2017;37:4–24. - PMC - PubMed
    1. Daneman R, Zhou L, Kebede AA, Barres BA. Pericytes are required for blood–brain barrier integrity during embryogenesis. Nature. 2010;468:562–566. - PMC - PubMed
    1. Armulik A, et al. Pericytes regulate the blood–brain barrier. Nature. 2010;468:557–561. - PubMed
    1. Abbott N, Rönnbäck L, Hansson E. Astrocyte-endothelial interactions at the blood-brain barrier. Nat. Rev. Neurosci. 2006;7:41–53. - PubMed

Publication types