

Marker aided introgression of 'Saltol', a major QTL for seedling stage salinity tolerance into an elite Basmati rice variety 'Pusa Basmati 1509'
- PMID: 32887905
- PMCID: PMC7474085
- DOI: 10.1038/s41598-020-70664-0
Marker aided introgression of 'Saltol', a major QTL for seedling stage salinity tolerance into an elite Basmati rice variety 'Pusa Basmati 1509'
Abstract
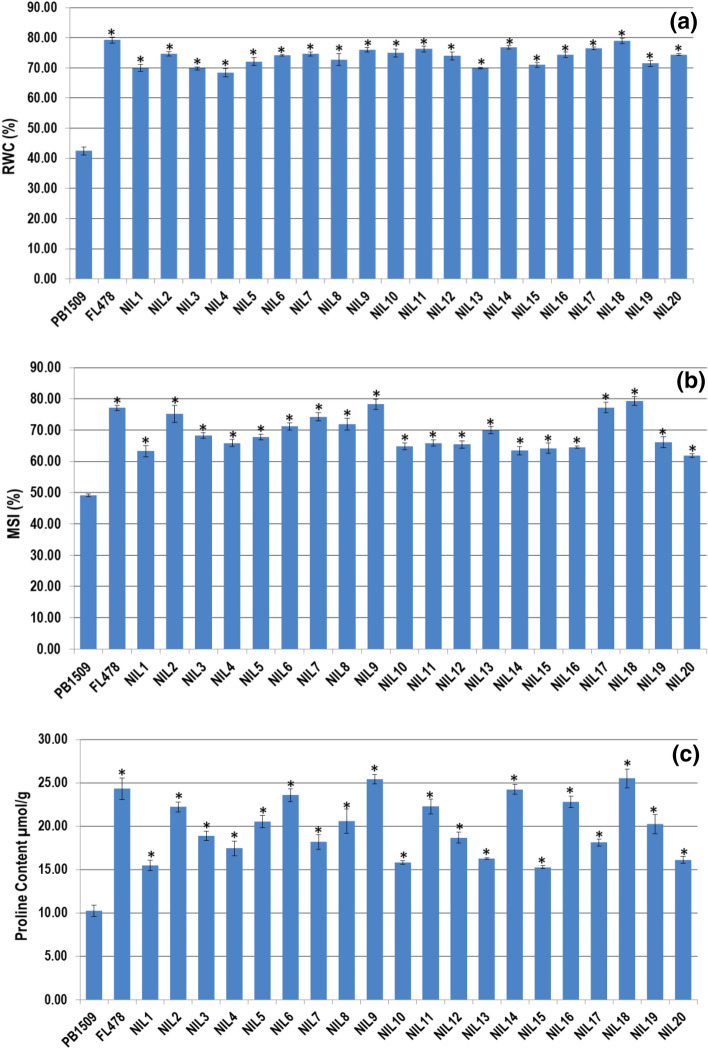
Marker assisted backcross breeding was used to transfer Saltol, a major QTL for seedling stage salinity tolerance from the donor FL478 to Pusa Basmati 1509 (PB 1509), a high yielding and early maturing Basmati rice variety. Foreground selection was carried out using three markers namely, AP3206f, RM3412b and RM10793, linked to Saltol. In addition, 105 genome-wide SSR markers polymorphic between FL478 and PB 1509 were used in background selection. Among the BC3F4 near isogenic lines (NILs) developed, recurrent parent genome recovery ranged from 96.67 to 98.57%. Multi-season evaluation identified some of the NILs showing significantly higher yield with grain and cooking quality comparable to PB 1509. All the NILs exhibited tolerance to salinity with significantly higher relative water content, membrane stability index and proline content as compared to PB 1509. The root and shoot concentration of Na+, K+ and Na+/K+ in NILs was at par with FL478 under stress conditions. The gene OsHKT1;5 located in the Saltol region showed higher expression levels under stress indicating its role in conferring salinity tolerance. Salt tolerant NILs of PB 1509 will be useful in stabilizing production in salt affected areas.
Conflict of interest statement
The authors declare no competing interests.
Figures


Similar articles
-
Marker Aided Incorporation of Saltol, a Major QTL Associated with Seedling Stage Salt Tolerance, into Oryza sativa 'Pusa Basmati 1121'.Front Plant Sci. 2017 Jan 26;8:41. doi: 10.3389/fpls.2017.00041. eCollection 2017. Front Plant Sci. 2017. PMID: 28184228 Free PMC article.
-
Marker-Assisted Introgression of Saltol QTL Enhances Seedling Stage Salt Tolerance in the Rice Variety "Pusa Basmati 1".Int J Genomics. 2018 Feb 11;2018:8319879. doi: 10.1155/2018/8319879. eCollection 2018. Int J Genomics. 2018. PMID: 29785398 Free PMC article.
-
Introgressed Saltol QTL Lines Improves the Salinity Tolerance in Rice at Seedling Stage.Front Plant Sci. 2020 Jun 11;11:833. doi: 10.3389/fpls.2020.00833. eCollection 2020. Front Plant Sci. 2020. PMID: 32595689 Free PMC article.
-
Salinity stress tolerance and omics approaches: revisiting the progress and achievements in major cereal crops.Heredity (Edinb). 2022 Jun;128(6):497-518. doi: 10.1038/s41437-022-00516-2. Epub 2022 Mar 5. Heredity (Edinb). 2022. PMID: 35249098 Free PMC article. Review.
-
Pusa Basmati 1121 - a rice variety with exceptional kernel elongation and volume expansion after cooking.Rice (N Y). 2018 Apr 9;11(1):19. doi: 10.1186/s12284-018-0213-6. Rice (N Y). 2018. PMID: 29629488 Free PMC article. Review.
Cited by
-
Integrative Approach for Precise Genotyping and Transcriptomics of Salt Tolerant Introgression Rice Lines.Front Plant Sci. 2022 Jan 21;12:797141. doi: 10.3389/fpls.2021.797141. eCollection 2021. Front Plant Sci. 2022. PMID: 35126422 Free PMC article.
-
Genome wide association study of MAGIC population reveals a novel QTL for salinity and sodicity tolerance in rice.Physiol Mol Biol Plants. 2022 Apr;28(4):819-835. doi: 10.1007/s12298-022-01174-8. Epub 2022 Apr 21. Physiol Mol Biol Plants. 2022. PMID: 35592486 Free PMC article.
-
Identification of Candidate Genes for Salt Tolerance at the Seedling Stage Using Integrated Genome-Wide Association Study and Transcriptome Analysis in Rice.Plants (Basel). 2023 Mar 21;12(6):1401. doi: 10.3390/plants12061401. Plants (Basel). 2023. PMID: 36987089 Free PMC article.
-
DRR Dhan 58, a Seedling Stage Salinity Tolerant NIL of Improved Samba Mahsuri Shows Superior Performance in Multi-location Trials.Rice (N Y). 2022 Aug 17;15(1):45. doi: 10.1186/s12284-022-00591-3. Rice (N Y). 2022. PMID: 35976520 Free PMC article.
-
Genome-Wide Association Study Reveals Marker-Trait Associations for Early Vegetative Stage Salinity Tolerance in Rice.Plants (Basel). 2021 Mar 16;10(3):559. doi: 10.3390/plants10030559. Plants (Basel). 2021. PMID: 33809618 Free PMC article.
References
-
- Vinod KK, Krishnan GS, Babu NN, Nagarajan M, Singh AK. Improving salt tolerance in rice: looking beyond the conventional. In: Ahmad P, Azooz MM, Prasad MNV, editors. Salt Stress in Plants: Signalling, Omics and Adaptations. New York: Springer; 2013. pp. 219–260.
-
- Yeo AR, Yeo ME, Flowers SA, Flowers TJ. Screening of rice (Oryza sativa L.) genotypes for physiological characters contributing to salinity resistance, and their relationship to overall performance. Theor. Appl. Genet. 1990;79:377–384. - PubMed
-
- Noble CL, Rogers NE. Arguments for the use of physiological criteria for improving the salt tolerance in crops. Plant Soil. 1992;146:99–107.
-
- Zeng L, Shannon MC. Effects of salinity on grain yield and yield components of rice at different seeding densities. Agron. J. 2000;92:418–423.
LinkOut - more resources
Full Text Sources
