. 2020 Sep 4;10(1):14649.
doi: 10.1038/s41598-020-71207-3.

Impact of DNA extraction on whole genome sequencing analysis for characterization and relatedness of Shiga toxin-producing Escherichia coli isolates

Affiliations

Impact of DNA extraction on whole genome sequencing analysis for characterization and relatedness of Shiga toxin-producing Escherichia coli isolates

Stéphanie Nouws et al. Sci Rep. .

Abstract

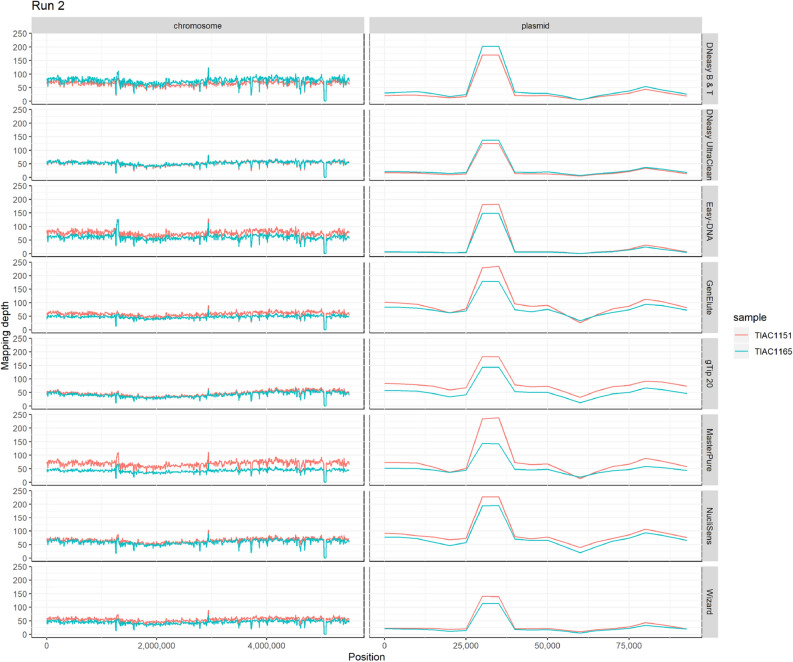
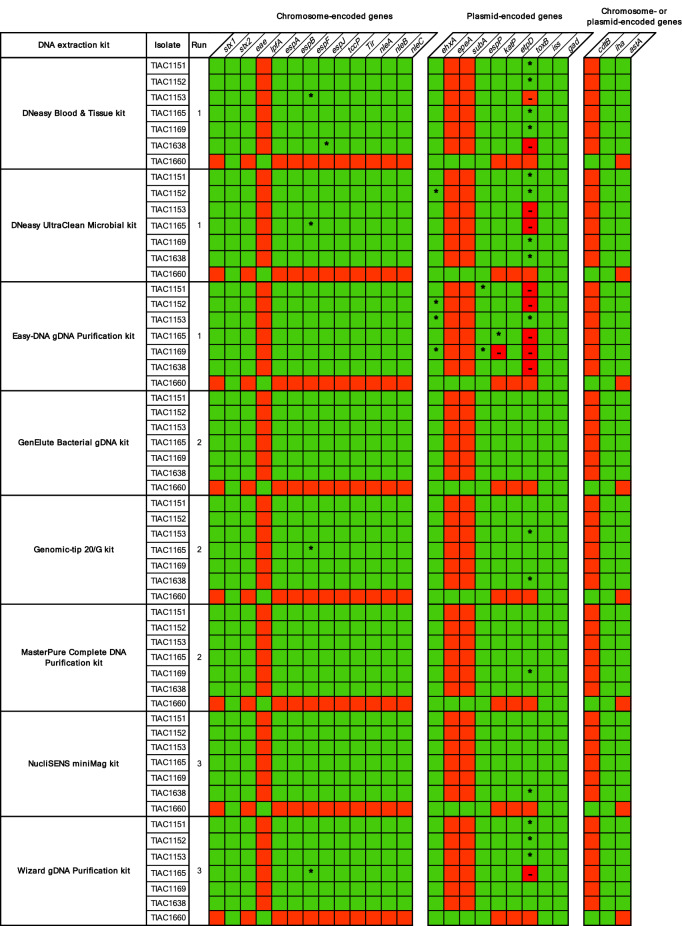
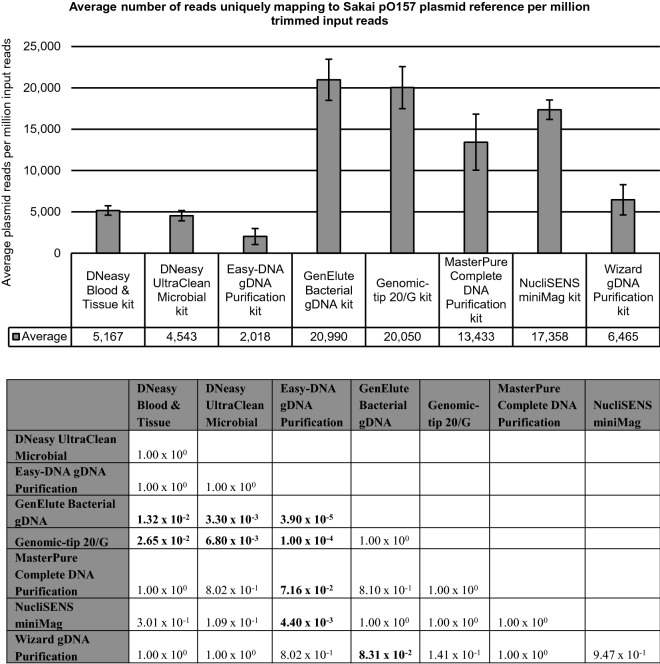
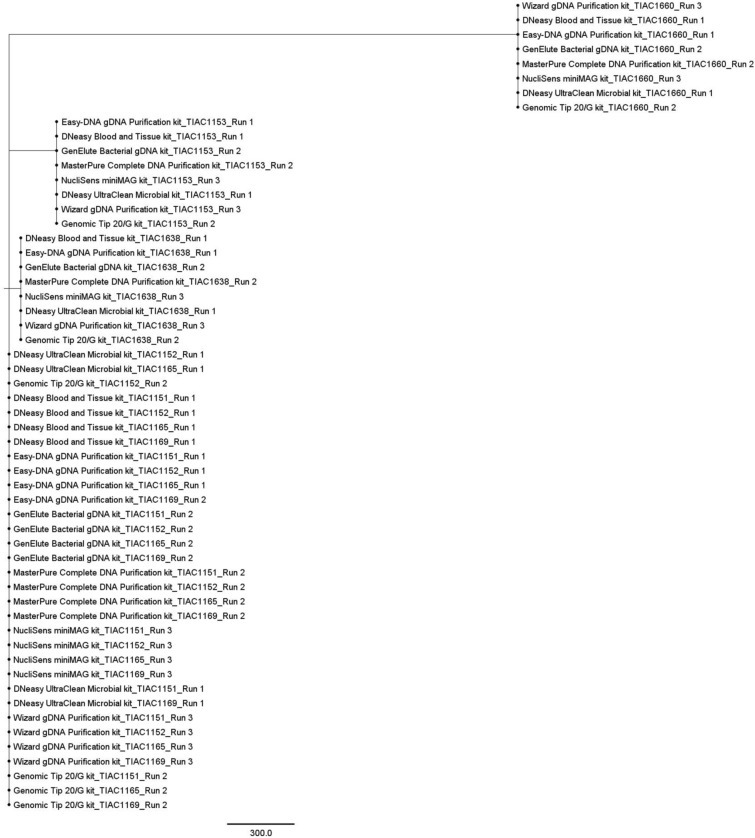
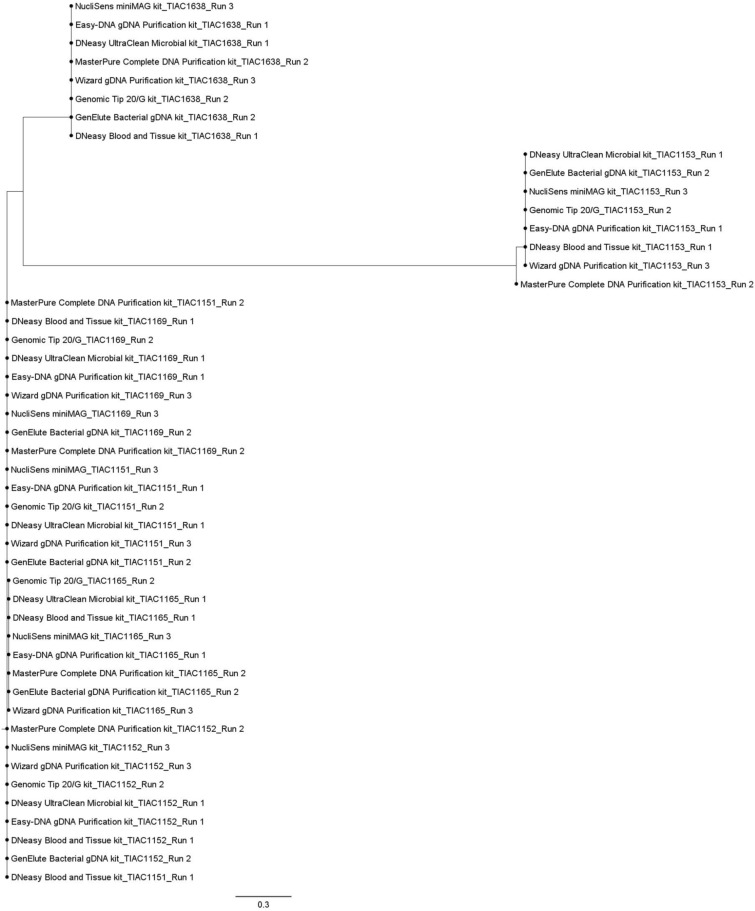
Whole genome sequencing (WGS) has proven to be the ultimate tool for bacterial isolate characterization and relatedness determination. However, standardized and harmonized workflows, e.g. for DNA extraction, are required to ensure robust and exchangeable WGS data. Data sharing between (inter)national laboratories is essential to support foodborne pathogen control, including outbreak investigation. This study evaluated eight commercial DNA preparation kits for their potential influence on: (i) DNA quality for Nextera XT library preparation; (ii) MiSeq sequencing (data quality, read mapping against plasmid and chromosome references); and (iii) WGS data analysis, i.e. isolate characterization (serotyping, virulence and antimicrobial resistance genotyping) and phylogenetic relatedness (core genome multilocus sequence typing and single nucleotide polymorphism analysis). Shiga toxin-producing Escherichia coli (STEC) was selected as a case study. Overall, data quality and inferred phylogenetic relationships between isolates were not affected by the DNA extraction kit choice, irrespective of the presence of confounding factors such as EDTA in DNA solution buffers. Nevertheless, completeness of STEC characterization was, although not substantially, influenced by the plasmid extraction performance of the kits, especially when using Nextera XT library preparation. This study contributes to addressing the WGS challenges of standardizing protocols to support data portability and to enable full exploitation of its potential.


Conflict of interest statement

The authors declare no competing interests.

Figures

Figure 1
Figure 1
Overview of median mapping depths against the Sakai E. coli O157:H7 reference genome and the Sakai E. coli pO157 plasmid for sequencing run replicates TIAC1151 and TIAC1165 per kit, sequenced in run 2. The median read mapping depth for each sample was calculated using a sliding window of 10,000 bases shifted by 5,000 bases for each data point. Abbreviations: DNeasy Blood & Tissue kit (DNeasy B & T), DNeasy UltraClean Microbial kit (DNeasy UltraClean), Easy-DNA gDNA Purification kit (Easy-DNA), GenElute Bacterial gDNA kit (GenElute), Genomic-tip 20/G kit (gTip 20), MasterPure Complete DNA Purification kit (MasterPure), NucliSENS miniMag (NucliSens), Wizard gDNA Purification kit (Wizard).
Figure 2
Figure 2
Overview of the virulence genotype obtained for all samples. Presence and absence of virulence genes are indicated in green and red, respectively, as determined using BLAST + and SRST2. *Virulence genes detected only with SRST2; —Missed virulence genes, referred to as false negatives (neither detected with SRST2 nor BLAST + while presence of the gene was expected, i.e. detected in the same isolate processed with a different kit, or detected in a sequencing run replicate of the isolate).
Figure 3
Figure 3
Average number of reads mapping uniquely to the Sakai E. coli pO157 plasmid reference normalized per one million trimmed input reads for the eight kits. Number of reads mapping uniquely against the Sakai E. coli pO157 plasmid reference per million input reads when mapping simultaneously against the Sakai E. coli pO157 plasmid (NC_002128.1) and Sakai E. coli O157:H7 genome (NC_002695.2) reference. Values are averaged over all E. coli O157:H7 samples (TIAC1151, TIAC1152, TIAC1153, TIAC1165, TIAC1169 and TIAC1638) that were generated with each kit, without inclusion of the sequencing run replicate results for TIAC1151 and TIAC1165. Bars represent the standard deviation across samples for each kit. Significant differences in average plasmid reads per million trimmed input reads were identified with the Kruskal–Wallis test (n: 48, α: 0.05, p-value: 2.80 × 10–7) followed by Dunn post-hoc analysis with Holm correction, as depicted in the accompanying table with significant values depicted in bold.
Figure 4
Figure 4
cgMLST-based tree of all samples. A minimum spanning tree was created with GrapeTree using the MSTreeV2 method on all outbreak and non-outbreak samples generated with the eight kits, excluding sequencing run replicates. All outbreak samples (TIAC1151, TIAC1152, TIAC1165 and TIAC1169) consistently cluster together, while non-outbreak samples TIAC1153, TIAC1638 and TIAC1660 are separated from the outbreak cluster and delineated per isolate. The scale bar represents the number of cgMLST allele differences between samples. One cgMLST allele difference with other outbreak samples was observed for only four samples (TIAC1152 generated with the Genomic-tip 20/G, TIAC1152 generated with the DNeasy UltraClean Microbial kit, TIAC1165 generated with the DNeasy UltraClean Microbial kit, and TIAC1153 generated with the Easy-DNA gDNA Purification kit), which is not visible in the figure, because of the large scale.
Figure 5
Figure 5
SNP-based tree of all O157:H7 samples. A maximum likelihood SNP tree was generated using the K2 nucleotide substitution model, containing all O157:H7 samples. Non-O157:H7 samples (TIAC1660) were excluded from SNP calling, due to high divergence from the Sakai E. coli O157:H7 reference genome. All outbreak samples (TIAC1151, TIAC1152, TIAC1165 and TIAC1169) consistently clustered together, irrespective of the employed kit. Within the outbreak clade, for all TIAC1165 samples, a limited number of discrepant SNPs with other outbreak samples existed, largely confined to a hypothetical transposase region (ydcC gene). The non-outbreak samples (TIAC1153 and TIAC1638) were separated from the outbreak clade, and clustered together per isolate. Notably, for TIAC1153 samples, a small number of SNPs different with the reference genome between the sample generated with the MasterPure Complete DNA Purification kit and all other TIAC1153 samples, was observed. This difference was solely due to masking of a low-quality region (see “Results”). The distance scale bar represents the average number of nucleotide substitutions per site.

Similar articles

Cited by

References

    1. García Fierro, R. et al. Outcome of EC/EFSA questionnaire (2016) on use of whole genome sequencing (WGS) for food- and waterborne pathogens isolated from animals, food, feed and related environmental samples in EU/EFTA countries. EFSA J.15, 2018. 10.2903/sp.efsa.2018.EN-1432 (2016).
    1. ECDC. Monitoring the Use of Whole-Genome Sequencing in Infectious Disease Surveillance in Europe. (2018). 10.2900/037665.
    1. Revez, J., Espinosa, L., Albiger, B., Leitmeyer, K. C. & Struelens, M. J. Survey on the use of whole-genome sequencing for infectious diseases surveillance: Rapid expansion of European National Capacities, 2015–2016. Front. Public Heal.5, 347, 10.3389/fpubh.2017.00347 (2017). - PMC - PubMed
    1. Nouws, S. et al. The benefits of whole genome sequencing for foodborne outbreak investigation from the perspective of a National Reference Laboratory in a smaller country. Foods9, 1030; 10.3390/foods9081030 (2020). - PMC - PubMed
    1. Allard MW, et al. Practical value of food pathogen traceability through building a whole-genome sequencing network and database. J. Clin. Microbiol. 2016;54:1975–1983. - PMC - PubMed

Publication types