

A realistic fish-habitat dataset to evaluate algorithms for underwater visual analysis
- PMID: 32887922
- PMCID: PMC7473859
- DOI: 10.1038/s41598-020-71639-x
A realistic fish-habitat dataset to evaluate algorithms for underwater visual analysis
Abstract
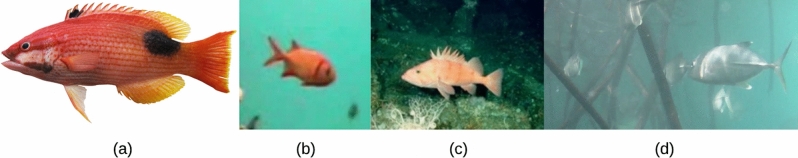
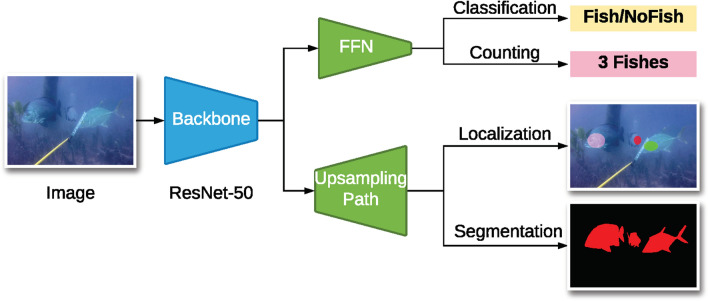
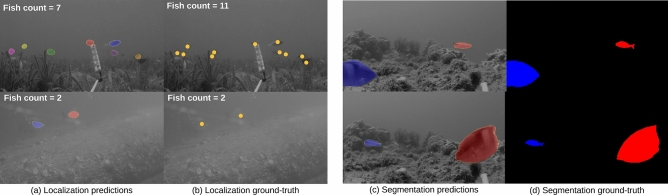
Visual analysis of complex fish habitats is an important step towards sustainable fisheries for human consumption and environmental protection. Deep Learning methods have shown great promise for scene analysis when trained on large-scale datasets. However, current datasets for fish analysis tend to focus on the classification task within constrained, plain environments which do not capture the complexity of underwater fish habitats. To address this limitation, we present DeepFish as a benchmark suite with a large-scale dataset to train and test methods for several computer vision tasks. The dataset consists of approximately 40 thousand images collected underwater from 20 habitats in the marine-environments of tropical Australia. The dataset originally contained only classification labels. Thus, we collected point-level and segmentation labels to have a more comprehensive fish analysis benchmark. These labels enable models to learn to automatically monitor fish count, identify their locations, and estimate their sizes. Our experiments provide an in-depth analysis of the dataset characteristics, and the performance evaluation of several state-of-the-art approaches based on our benchmark. Although models pre-trained on ImageNet have successfully performed on this benchmark, there is still room for improvement. Therefore, this benchmark serves as a testbed to motivate further development in this challenging domain of underwater computer vision.
Conflict of interest statement
The authors declare no competing interests.
Figures


References
-
- Anantharajah, K., Ge, Z., McCool, C., Denman, S. Fookes, C. Corke, P. I. Tjondronegoro, D. & Sridharan, S. Local inter-session variability modelling for object classification. In IEEE Winter Conference on Applications of Computer Vision, 309–316 (2014).
-
- Barnes LM, Bellwood DR, Sheaves M, Tanner JK. The use of clear-water non-estuarine mangroves by reef fishes on the great barrier reef. Mar. Biol. 2012;159:211–220. doi: 10.1007/s00227-011-1801-9. - DOI
-
- Boom B, He J, Palazzo S, Huang PX, Beyan C, Chou H-M, Lin F-P, Spampinato C, Fisher RB. A research tool for long-term and continuous analysis of fish assemblage in coral-reefs using underwater camera footage. Ecol. Inform. 2014;23:83–97. doi: 10.1016/j.ecoinf.2013.10.006. - DOI
-
- Bradley M, Baker RW, Nagelkerken I, Sheaves M. Context is more important than habitat type in determining use by juvenile fish. Landsc. Ecol. 2019;34:427–442. doi: 10.1007/s10980-019-00781-3. - DOI
-
- Cordts, M., Omran, M., Ramos, S., Rehfeld, T. Enzweiler, M. Benenson, R. Franke, U. Roth, S. & Schiele, B. The cityscapes dataset for semantic urban scene understanding. In Proceedings of the IEEE Conference on Computer Vision and Pattern Recognition, 3213–3223 (2016).
Publication types
MeSH terms
LinkOut - more resources
Full Text Sources
