. 2020 Sep 4;3(1):486.
doi: 10.1038/s42003-020-01212-9.

A normative modelling approach reveals age-atypical cortical thickness in a subgroup of males with autism spectrum disorder

Affiliations

A normative modelling approach reveals age-atypical cortical thickness in a subgroup of males with autism spectrum disorder

Richard A I Bethlehem et al. Commun Biol. .

Abstract

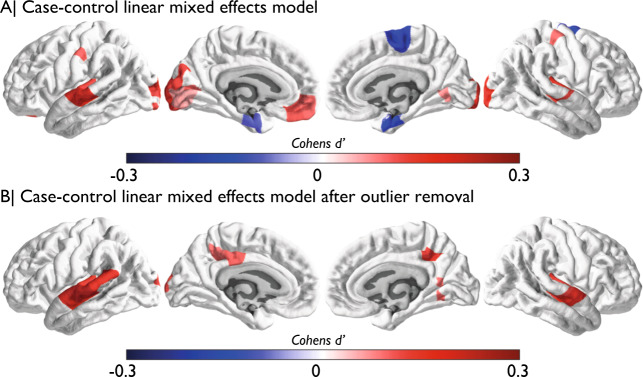
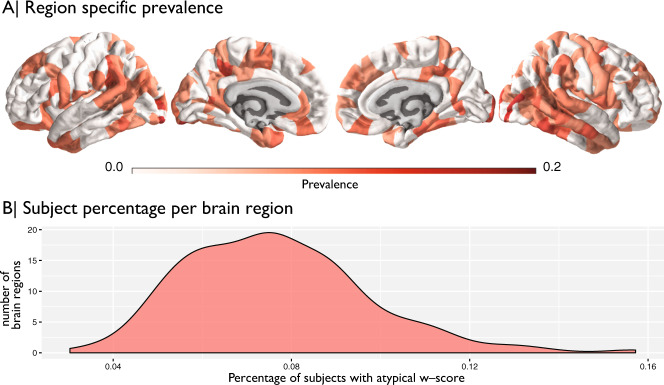
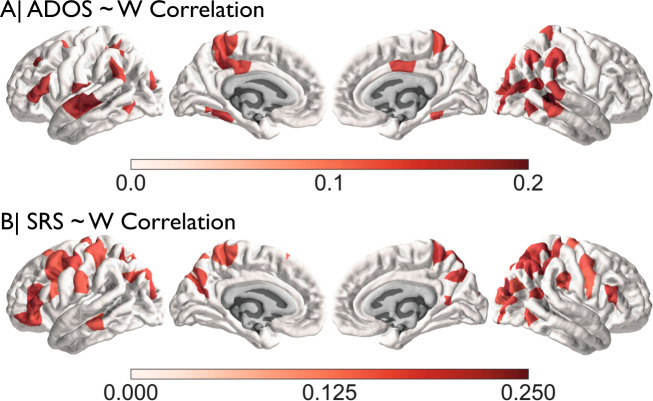
Understanding heterogeneity is an important goal on the path to precision medicine for autism spectrum disorders (ASD). We examined how cortical thickness (CT) in ASD can be parameterized as an individualized metric of atypicality relative to typically-developing (TD) age-related norms. Across a large sample (n = 870 per group) and wide age range (5-40 years), we applied normative modelling resulting in individualized whole-brain maps of age-related CT atypicality in ASD and isolating a small subgroup with highly age-atypical CT. Age-normed CT scores also highlights on-average differentiation, and associations with behavioural symptomatology that is separate from insights gleaned from traditional case-control approaches. This work showcases an individualized approach for understanding ASD heterogeneity that could potentially further prioritize work on a subset of individuals with cortical pathophysiology represented in age-related CT atypicality. Only a small subset of ASD individuals are actually highly atypical relative to age-norms. driving small on-average case-control differences.


Conflict of interest statement

The authors declare no competing interests.

Figures

Fig. 1
Fig. 1. Demographics and descriptive statistics.
a Histogram of age distribution per sex. Females were excluded from further analyses due to known sex differential effects in autism and the lack of available data to estimate population norms (see “Methods” section for details). b Schematic overview of normative modelling. In the first instance LOESS regression is used to estimate the developmental trajectory on CT for every individual brain region to obtain an age-specific mean and standard deviation. Then we computed median for each one-year age-bin for these mean and median neurotypical estimates to align them with the ASD group. Next, for each individual with autism and each brain region the normative mean and standard deviation are used to compute a w-score relative to their neurotypical age-bin. Contrary to conventional boxplots, the second panel shows mean, 1 sd and 2 sd for the neurotypical group (in yellow) and individuals with an autism diagnosis in purple.
Fig. 2
Fig. 2. Case control difference analysis with linear mixed effect model.
Panel a shows effect sizes for regions passing FDR correction for linear mixed effect modelling of conventional case control difference analysis. Cohen’s d values represent ASD−control, thus blue denotes ASD<control and red denotes ASD>control. Panel b shows effect sizes for regions passing FDR correction after outlier removal for the same linear mixed effect modelling of conventional case control difference analysis.
Fig. 3
Fig. 3. Region specific prevalence of atypical w-scores.
Panel a shows the by region prevalence of individuals with a w-score of greater than ±2SD. For visualization purposes these images are thresholded at the median prevalence of 0.076. Panel b shows the overall distribution of prevalence across all brain regions.
Fig. 4
Fig. 4. Phenotype–w-score correlations.
Spearman correlations between ADOS and w-score in the top panel. The lower panel shows the same for the SRS.
Fig. 5
Fig. 5. Explained variance in cortical thickness for each covariate.
Age age at the time of scanning, FIQ functional intelligent quotient, VIQ verbal intelligence quotient, SRS total score of the social responsive scale, Diagnosis diagnostic group, i.e. ASD or TD.

References

    1. Lai M-C, Lombardo MV, Baron-Cohen S. Autism. Lancet. 2014;383:896–910. - PubMed
    1. Lombardo, M. V., Lai, M. -C. & Baron-Cohen, S. Big data approaches to decomposing heterogeneity across the autism spectrum. Mol. Psychiatry10.1038/s41380-018-0321-0 (2019). - PMC - PubMed
    1. Ecker C. The neuroanatomy of autism spectrum disorder: an overview of structural neuroimaging findings and their translatability to the clinical setting. Autism. 2017;21:18–28. - PubMed
    1. Hong S-J, Bernhardt BC, Gill RS, Bernasconi N, Bernasconi A. The spectrum of structural and functional network alterations in malformations of cortical development. Brain. 2017;140:2133–2143. - PubMed
    1. Hong S-J, et al. Atypical functional connectome hierarchy in autism. Nat. Commun. 2019;10:1022. - PMC - PubMed

Publication types