. 2020 Sep 4;37(10):181.
doi: 10.1007/s11095-020-02914-9.

Application of Pharmacokinetic-Pharmacodynamic Modeling to Inform Translation of In Vitro NaV1.7 Inhibition to In Vivo Pharmacological Response in Non-human Primate

Affiliations

Application of Pharmacokinetic-Pharmacodynamic Modeling to Inform Translation of In Vitro NaV1.7 Inhibition to In Vivo Pharmacological Response in Non-human Primate

Jeanine E Ballard et al. Pharm Res. .

Abstract

Purpose: This work describes a staged approach to the application of pharmacokinetic-pharmacodynamic (PK-PD) modeling in the voltage-gated sodium ion channel (NaV1.7) inhibitor drug discovery effort to address strategic questions regarding in vitro to in vivo translation of target modulation.

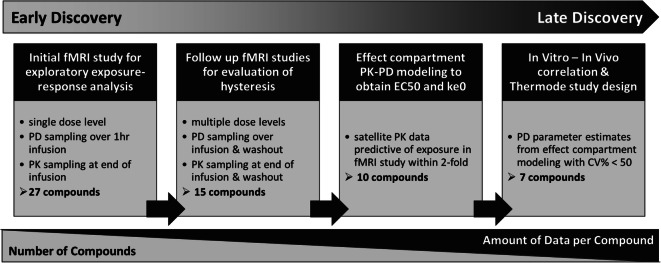
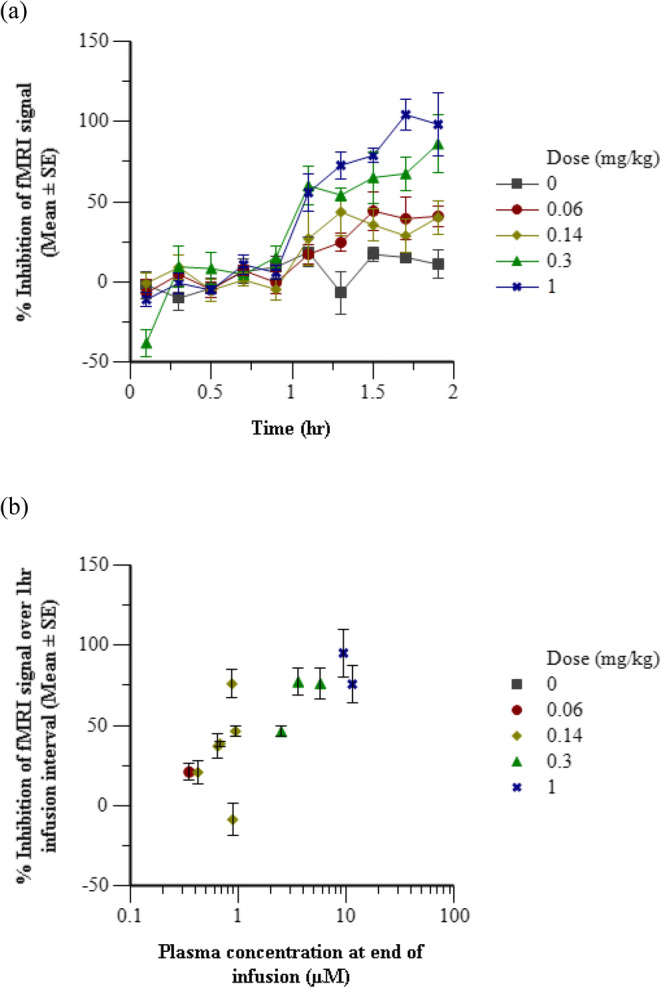
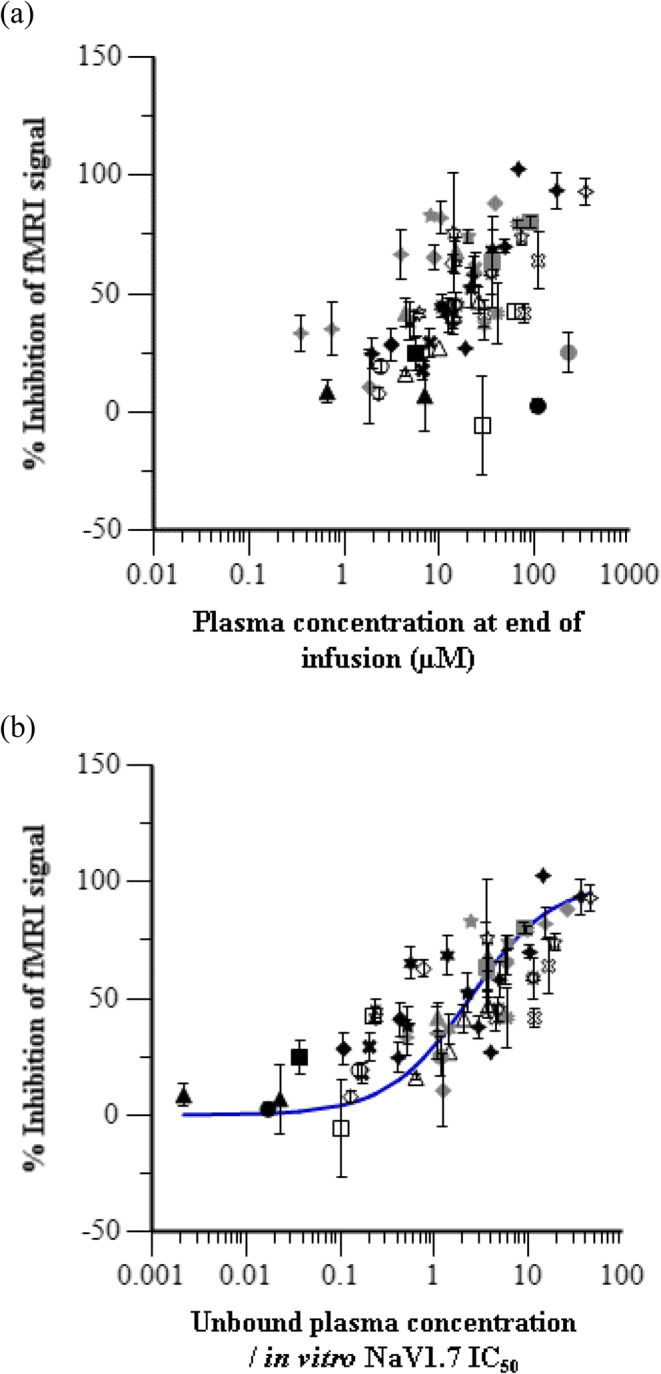
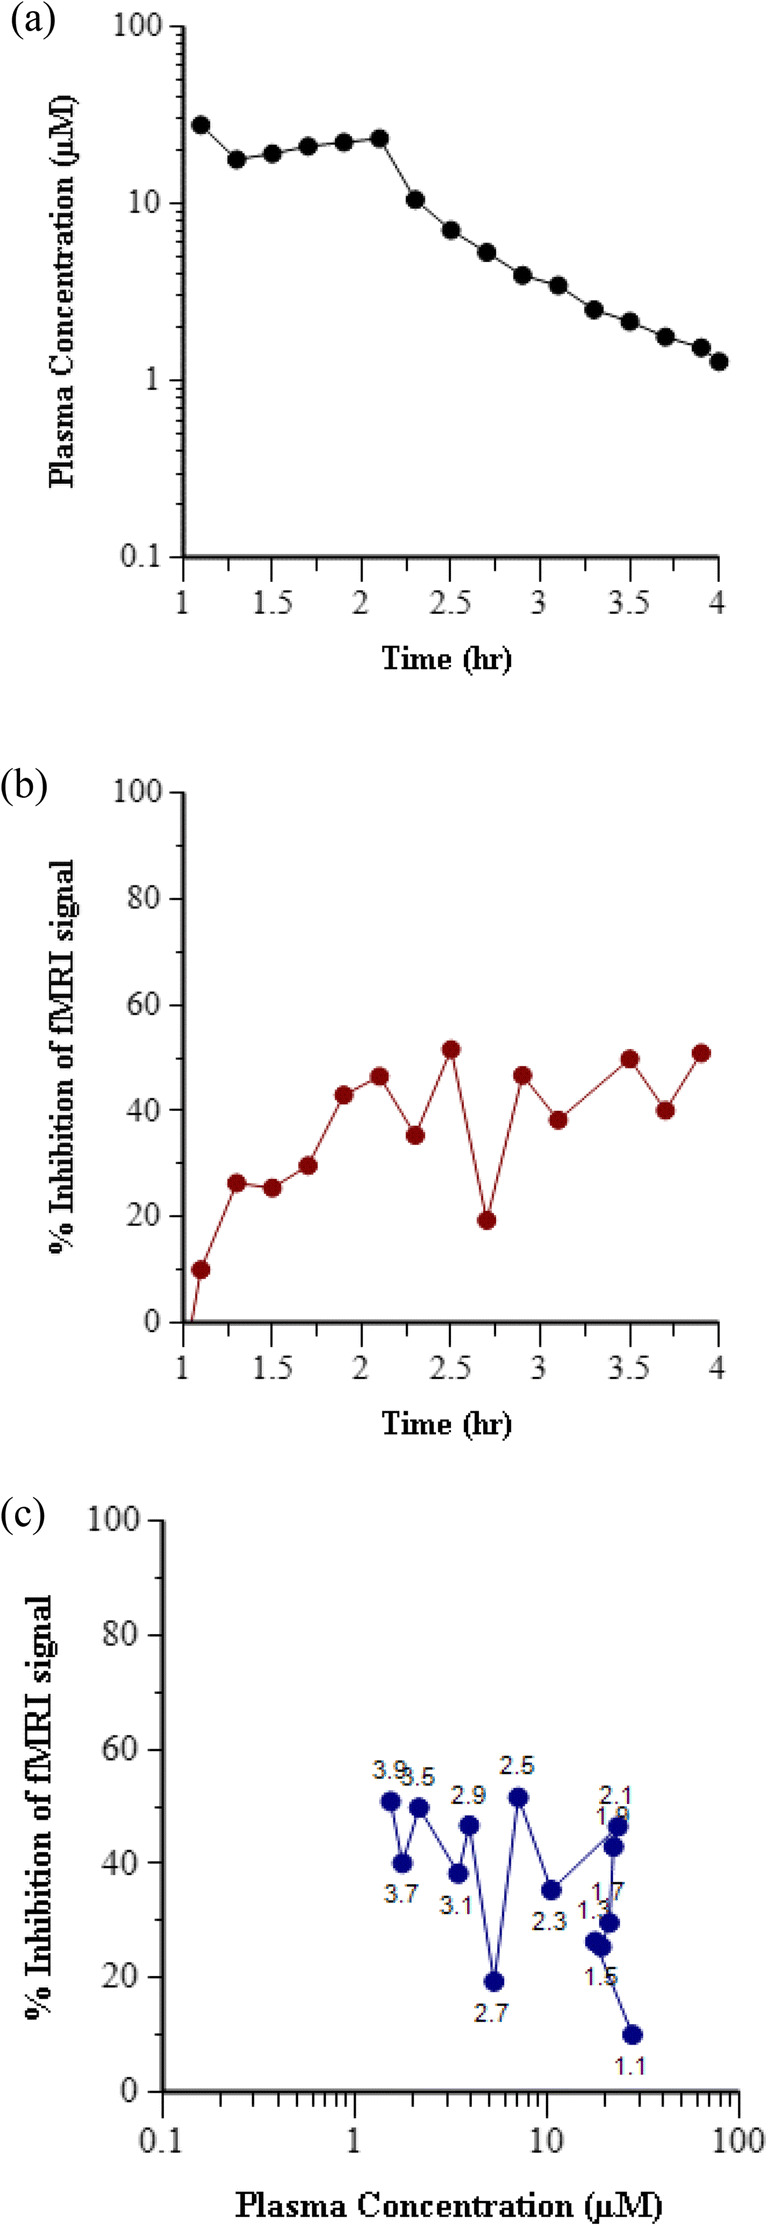
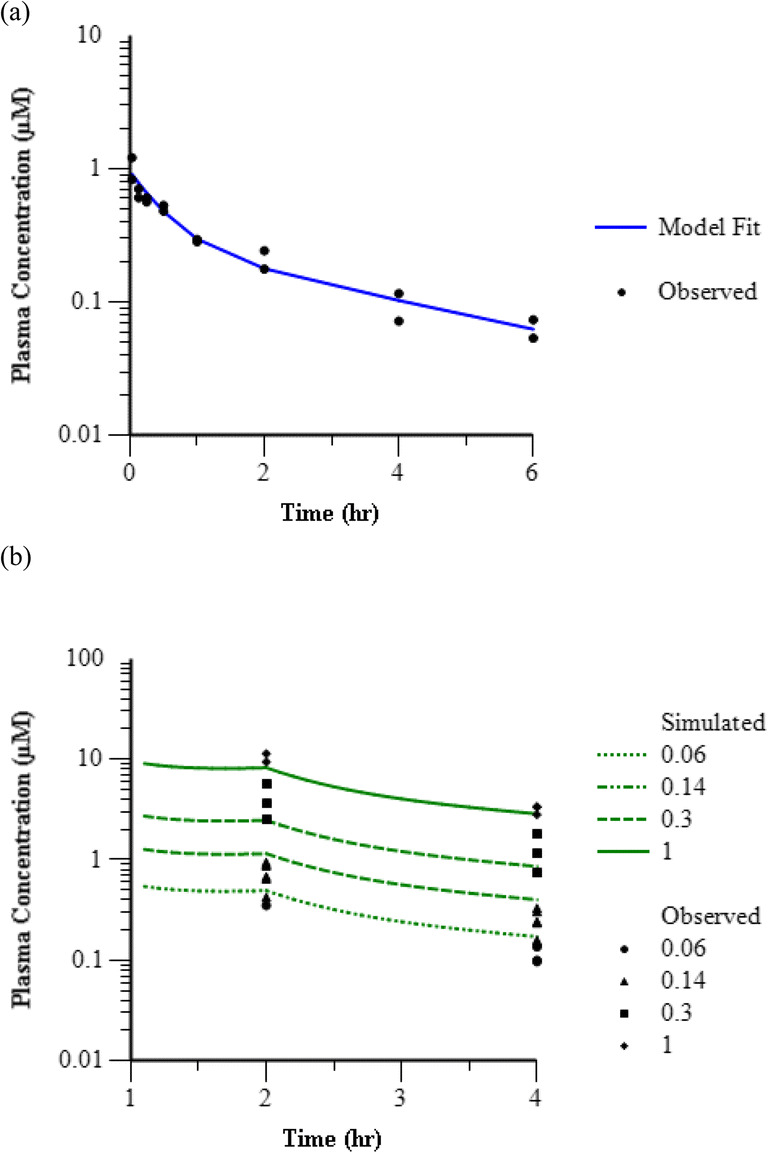
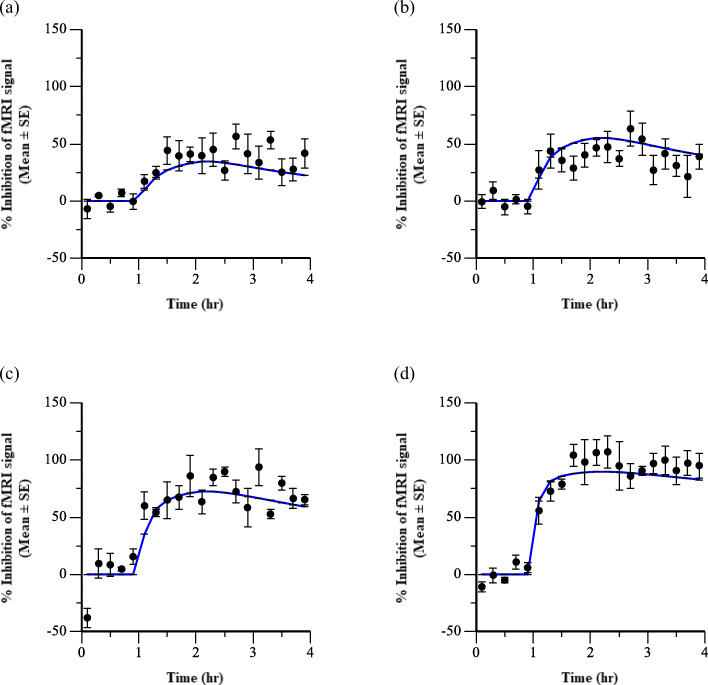
Methods: PK-PD analysis was applied to data from a functional magnetic resonance imaging (fMRI) technique to non-invasively measure treatment mediated inhibition of olfaction signaling in non-human primates (NHPs). Initial exposure-response was evaluated using single time point data pooled across 27 compounds to inform on in vitro to in vivo correlation (IVIVC). More robust effect compartment PK-PD modeling was conducted for a subset of 10 compounds with additional PD and PK data to characterize hysteresis.

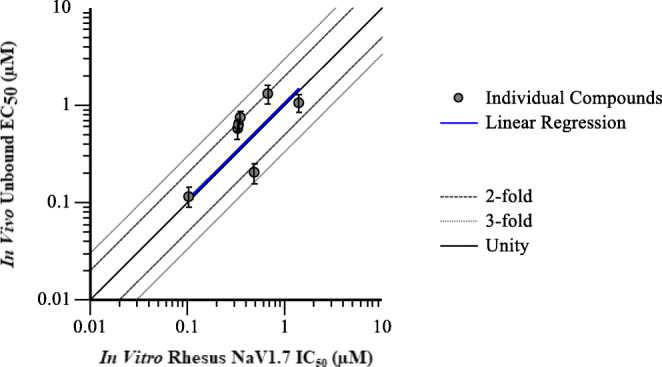
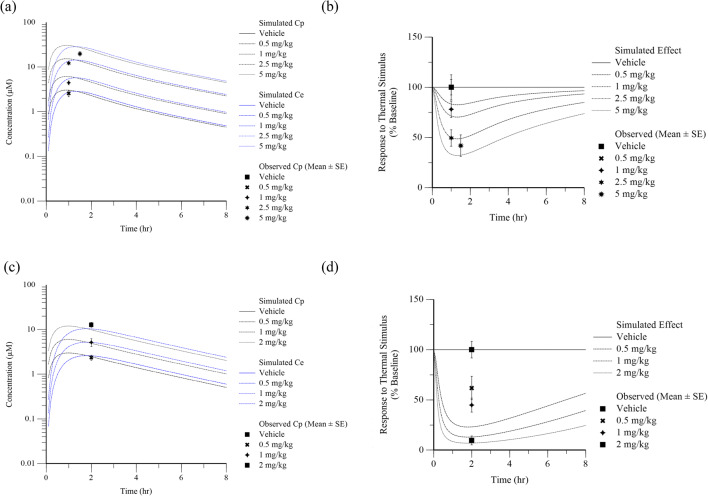
Results: The pooled compound exposure-response facilitated an early exploration of IVIVC with a limited dataset for each individual compound, and it suggested a 2.4-fold in vitro to in vivo scaling factor for the NaV1.7 target. Accounting for hysteresis with an effect compartment PK-PD model as compounds advanced towards preclinical development provided a more robust determination of in vivo potency values, which resulted in a statistically significant positive IVIVC with a slope of 1.057 ± 0.210, R-squared of 0.7831, and p value of 0.006. Subsequent simulations with the PK-PD model informed the design of anti-nociception efficacy studies in NHPs.

Conclusions: A staged approach to PK-PD modeling and simulation enabled integration of in vitro NaV1.7 potency, plasma protein binding, and pharmacokinetics to describe the exposure-response profile and inform future study design as the NaV1.7 inhibitor effort progressed through drug discovery.

Keywords: NaV1.7; PK-PD; fMRI; nociception; olfaction.


Figures

Fig. 1
Fig. 1
Schematic representation of the staged approach to exposure-response analysis in drug discovery. The Early Discovery phase primarily consists of many compounds with limited data available for each compound. Substantially fewer compounds progress into Late Discovery, accompanied by an increase in the amount of data available for each compound to evaluate the impact of dose and time dependency in PK-PD analysis.
Fig. 2
Fig. 2
Inhibitory effects of representative Compound 24 on odor-induced olfaction in NHP. (a) Time course of average inhibition of fMRI signal for each dose group. Baseline was established for 1 h followed by a constant infusion for 1 h with Compound 24. (b) Average inhibition of fMRI signal over the 1 h infusion interval versus the plasma concentration at the end of the infusion in each animal. Error bars represent the standard error of the mean.
Fig. 3
Fig. 3
Pooled compound exposure-response in rhesus olfaction assay. Average inhibition of fMRI signal during the infusion interval at each dose level versus (a) the average total plasma concentration and (b) the average unbound plasma concentration normalized by in vitro IC50 for each test compound. Symbols represent observed data and error bars indicate standard error of the mean. The line is an overlay of the fitted model prediction.
Fig. 4
Fig. 4
Temporal delay in effect relative to exposure in rhesus olfaction assay for representative Compound 6. (a) Time course of Compound 6 concentration in plasma following IV bolus plus 1 h infusion at a dose of 5 mg/kg in rhesus. (b) Time course of inhibition of fMRI signal following IV bolus plus 1 h infusion of 5 mg/kg Compound 6. (c) Hysteresis loop in the plot of inhibition of fMRI signal versus Compound 6 concentration in plasma at each time point. Data labels indicate the time in hours after start of fMRI data acquisition.
Fig. 5
Fig. 5
Modeling and simulation of plasma concentration over time for representative Compound 24. (a) Overlay of fitted model prediction (line) and observed (symbols) plasma concentration following IV bolus administration in rhesus satellite PK study at 0.05 mg/kg. (b) Overlay of model simulation (lines) and observed (symbols) plasma concentration following IV bolus plus 1 h infusion in rhesus olfaction assay at 0.06, 0.14, 0.3, and 1 mg/kg.
Fig. 6
Fig. 6
Time course of treatment mediated inhibition of fMRI signal with representative Compound 24. Symbols represent observed data (Mean ± SE) and lines are fitted effect compartment model predictions. Each panel displays a different dose of Compound 24 (a) 0.06 mg/kg (N = 3), (b) 0.14 mg/kg (N = 6), (c) 0.3 mg/kg (N = 3), and (d) 1 mg/kg (N = 3).
Fig. 7
Fig. 7
Correlation of in vivo unbound EC50 from effect compartment model of inhibition of olfaction with in vitro intrinsic NaV1.7 IC50. Symbols represent individual compound results, and the dashed line indicates unity. The solid line is a linear regression of the data points with an R-squared of 0.7831 and a slope of 1.057.
Fig. 8
Fig. 8
Time course of simulated (lines) and observed (symbols) concentration and nociceptive response for representative Compounds 13 and 24 following subcutaneous administration in the rhesus thermode assay. Top panel is Compound 13 data and bottom panel is Compound 24 data. Plots on the left (a, c) display concentration over time in plasma (black) and effect compartment (blue) and plots on the right (b, d) display effect over time in the rhesus thermode assay. Different shapes and line patterns indicate different doses as indicated in the figure legend.

Similar articles

Cited by

References

    1. Wong H, Bohnert T, Damian-Lordache V, Gibson C, Hsu C-P, Krishnatry AS, et al. Translational pharmacokinetic-pharmacodynamic analysis in the pharmaceutical industry: an IQ consortium PK-PD discussion group perspective. Drug Discov Today. 2017;22:1447–1459. doi: 10.1016/j.drudis.2017.04.015. - DOI - PubMed
    1. Bueters T, Gibson C, Visser SA. Optimization of human dose prediction by using quantitative and translational pharmacology in drug discovery. Future Med Chem. 2015;7:2351–2369. doi: 10.4155/fmc.15.143. - DOI - PubMed
    1. Morgan P, Van Der Graaf PH, Arrowsmith J, Feltner DE, Drummond KS, Wegner CD, Street SD. Can the flow of medicines be improved? Fundamental pharmacokinetic and pharmacological principles toward improving phase II survival. Drug Discov Today. 2012;17:419–424. doi: 10.1016/j.drudis.2011.12.020. - DOI - PubMed
    1. Gabrielsson J, Green AR, Van der Graaf PH. Optimising in vivo pharmacology studies—practical PKPD considerations. J Pharmacol Toxicol Methods. 2010;61:146–156. doi: 10.1016/j.vascn.2010.02.002. - DOI - PubMed
    1. Dib-Hajj SD, Cummins TR, Black JA, Waxman SG. From genes to pain: Na(v)1.7 and human pain disorders. Trends Neurosci. 2007;30:555–563. doi: 10.1016/j.tins.2007.08.004. - DOI - PubMed

MeSH terms

Substances

LinkOut - more resources