. 2020 Sep 4;82(9):118.
doi: 10.1007/s11538-020-00795-y.

Optimal Control of the COVID-19 Pandemic with Non-pharmaceutical Interventions

Affiliations

Optimal Control of the COVID-19 Pandemic with Non-pharmaceutical Interventions

T Alex Perkins et al. Bull Math Biol. .

Abstract

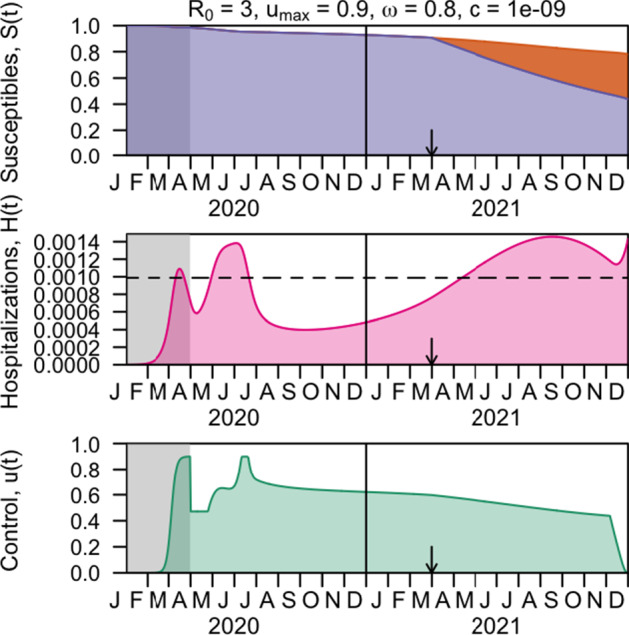
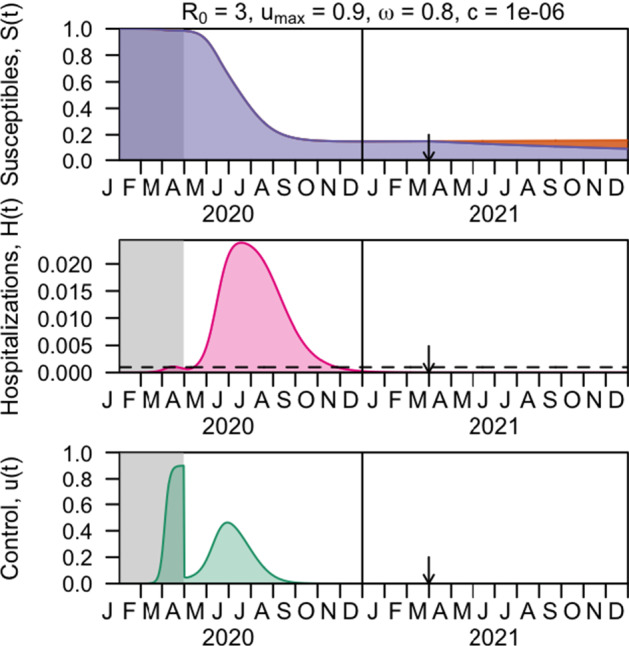
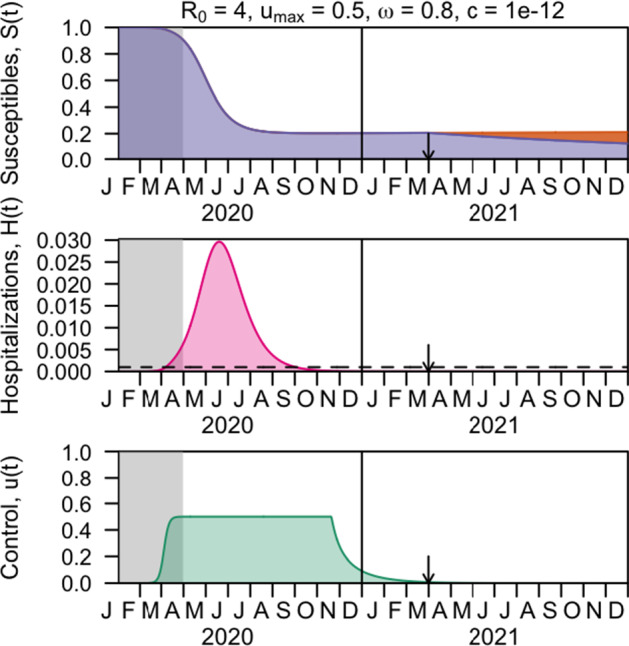
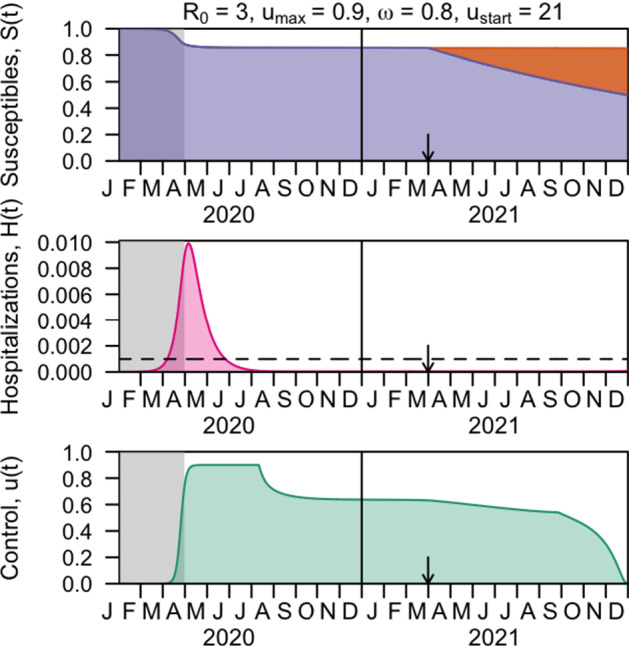
The COVID-19 pandemic has forced societies across the world to resort to social distancing to slow the spread of the SARS-CoV-2 virus. Due to the economic impacts of social distancing, there is growing desire to relax these measures. To characterize a range of possible strategies for control and to understand their consequences, we performed an optimal control analysis of a mathematical model of SARS-CoV-2 transmission. Given that the pandemic is already underway and controls have already been initiated, we calibrated our model to data from the USA and focused our analysis on optimal controls from May 2020 through December 2021. We found that a major factor that differentiates strategies that prioritize lives saved versus reduced time under control is how quickly control is relaxed once social distancing restrictions expire in May 2020. Strategies that maintain control at a high level until at least summer 2020 allow for tapering of control thereafter and minimal deaths, whereas strategies that relax control in the short term lead to fewer options for control later and a higher likelihood of exceeding hospital capacity. Our results also highlight that the potential scope for controlling COVID-19 until a vaccine is available depends on epidemiological parameters about which there is still considerable uncertainty, including the basic reproduction number and the effectiveness of social distancing. In light of those uncertainties, our results do not constitute a quantitative forecast and instead provide a qualitative portrayal of possible outcomes from alternative approaches to control.

Keywords: Coronavirus; Epidemic; Infectious disease dynamics; Ordinary differential equations; Pontryagin’s Maximum Principle.


Figures

Fig. 1
Fig. 1
Relationship between the number of hospitalizations and the probability of death from COVID-19 among hospitalized patients. The parameters Δ- and Δ+ represent lower and upper bounds on the probability of death, and Hmax represents the hospital capacity above which the probability of death exceeds Δ-. Hospitalizations are quantified as a proportion of the overall population
Fig. 2
Fig. 2
Reported (red) and simulated (black) numbers of daily deaths in the USA resulting from model calibration under 18 different parameter scenarios (black lines) (Color Figure Online)
Fig. 3
Fig. 3
Convergence of solutions of u(t) under parameters R0=3, umax=0.9, ω=0.8, and c=10-12. Left: Colors indicate values of u(t) for each day in 2020 and 2021 across 2,000 iterations of the forward–backward sweep algorithm. Right: Across iterations, the value of the objective functional, J(u), decreased steadily until cycling for the remaining iterations (Color Figure Online)
Fig. 4
Fig. 4
Dependence of time under control (blue) and cumulative deaths (red) on c (x-axis), R0 (columns), umax (rows), and ω (markers). Deaths are quantified as a proportion of the overall population (Color Figure Online)
Fig. 5
Fig. 5
Optimal control under parameters with maximal ability to control the pandemic, with maximal weighting on minimization of deaths. Panels show the optimal control (bottom) and its impacts on the dynamics of hospitalized (middle) and susceptible (top) compartments with R0=3, umax=0.9, ω=0.8, and c=10-12. Vaccination is introduced at the time indicated by the arrow, with the vaccinated population (orange) reducing the susceptible population. Through April 2020 (gray shading), the value of the control is fixed according to its calibrated trajectory. The dashed horizontal line indicates hospital capacity (Color Figure Online)
Fig. 6
Fig. 6
Optimal control under parameters with maximal ability to control the pandemic, with intermediate weighting on minimization of deaths. Panels show the optimal control (bottom) and its impacts on the dynamics of hospitalized (middle) and susceptible (top) compartments with R0=3, umax=0.9, ω=0.8, and c=10-9. Vaccination is introduced at the time indicated by the arrow, with the vaccinated population (orange) reducing the susceptible population. Through April 2020 (gray shading), the value of the control is fixed according to its calibrated trajectory. The dashed horizontal line indicates hospital capacity (Color Figure Online)
Fig. 7
Fig. 7
Optimal control under parameters with maximal ability to control the pandemic, with minimal weighting on minimization of deaths. Panels show the optimal control (bottom) and its impacts on the dynamics of hospitalized (middle) and susceptible (top) compartments with R0=3, umax=0.9, ω=0.8, and c=10-9. Vaccination is introduced at the time indicated by the arrow, with the vaccinated population (orange) reducing the susceptible population. Through April 2020 (gray shading), the value of the control is fixed according to its calibrated trajectory. The dashed horizontal line indicates hospital capacity (Color Figure Online)
Fig. 8
Fig. 8
Optimal control under parameters with maximal ability to control the pandemic, with maximal weighting on minimization of deaths. Panels show the optimal control (bottom) and its impacts on the dynamics of hospitalized (middle) and susceptible (top) compartments with R0=3.5, umax=0.7, ω=0.8, and c=10-12. Vaccination is introduced at the time indicated by the arrow, with the vaccinated population (orange) reducing the susceptible population. Through April 2020 (gray shading), the value of the control is fixed according to its calibrated trajectory. The dashed horizontal line indicates hospital capacity (Color Figure Online)
Fig. 9
Fig. 9
Optimal control under parameters with maximal ability to control the pandemic, with maximal weighting on minimization of deaths. Panels show the optimal control (bottom) and its impacts on the dynamics of hospitalized (middle) and susceptible (top) compartments with R0=4, umax=0.5, ω=0.8, and c=10-12. Vaccination is introduced at the time indicated by the arrow, with the vaccinated population (orange) reducing the susceptible population. Through April 2020 (gray shading), the value of the control is fixed according to its calibrated trajectory. The dashed horizontal line indicates hospital capacity (Color Figure Online)
Fig. 10
Fig. 10
Dependence of time under control (blue) and cumulative deaths (red) on a shift in the timing of u(t) before April 30, 2020 (x-axis), R0 (columns), umax (rows), and ω (markers). Deaths are quantified as a proportion of the overall population (Color Figure Online)
Fig. 11
Fig. 11
Optimal control (bottom) and its impacts on the dynamics of hospitalized (middle) and susceptible (top) compartments with R0=3, umax=0.9, ω=0.8, c=10-12, and the initiation of control delayed by 21 days. Vaccination is introduced at the time indicated by the arrow, with the vaccinated population (orange) reducing the susceptible population. Through April 2020 (gray shading), the value of the control is fixed according to its calibrated trajectory. The dashed horizontal line indicates hospital capacity (Color Figure Online)

References

    1. Agusto F, Khan M (2018) Optimal control strategies for dengue transmission in pakistan. Math Biosci 305:102–121. 10.1016/j.mbs.2018.09.007. http://www.sciencedirect.com/science/article/pii/S002555641830453X - PubMed
    1. Aledort J, Lurie N, Wasserman J, Bozzette S. Non-pharmaceutical public health interventions for pandemic influenza: an evaluation of the evidence base. BMC Public Health. 2007;7:208. doi: 10.1186/1471-2458-7-208. - DOI - PMC - PubMed
    1. Amanat F, Krammer F. Sars-cov-2 vaccines: status report. Immunity. 2020;52:583–589. doi: 10.1016/j.immuni.2020.03.007. - DOI - PMC - PubMed
    1. Bedford J, Enria D, Giesecke J, Heymann D, Ihekweazu C, Kobinger G, Lane H, Memish Z, Oh M, Sall A, Schuchat A, Ungchusak K, Wieler L (2020) Covid-19: towards controlling of a pandemic. Lancet. 10.1016/S0140-6736(20)30673-5 - PMC - PubMed
    1. Blayneh K, Gumel A, Lenhart S, Clayton T. Backward bifurcation and optimal control in transmission dynamics of west nile virus. Bull Math Biol. 2010;72:1006–1028. doi: 10.1007/s11538-009-9480-0. - DOI - PubMed

MeSH terms

LinkOut - more resources