. 2020 Nov 3;32(5):844-859.e5.
doi: 10.1016/j.cmet.2020.08.007. Epub 2020 Sep 3.

A Cell-Autonomous Signature of Dysregulated Protein Phosphorylation Underlies Muscle Insulin Resistance in Type 2 Diabetes

Affiliations

A Cell-Autonomous Signature of Dysregulated Protein Phosphorylation Underlies Muscle Insulin Resistance in Type 2 Diabetes

Thiago M Batista et al. Cell Metab. .

Abstract

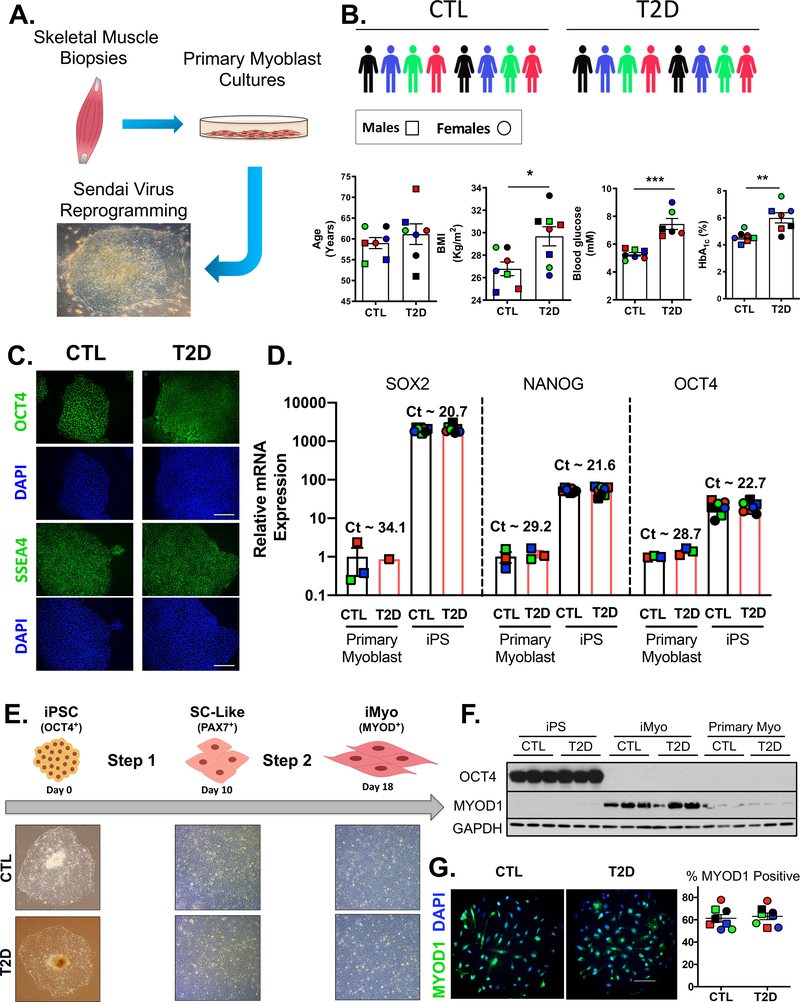
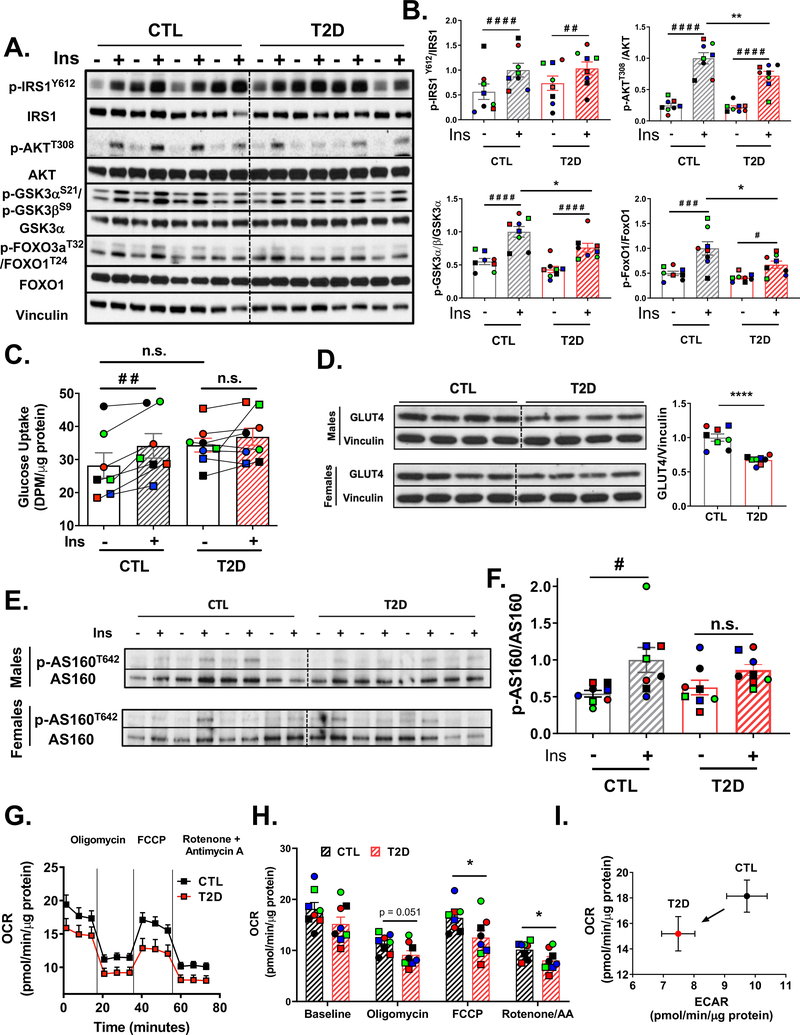
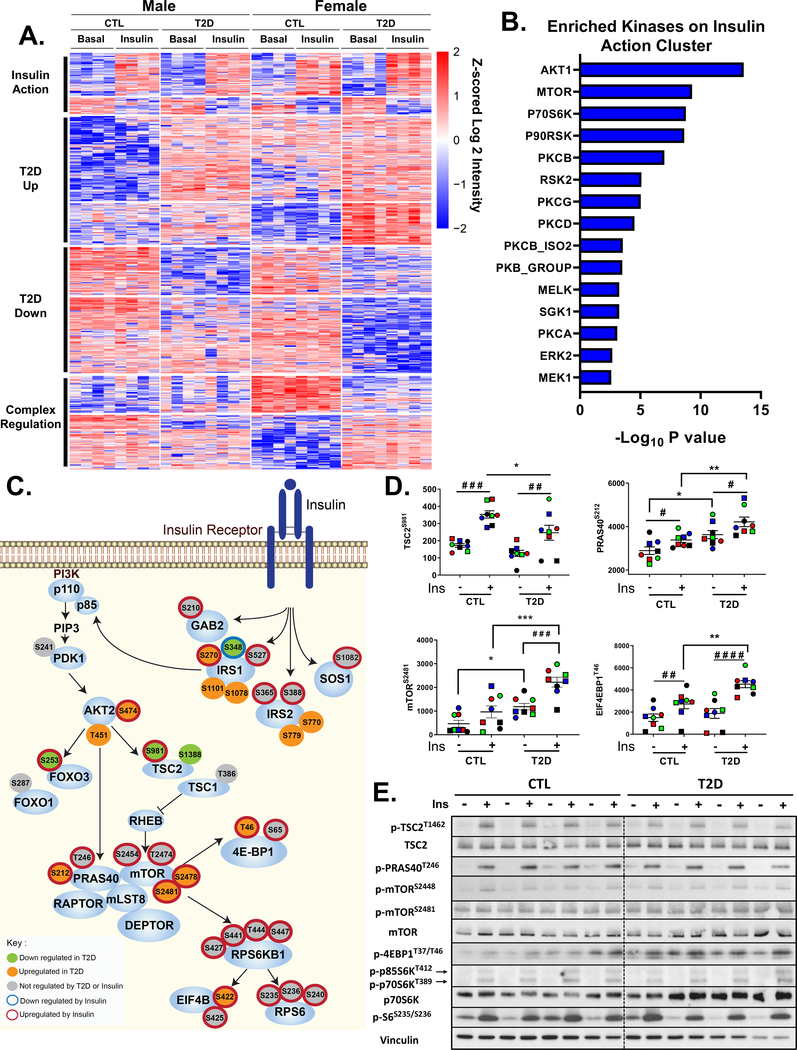
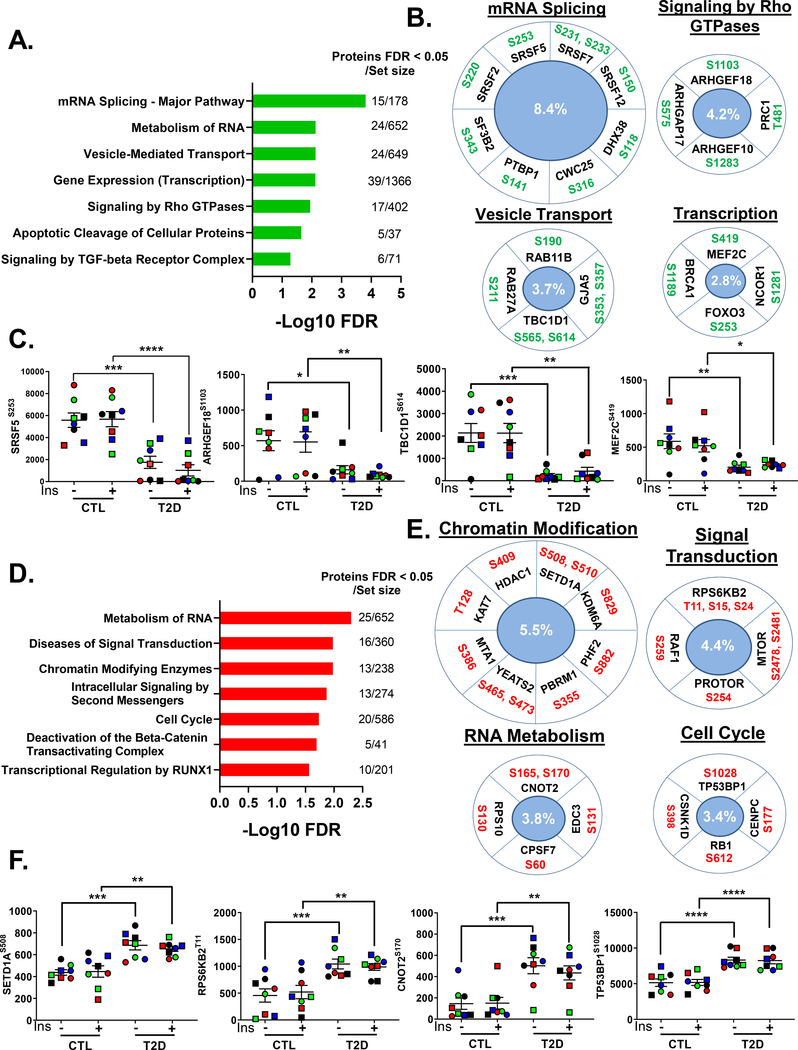
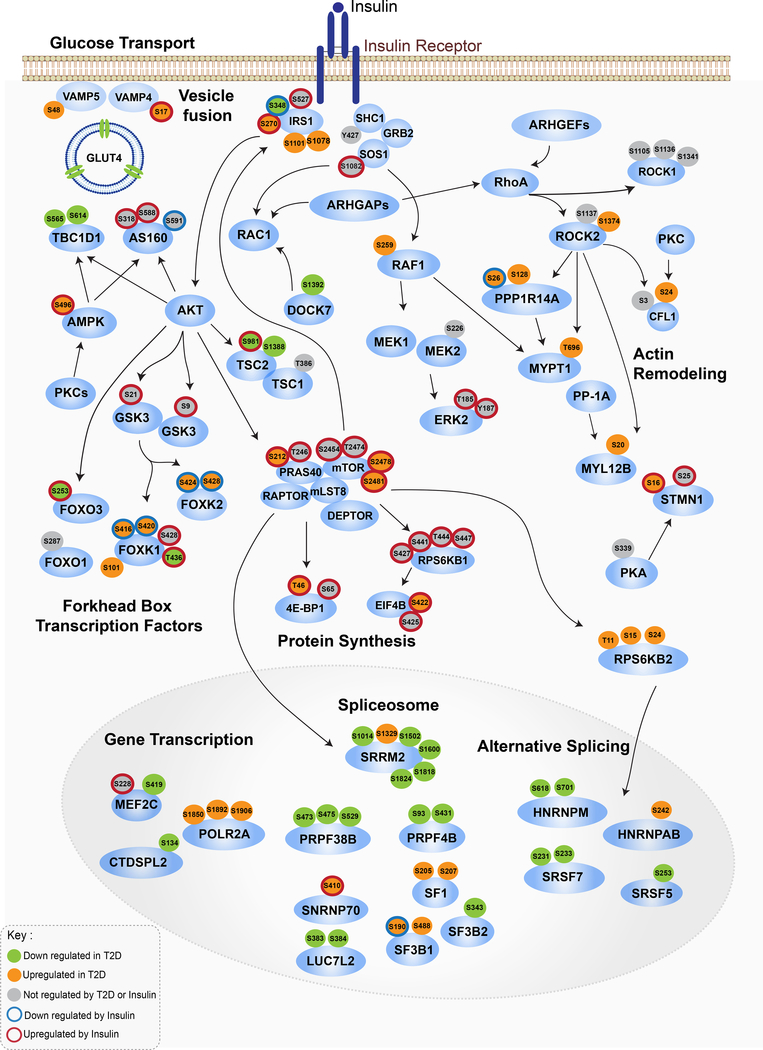
Skeletal muscle insulin resistance is the earliest defect in type 2 diabetes (T2D), preceding and predicting disease development. To what extent this reflects a primary defect or is secondary to tissue cross talk due to changes in hormones or circulating metabolites is unknown. To address this question, we have developed an in vitro disease-in-a-dish model using iPS cells from T2D patients differentiated into myoblasts (iMyos). We find that T2D iMyos in culture exhibit multiple defects mirroring human disease, including an altered insulin signaling, decreased insulin-stimulated glucose uptake, and reduced mitochondrial oxidation. More strikingly, global phosphoproteomic analysis reveals a multidimensional network of signaling defects in T2D iMyos going beyond the canonical insulin-signaling cascade, including proteins involved in regulation of Rho GTPases, mRNA splicing and/or processing, vesicular trafficking, gene transcription, and chromatin remodeling. These cell-autonomous defects and the dysregulated network of protein phosphorylation reveal a new dimension in the cellular mechanisms underlying the fundamental defects in T2D.

Keywords: chromatin remodeling; glucose transport; iPSC; insulin resistance; mRNA splicing; mitochondrial oxidation; phosphoproteomics; skeletal muscle; type 2 diabetes; vesicle trafficking.


Conflict of interest statement

Declaration of Interests The authors declare no competing interests.

Figures

Figure 1.
Figure 1.. Generation of Patient-Specific iPSCs and Differentiation into iMyos
(A) Reprogramming strategy. (B) Cohort was composed of 8 non-diabetics (CTL) and 8 type 2 diabetic (T2D) subjects. Males are represented by □ symbols and females by ○ symbols. Biometric and biochemical features are shown. Data are means ± SEM, n = 6–8. * P < 0.05, ** P < 0.01, *** P < 0.001, Student’s t test. (C) Representative immunostaining of OCT4 and SSEA4, and DAPI in iPSCs (n = 3). Scale bar, 50 μm (D) Gene expression normalized to TBP of pluripotency markers in iPSCs (n = 8) and primary myoblasts (n = 3) expressed as fold-change over myoblast. Data are means ± SEM. (E) Two-step generation of iMyos in 18 days with chemically defined media. (F) OCT4, and MYOD1 western blot in donor-matched iPSCs, iMyos and primary myoblasts. GAPDH is used as loading control. (G) Representative MYOD1 immunostaining in iMyos and percentage of positive cells relative to DAPI (n = 8). Scale bar, 25 μm. See also Figure S1.
Figure 2.
Figure 2.. iMyos from T2D subjects Mirror Insulin Resistance
(A) Insulin signaling in iMyos from male donors. (B) Quantification of insulin signaling experiments normalized by total protein. Data are means ± SEM, n = 8. # P < 0.05, ## P < 0.01, ### P < 0.001, #### P < 0.0001 basal vs insulin, * P <0.05, ** P <0.01 CTL vs T2D, n.s. = not significant, Two-way ANOVA. See also Figure S2. (C) 2-DOG uptake assay in iMyos. Data are means ± SEM, n = 7–8. ## P < 0.01 basal vs insulin, Two-Way ANOVA. (D) Total GLUT4 protein expression normalized to vinculin. Data are means ± SEM, n = 8. **** P < 0.0001, Student’s t test. (E-F) Immunoblot of AS160T642 normalized to total AS160. Data are means ± SEM, n = 8. # P < 0.05 basal vs insulin, Two Way ANOVA. (G-I) Seahorse Flux analysis showing (G) basal OCR profile or in response to oligomycin, FCCP or rotenone + antimycin A. (H) Average OCR at each condition during the assay. Data are means ± SEM, n = 8. * P < 0.05, Student’s t test. (I) Metabolic phenotyping plot of OCR vs ECAR.
Figure 3.
Figure 3.. Phosphoproteomics Reveals Dysregulation of IRS/AKT/mTOR Signaling Nodes in T2D iMyos
(A) Hierarchical clustering of the phosphopeptides showing the effects of insulin and T2D on the phosphoproteome. Rows are Z-scores of log2 transformed intensity of phosphosites for each sample (columns). See also Figure S3 and Table S1. (B) Overrepresented protein kinases within insulin action cluster (P < 0.01). (C) Representation of IR signaling pathway showing proximal and downstream phosphorylation events. Each of the phosphosites were color coded based on the effects of insulin or T2D on phosphorylation, Two-way ANOVA (P < 0.05). (D) Phosphosite quantification of mTORC1 signaling components. Data are means ± SEM of phosphosites intensity values (x105). # P < 0.05, ### P < 0.001, #### P < 0.0001 basal vs insulin, * P <0.05, ** P <0.01, *** P < 0.001 CTL vs T2D, Two-way ANOVA. (E) Validation of phosphoproteomics by immunoblot in iMyos from male subjects. See also Figure S4
Figure 4.
Figure 4.. Extensive Disruption of Basal Phosphorylation of Proteins Controlling Critical Cellular Functions in T2D
(A and D) Enrichment analysis of overrepresented REACTOME pathways within (A) down-regulated or (D) up-regulated phosphosites in T2D iMyos (FDR < 0.05) (B and E) Selected phosphosites on significantly enriched pathways and (C and F) quantification of exemplary phosphosites that were (B and C) down-regulated or (E and F) up-regulated in T2D iMyos. Labels in the center indicate percentage of proteins regulated within each pathway. Data are means ± SEM of phosphosites intensity values (x105). * P <0.05, ** P <0.01, *** P < 0.001, **** P < 0.0001 CTL vs T2D, Two-way ANOVA. See also Figure S5 and Table S1.
Figure 5.
Figure 5.. Integrated Map of Signaling Networks Dysregulated in T2D
Signaling cascade map showing integration between major IR signaling nodes and main pathways dysregulated in T2D identified by phosphoproteomics. Each of the phosphosites were color coded based on the effects of insulin or T2D on phosphorylation, Two-way ANOVA (P < 0.05). Arrows indicate protein-protein interactions and phosphorylation/dephosphorylation events curated from databases of experimentally defined kinase-substrate relationships (PhosphositePlus and RegPhos) and literature. See also Figure S5.

References

    1. Al-Khalili L, Bouzakri K, Glund S, Lonnqvist F, Koistinen HA, and Krook A (2006). Signaling specificity of interleukin-6 action on glucose and lipid metabolism in skeletal muscle. Mol Endocrinol 20, 3364–3375. - PubMed
    1. Batista TM, Garcia-Martin R, Cai W, Konishi M, O’Neill BT, Sakaguchi M, Kim JH, Jung DY, Kim JK, and Kahn CR (2019). Multi-dimensional Transcriptional Remodeling by Physiological Insulin In Vivo. Cell Rep 26, 3429–3443 e3423. - PMC - PubMed
    1. Bentzinger CF, Wang YX, and Rudnicki MA (2012). Building muscle: molecular regulation of myogenesis. Cold Spring Harb Perspect Biol 4. - PMC - PubMed
    1. Bezy O, Tran TT, Pihlajamaki J, Suzuki R, Emanuelli B, Winnay J, Mori MA, Haas J, Biddinger SB, Leitges M, et al. (2011). PKCdelta regulates hepatic insulin sensitivity and hepatosteatosis in mice and humans. J Clin Invest 121, 2504–2517. - PMC - PubMed
    1. Bhatt S, Gupta MK, Khamaisi M, Martinez R, Gritsenko MA, Wagner BK, Guye P, Busskamp V, Shirakawa J, Wu G, et al. (2015). Preserved DNA Damage Checkpoint Pathway Protects against Complications in Long-Standing Type 1 Diabetes. Cell metabolism 22, 239–252. - PMC - PubMed

Publication types

MeSH terms

Substances