. 2020 Sep 15;53(3):641-657.e14.
doi: 10.1016/j.immuni.2020.08.004. Epub 2020 Sep 3.

Osteopontin Expression Identifies a Subset of Recruited Macrophages Distinct from Kupffer Cells in the Fatty Liver

Affiliations

Osteopontin Expression Identifies a Subset of Recruited Macrophages Distinct from Kupffer Cells in the Fatty Liver

Anneleen Remmerie et al. Immunity. .

Abstract

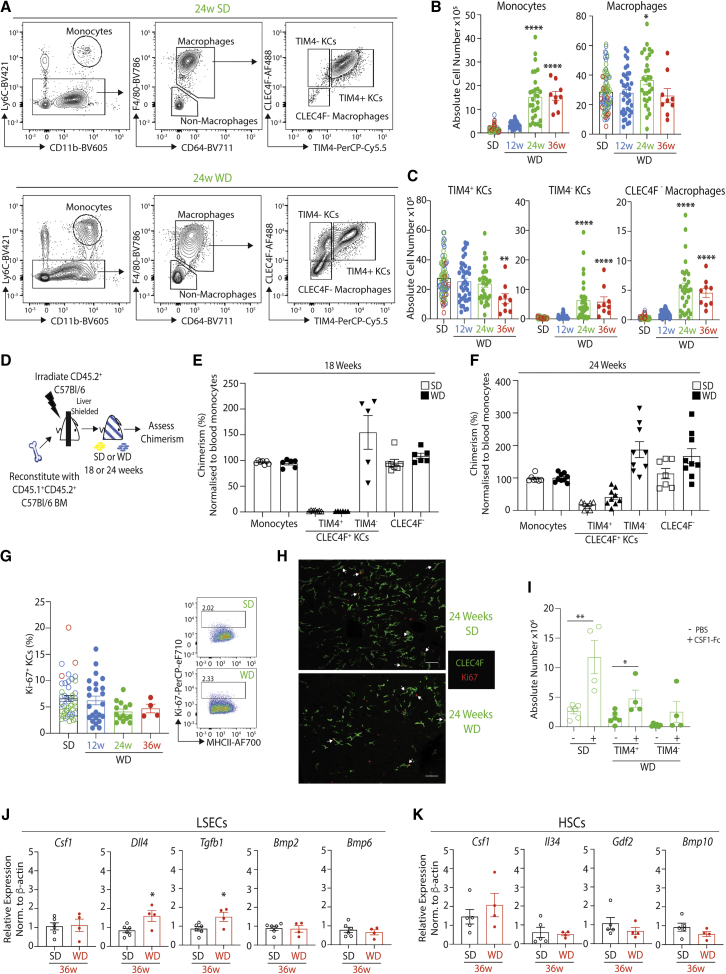
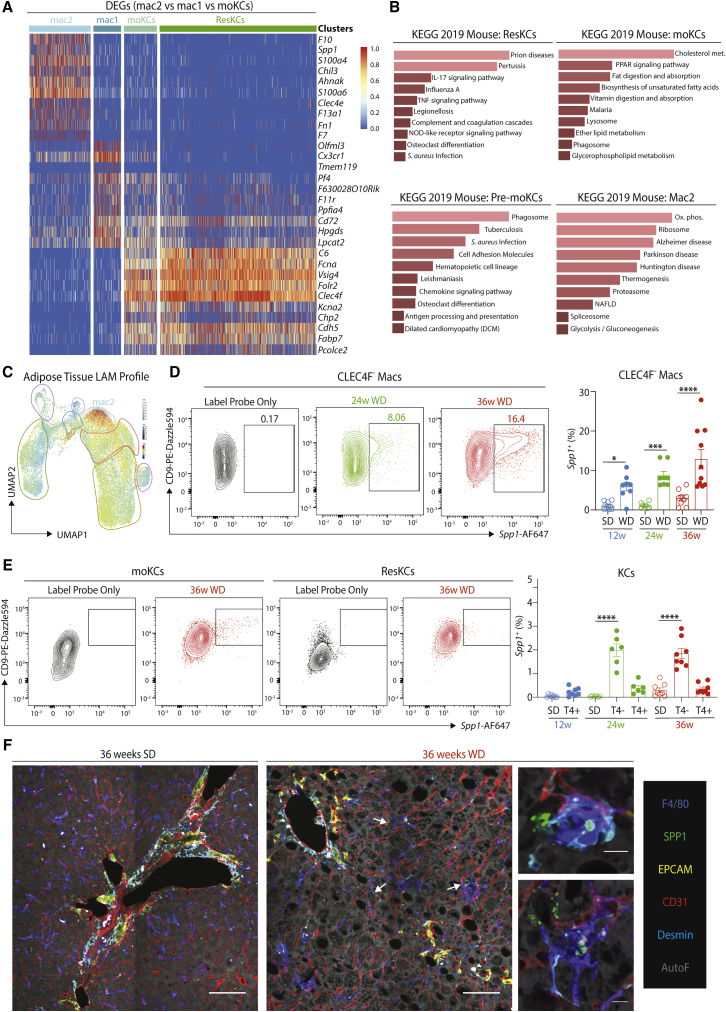
Metabolic-associated fatty liver disease (MAFLD) represents a spectrum of disease states ranging from simple steatosis to non-alcoholic steatohepatitis (NASH). Hepatic macrophages, specifically Kupffer cells (KCs), are suggested to play important roles in the pathogenesis of MAFLD through their activation, although the exact roles played by these cells remain unclear. Here, we demonstrated that KCs were reduced in MAFLD being replaced by macrophages originating from the bone marrow. Recruited macrophages existed in two subsets with distinct activation states, either closely resembling homeostatic KCs or lipid-associated macrophages (LAMs) from obese adipose tissue. Hepatic LAMs expressed Osteopontin, a biomarker for patients with NASH, linked with the development of fibrosis. Fitting with this, LAMs were found in regions of the liver with reduced numbers of KCs, characterized by increased Desmin expression. Together, our data highlight considerable heterogeneity within the macrophage pool and suggest a need for more specific macrophage targeting strategies in MAFLD.

Keywords: Kupffer cells; MAFLD; NAFLD; NASH; Western Diet; lipid; liver; macrophages; subsets.


Conflict of interest statement

Declaration of Interests The authors declare no competing interests.

Figures

None
Graphical abstract
Figure 1
Figure 1
Hepatic Immune Cell Transcriptome and Surface Proteome in MAFLD C57BL/6 mice were fed either an SD or WD for 12, 24, or 36 weeks, and livers were harvested. Total live CD45+ cells were sorted (1 mouse per time point per diet), stained with total-seq A antibodies, and loaded onto the 10X Chromium platform. After QC, 56407 cells remained. (A) UMAP showing distinct clusters among total CD45+ live cells. (B) Expression of indicated proteins based on CITE-Seq antibody binding. (C) Expression of indicated genes across the 25 clusters. (D) Annotation of the cell types within the UMAP based on both transcriptome and surface proteome. (E) Distribution of clusters from SD or WD, with SD data obtained from cells pooled after 12, 24, and 36 weeks. (F–H) Heatmaps showing top DEGs for Monocytes (F), KCs (G), and Clec4f- Macrophages (H) as assessed by comparing SD and WD samples pooled from all time points. Genes in red are conserved across multiple cell types. (I) MEM heatmap showing surface proteins whose expression was altered in at least 1 cell type during MAFLD. (J and K) CITE-Seq data were exported into FlowJo software, and (J) the KC cluster was gated and TIM4 and MerTK expression were examined at indicated time points on WD and in pooled SD-fed mice or (K) the T cell cluster was gated and CD8α and CD8β expression were examined at 36 weeks on WD and in pooled SD-fed mice. See also Figure S2.
Figure 2
Figure 2
Loss of TIM4+ Resident KCs and Replacement from the BM in MAFLD (A) Gating strategy used to identify monocyte and mac populations in all figures (for full gating strategy, see Figure S3A). (B and C) Absolute cell numbers per liver of indicated cell types from mice fed the diets for 12 (blue), 24 (green), or 36 (red) weeks, excluding mice that developed HCC. Data are pooled from 3–7 independent experiments with n = 9–38. ∗∗p < 0.01, ∗∗∗p < 0.001, ∗∗∗∗p < 0.0001. One-way ANOVA compared with pooled SD. (D) Schematic showing generation of protected chimeras. (E and F) % chimerism (compared with blood monocytes) in indicated hepatic populations was assessed in protected chimeras 18 (E) or 24 (F) weeks after feeding the SD or WD. Data are pooled from 2 independent experiments with n = 5–9 per group. (G) % of Ki-67+ cells among Clec4F+ KCs in mice fed the WD for indicated time points, together with pooled results from SD-fed mice (left panel) and representative flow cytometry plots show Ki67 expression by Clec4F+ KCs from a mouse fed SD or WD for 24 weeks (right panels). Data are from 1 (36 weeks) or pooled from 3 (12 and 24 weeks) independent experiments with n = 3–24. (H) Confocal microscopy of livers of SD or WD-fed mice (24 weeks), showing expression of Clec4F (green) and Ki-67 (red). White arrows indicate Ki-67+ KCs. Images are representative of 2 mice per diet. (I) Absolute number of CLEC4F+TIM4+ ResKCs and CLEC4F+TIM4- moKCs in SD- or WD-fed (24 weeks) mice injected with 1 mg/kg CSF1-Fc or PBS subcutaneously for 4 days before being sacrificed at day 6. Data are pooled from 2 independent experiments, with n = 4–6 per group. p < 0.05, ∗∗p < 0.01, unpaired Student’s t test. (J and K) qPCR analysis for indicated genes in LSECs (J) and HSCs (K) sorted from SD- (black) or WD-fed (red) mice (36 weeks). Data are from 1 experiment, with n = 4–6 per group. p < 0.05, Student’s t test. All error bars indicate SEM. See also Figure S3.
Figure 3
Figure 3
Changes in Hepatic Structural Cells in MAFLD C57BL/6 mice were fed an SD or WD for 24 or 36 weeks, and livers were harvested. Live CD45- cells were then sorted (1 mouse per time point per diet) and loaded onto the 10X Chromium platform. After QC, 33,241 cells remained. (A) UMAP showing distinct clusters among total CD45- live cells. (B) Expression of indicated genes across the 5 cell types. (C) Distribution of clusters from SD- or WD-fed mice at 24 weeks (green) or 36 weeks (red). (D) Expression of Mki67 across the different clusters. (E) Expression of Mki67 as determined by qPCR on indicated cells sorted from livers of SD- or WD-fed mice (12, 24, and 36 weeks). Data are from a single experiment, with n = 4–6 per group. p < 0.05, ∗∗p < 0.01, Student’s t test. Error bars indicate ±SEM. (F) Heatmaps showing top 40 DEGs in the indicated cells types between SD- and WD-fed mice (24 and 36 weeks). Genes in green represent DEGs specifically altered at the 36-week time point. (G) qPCR analysis for indicated genes in indicated cell populations. Data are from a single experiment, with n = 4–5 per group. p < 0.05, ∗∗p < 0.01. Error bars indicate ±SEM. See also Figure S4.
Figure 4
Figure 4
Localization and Heterogeneity of Macrophages in MAFLD (A) Confocal microscopy showing cells expressing CLEC4F (red), F4/80 (green), TIM4 (blue), and CD31 (gray) in the livers of SD- or WD-fed mice at the indicated time points. Smaller images show results for individual channels; the larger image is merged from all channels. Scale bar, 50 μm. Images are representative of 5–6 mice per time point and are extracted from 4 × 4 tiled images. White arrows point to CLEC4F+TIM4- moKCs. Dashed line highlights the zones enriched for CLEC4F- macs. (B) Tile scans (4x4) of livers from SD- and WD-fed mice (36 weeks) showing annotation of identified macs per subset in indicated colors. Indicated regions (dashed lines) identify the areas from the WD-fed mouse used in (A). Shaded gray boxes identify large vessels (portal or central veins) that were excluded from quantification analysis in (C) and (E). Images are representative of 6 mice. (C) Quantification of indicated populations shown in (B) as a % of total F4/80+ macs. ∗∗p < 0.01, ∗∗∗∗p < 0.0001, Student’s t test compared with SD control. Error bars indicate ±SEM. (D) Tile scan of liver from a WD-fed mouse (36 weeks; same mouse as from A and B) with identified Desminhi regions demarcated in blue. The rest of the tissue is classified as Desminlo, excluding the larger vessels, for quantification in (E). (E) Quantification of indicated populations in Desminhi and Desminlo zones (from D) as a % of each mac subset. p < 0.05, Student’s t test compared with Desminlo area. Quantification data in (C) and (E) are pooled from 2 independent experiments with n = 6. Error bars indicate ±SEM. (F–I) Monocyte- and mac-containing clusters (based on expression of Mafb, Ly6c2, Ccr2, Fcgr1, Adgre1) were isolated from the CITE-Seq data (18,241 cells) and re-clustered. (F) UMAP showing annotated monocyte and macrophage clusters. (G) Distribution of cells on SD or WD at indicated time points, with SD data coming from cells pooled after 12, 24, and 36 weeks. (H and I) Expression of indicated genes by the different clusters (SD + WD pooled). See also Figure S5.
Figure 5
Figure 5
Hepatic LAMs in MAFLD Are Identified by Spp1 Expression (A) Heatmap showing DEGs between Mac2, Mac1, and moKC populations from mice fed the WD for 24 and 36 weeks pooled and their expression by indicated populations. (B) KEGG pathway analysis on DEGs for each indicated subset (see Tables S1 and S3). (C) The adipose tissue LAM signature (Jaitin et al., 2019) was mapped onto the liver mac UMAP to identify cells with a similar profile using the Signature Finder algorithm (Pont et al., 2019). (D and E) Expression of Spp1 by CLEC4F- macrophages (D) and moKCs and ResKCs (E) at 24 and 36 weeks on WD as measured by Prime Flow (left panels, representative plots), and right, proportions of indicated populations (T4 = TIM4). Data are pooled from 2 experiments with 6 mice per group. p < 0.05, ∗∗∗p < 0.001, ∗∗∗∗p < 0.0001. One-way ANOVA. Error bars indicate ±SEM. (F) Confocal microscopy (2x2 Tiles) showing expression of F4/80 (blue), SPP1 (green), EPCAM (yellow), CD31 (red), Desmin (cyan), and tissue autofluorescence (gray) in livers of SD- and WD-fed mice (36 weeks). Scale bar, 100 μm. White arrows identify SPP1+ macrophages. Inset shows zoomed in images showing colocalization of SPP1 and F4/80 signal (36 weeks WD). Scale bar, 10 μm. Images are representative of 6 mice from 2 independent experiments. See also Figure S6.
Figure 6
Figure 6
Characterization of Recruited Macrophages in MAFLD (A) Heatmap showing expression of immune activation-associated genes in ResKCs, moKCs, pre-moKCs and hepatic LAMs from WD-fed mice (24 and 36 weeks, pooled). (B) Heatmap showing expression of genes associated with lipid metabolism previously reported to be enriched in ResKCs (Scott et al., 2016) in ResKCs, moKCs, pre-moKCs, and hepatic LAMs from WD-fed mice (24 and 36 weeks, pooled). (C) Neutral lipid content of ResKCs (T4+), moKCs (T4-), and CLEC4F- macs (C4-) after 12, 24, and 36 weeks on WD. Results shown are geometric mean for Lipidtox and BODIPY staining normalized to Ly6Chi monocytes from the same liver. p < 005, ∗∗∗p < 0.001, ∗∗∗∗p < 0.0001. One-way ANOVA compared with ResKCs at each time point. Error bars indicate SEM. (D) Lipidomics analysis of sorted CLEC4F+ KCs and CLEC4F- macs from WD-fed mice (24 weeks). Left: PCA plot showing results for different macs. Right: indicated lipid species in CLEC4F+ KCs (C4+) or CLEC4F- macs (C4-). ∗∗p < 0.01 Student’s t test. Error bars indicate ±SEM. See also Figure S6.
Figure 7
Figure 7
Features of ResKCs in MAFLD (A) Heatmap showing expression of immune activation-associated genes by ResKCs after 12, 24, and 36 weeks on the WD, compared with SD (gray) from the same time point. (B) Pro-inflammatory cytokine expression by ResKCs at indicated time points in either SD- or WD-fed mice as measured by intracellular cytokine staining. Data are pooled from 2 experiments, with n = 7–19 mice per group. Error bars indicate ±SEM. (C) Volcano plots showing DEGs between ResKCs (SD or WD) for indicated time points. (D) PCA plot showing metabolomic analysis (non-polar and polar metabolites) of ResKCs after 12 weeks on SD or WD compared with in vitro polarized M0, M1 or M2 BM-derived macrophages. Data are from a single experiment, with n = 3–5 per group. (E and F) Neutral lipid content of ResKCs after 12, 24, and 36 weeks on WD compared with SD. Results shown are geometric mean for (E) Lipidtox and (F) BODIPY staining normalized to Ly6Chi monocytes from the same livers. p < 0.05. One-way ANOVA compared with SD at each time point. Error bars indicate ±SEM. (G) Sorted ResKCs from SD- or WD-fed mice (12 weeks) were allowed to adhere to a coverslip and stained for Lipidtox and DAPI and imaged by confocal microscopy. (H) Heatmap showing expression of genes associated with lipid metabolism profile in ResKCs from the mice fed either the SD or WD (36 weeks). See also Figure S7.

Comment in

References

    1. Arriazu E., Ge X., Leung T.-M., Magdaleno F., Lopategi A., Lu Y., Kitamura N., Urtasun R., Theise N., Antoine D.J., Nieto N. Signalling via the osteopontin and high mobility group box-1 axis drives the fibrogenic response to liver injury. Gut. 2017;66:1123–1137. - PMC - PubMed
    1. Ashburner M., Ball C.A., Blake J.A., Botstein D., Butler H., Cherry J.M., Davis A.P., Dolinski K., Dwight S.S., Eppig J.T., The Gene Ontology Consortium Gene ontology: tool for the unification of biology. Nat. Genet. 2000;25:25–29. - PMC - PubMed
    1. Bain C.C., Hawley C.A., Garner H., Scott C.L., Schridde A., Steers N.J., Mack M., Joshi A., Guilliams M., Mowat A.M.I. Long-lived self-renewing bone marrow-derived macrophages displace embryo-derived cells to inhabit adult serous cavities. Nat Commun. 2016;7 ncomms11852. - PMC - PubMed
    1. Ballardini G., Fallani M., Biagini G., Bianchi F.B., Pisi E. Desmin and actin in the identification of Ito cells and in monitoring their evolution to myofibroblasts in experimental liver fibrosis. Virchows Arch. B Cell Pathol. Incl. Mol. Pathol. 1988;56:45–49. - PubMed
    1. Bankhead P., Loughrey M.B., Fernández J.A., Dombrowski Y., McArt D.G., Dunne P.D., McQuaid S., Gray R.T., Murray L.J., Coleman H.G. QuPath: Open source software for digital pathology image analysis. Sci. Rep. 2017;7:16878. - PMC - PubMed

Publication types