. 2020 Sep 17;182(6):1606-1622.e23.
doi: 10.1016/j.cell.2020.08.003. Epub 2020 Sep 3.

The Human and Mouse Enteric Nervous System at Single-Cell Resolution

Affiliations

The Human and Mouse Enteric Nervous System at Single-Cell Resolution

Eugene Drokhlyansky et al. Cell. .

Abstract

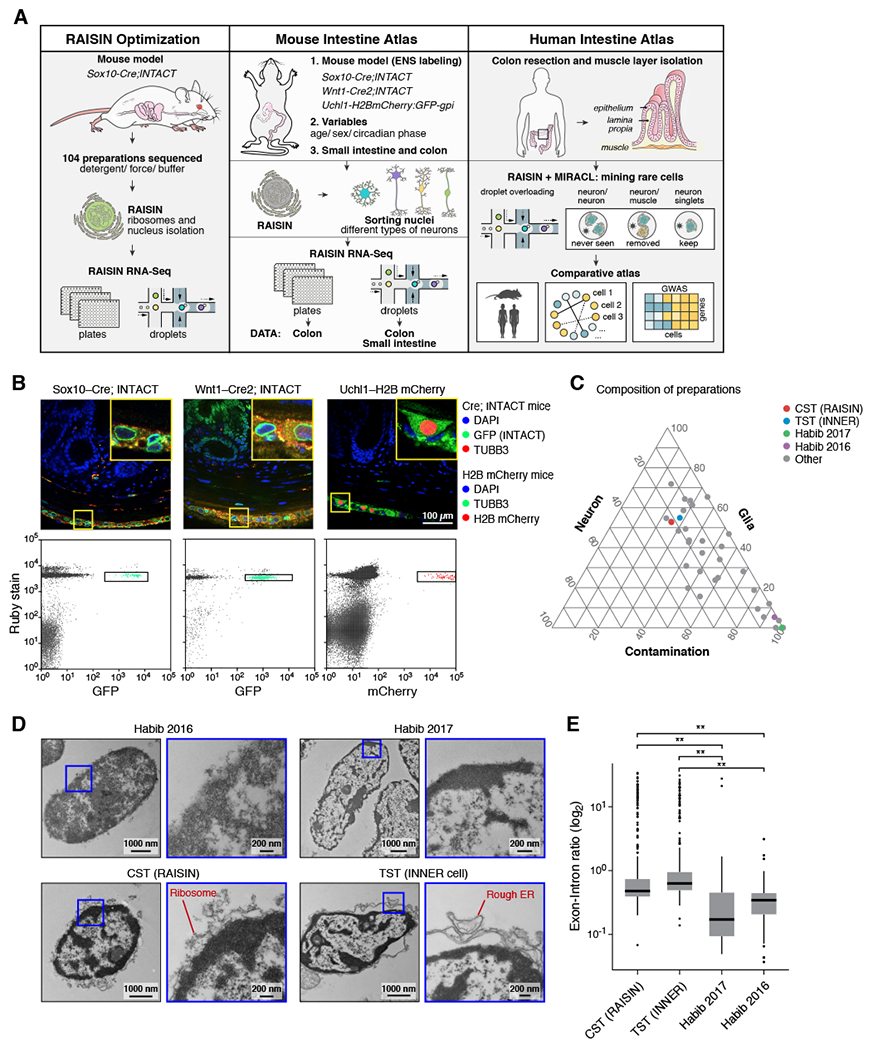
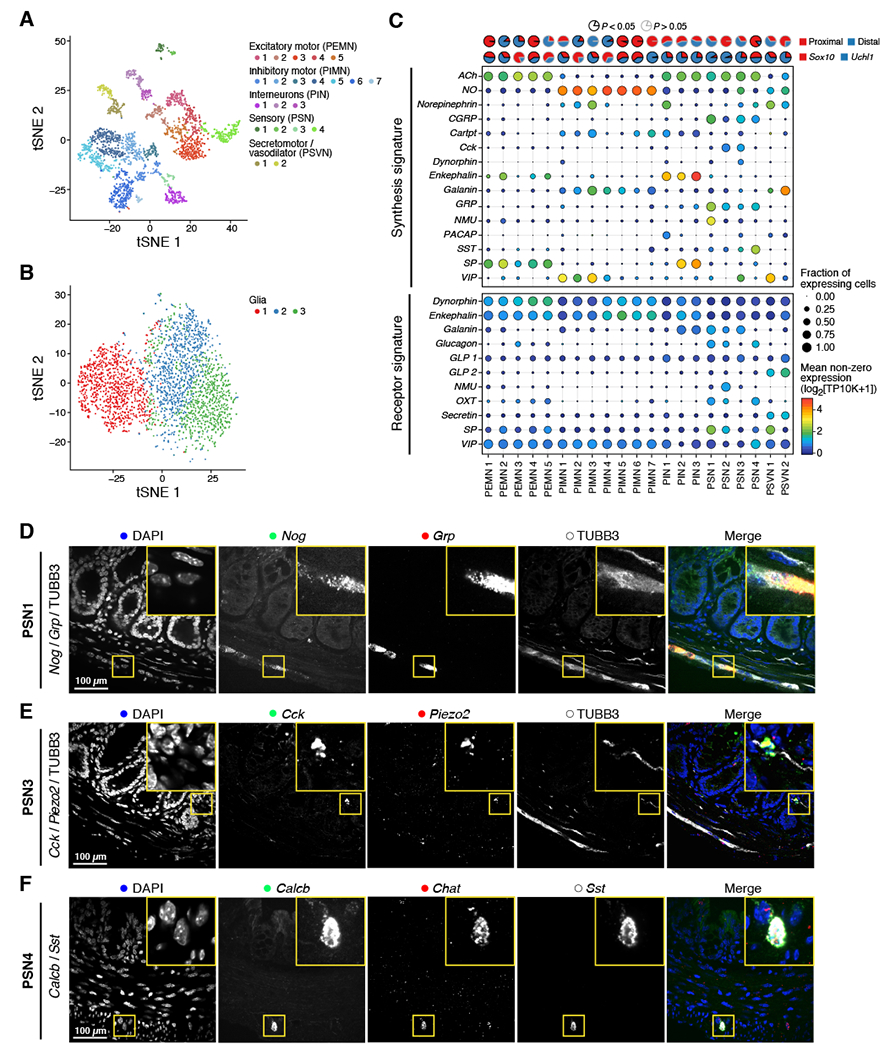
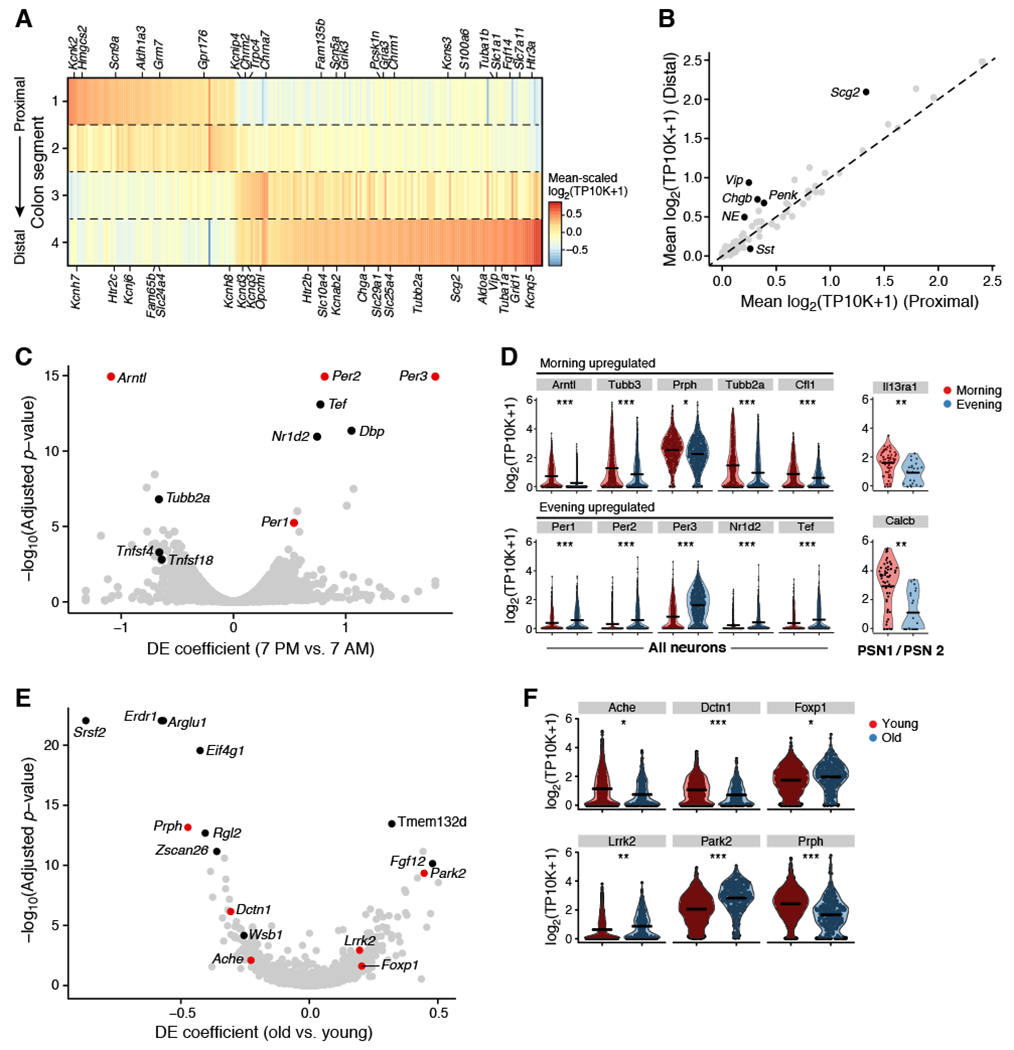
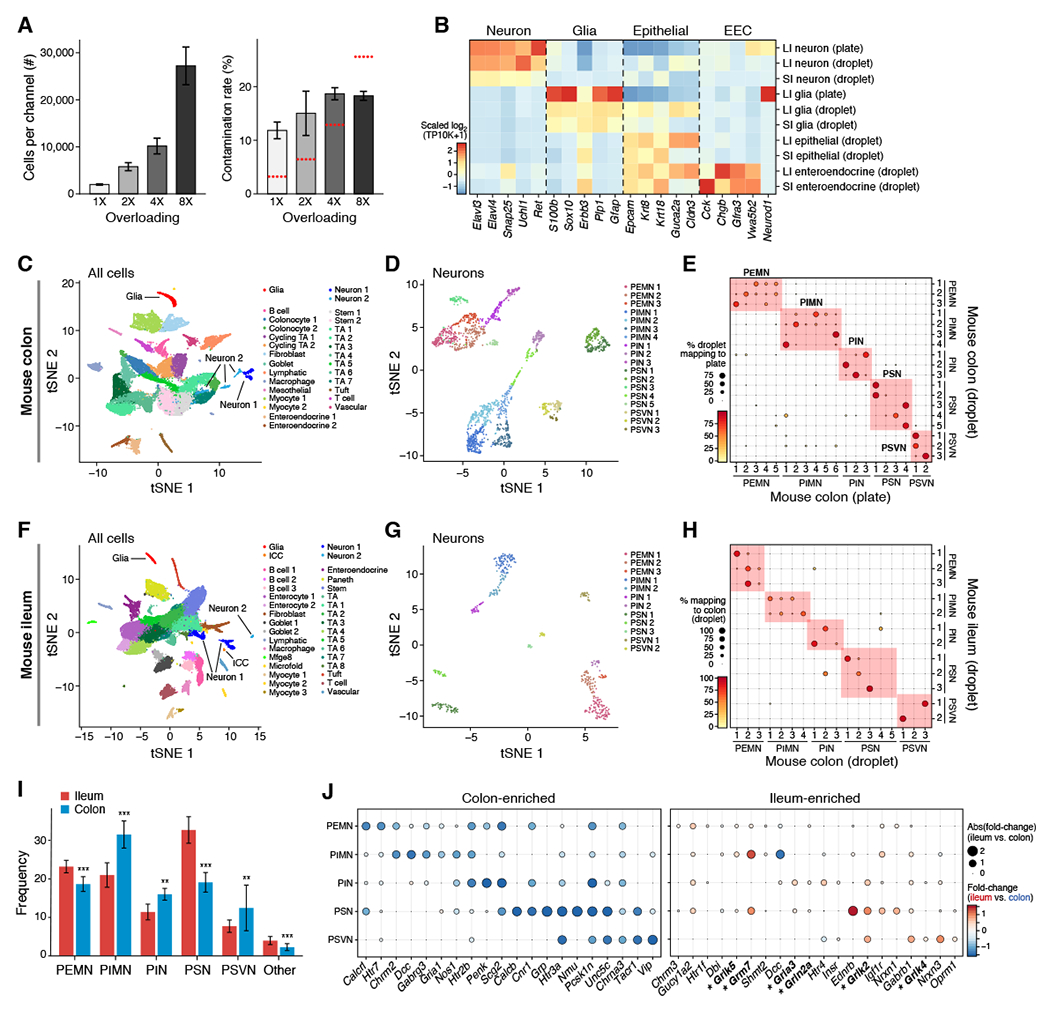
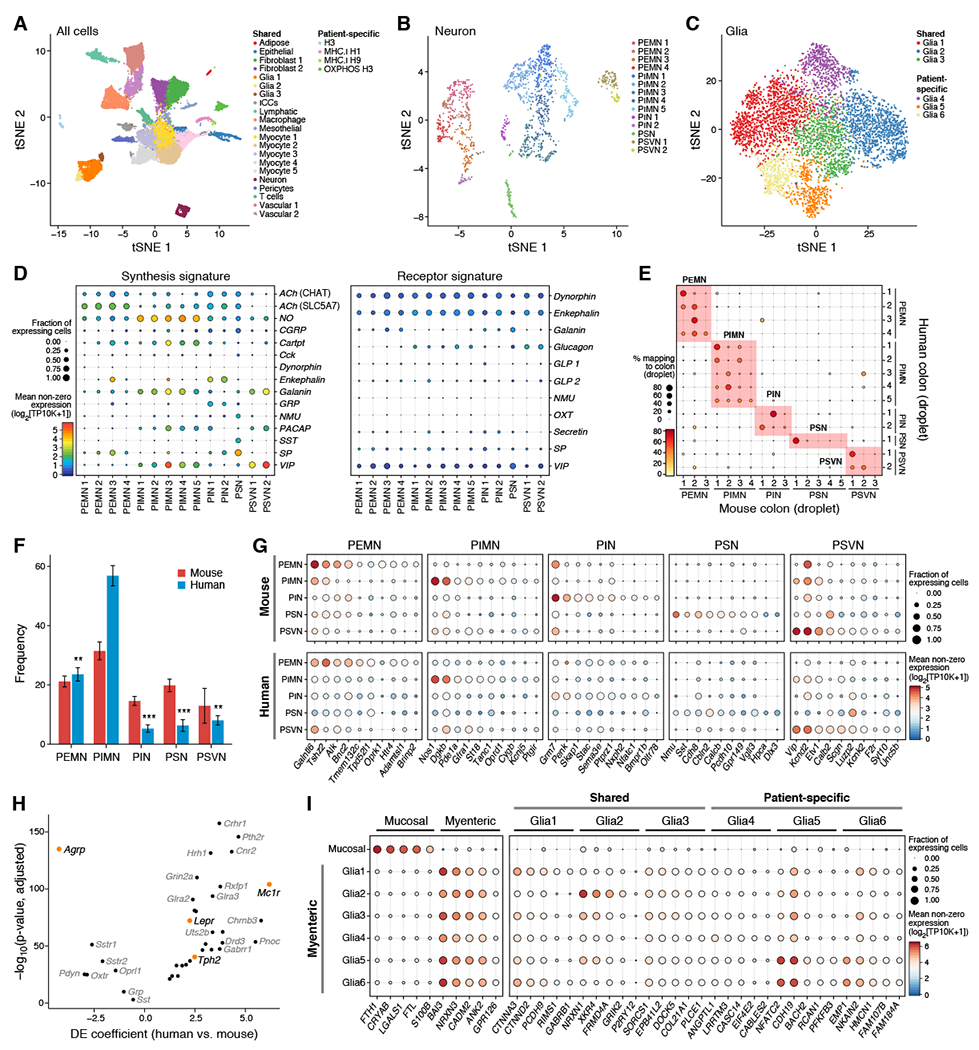
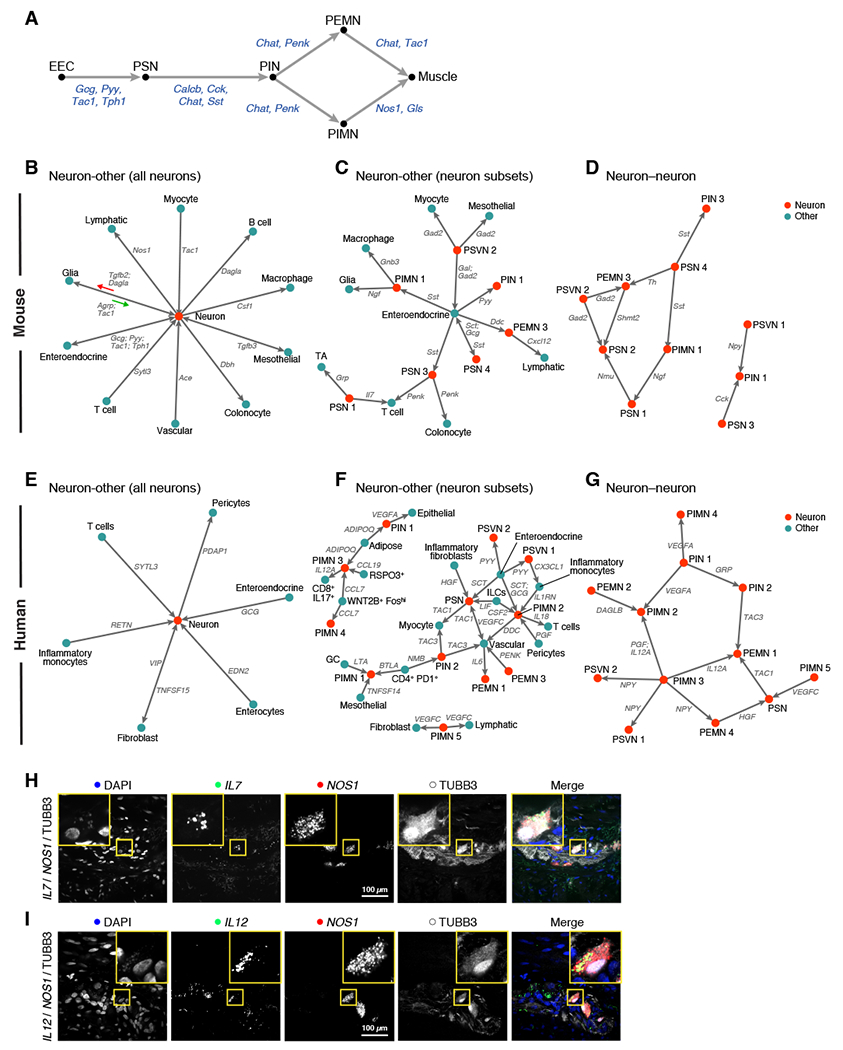
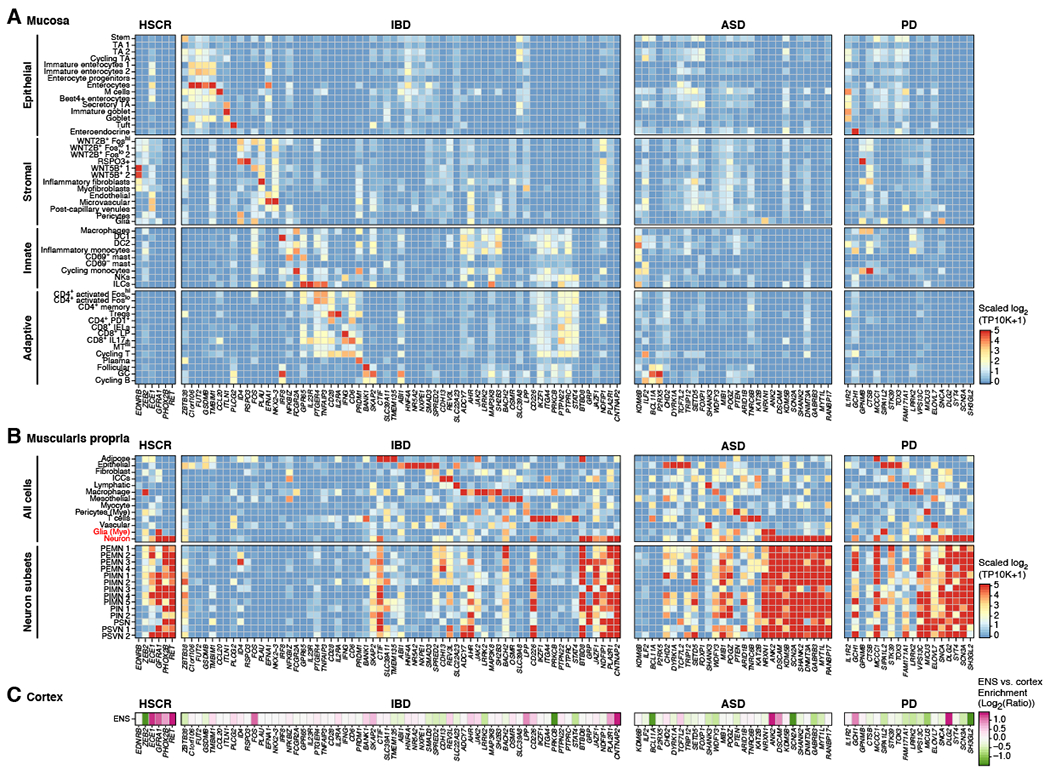
The enteric nervous system (ENS) coordinates diverse functions in the intestine but has eluded comprehensive molecular characterization because of the rarity and diversity of cells. Here we develop two methods to profile the ENS of adult mice and humans at single-cell resolution: RAISIN RNA-seq for profiling intact nuclei with ribosome-bound mRNA and MIRACL-seq for label-free enrichment of rare cell types by droplet-based profiling. The 1,187,535 nuclei in our mouse atlas include 5,068 neurons from the ileum and colon, revealing extraordinary neuron diversity. We highlight circadian expression changes in enteric neurons, show that disease-related genes are dysregulated with aging, and identify differences between the ileum and proximal/distal colon. In humans, we profile 436,202 nuclei, recovering 1,445 neurons, and identify conserved and species-specific transcriptional programs and putative neuro-epithelial, neuro-stromal, and neuro-immune interactions. The human ENS expresses risk genes for neuropathic, inflammatory, and extra-intestinal diseases, suggesting neuronal contributions to disease.

Keywords: ENS; GWAS; aging; circadian; colon; enteric nervous system; enteric neuron; ileum; neuro-immune; single cell.


Conflict of interest statement

Declaration of Interests A.R. is a co-founder and equity holder of Celsius Therapeutics, equity holder of Immunitas, and, until August, 2020, an SAB member of ThermoFisher Scientific, Syros Pharmaceuticals, Neogene Therapeutics, and Asimov. A.R. is an employee of Genentech Inc. R.J.X. is a co-founder and equity holder of Celsius Therapeutics and Jnana Therapeutics. E.D. is an employee of Bristol-Myers Squibb. E.D., C.S., G.E., O.R.R., R.X., and A.R. are co-inventors on PCT/US2019/055894, which includes the methods of this manuscript.

Figures

Figure 1:
Figure 1:. RAISIN RNA-Seq provides an ENS reference map of adult mice and humans.
(A) Study design. (B) Validation of ENS reporter mice. Top: Representative cross-sections of muscularis propria (bottom) and mucosa (top), with TUBB3+ neurons. Bottom: Representative FACS plots. (C) Proportion of neurons, glia, and other cell subsets (triangle edges) from each extraction condition (n = 36 conditions, 104 experiments; dots), with select conditions labeled (legend). (D) RAISIN and INNER Cell yield nuclei with attached ribosomes and rough ER. Ultra-thin section TEM of published extractions (top; n = 2 experiments) vs. RAISIN and INNER Cell (bottom; n = 3 experiments). (E) Higher exon-intron ratios for RAISIN and INNER Cell. Distribution of exon-intron ratios (y axis) following snRNA-seq from each condition (x axis). All comparisons of RAISIN or INNER Cell vs. published methods significant (Wilcoxon test, p-value < 10−10); boxplots: 25%, 50%, and 75% quantiles; error bars: SD. See also Figure S1 and Table S1.
Figure 2:
Figure 2:. Reference map of the mouse colon ENS reveals 21 neuron and 3 glia subsets.
(A-C) Reference map of ENS in adult mouse colon (n = 102 samples collected from 29 total mice). (A,B) t-stochastic neighborhood embedding (t-SNE) of 2,657 neurons (A) or 3,039 glia (B) (dots) colored by subset and annotated post-hoc (legend). (C) Neuron subsets vary by location, transgenic model, and signaling. Top: Proportions of neuron subsets (columns) isolated from each colon region (upper pie chart) or transgenic model (lower pie chart). Bottom: Fraction of nuclei (dot size) in each subset expressing synthesis or receptor genes for signaling pathways, and their mean expression level in expressing cells (dot color). SP: Substance P, GLP: glucagon-like peptide. (D-F) Validation of gene expression in situ. Representative smFISH (n = 3 biological replicates per stain) for Nog and Grp showing co-expression of PSN1 markers with TUBB3 immunostaining (D), Cck and Piezo2 showing co-expression of PSN3 markers with TUBB3 immunostaining (E), and Calcb and Sst showing co-expression of PSN4 markers with Chat smFISH staining (F). Scale bar: 100 μm. See also Figures S2–S4, and Tables S2 and S3.
Figure 3:
Figure 3:. Mouse colon ENS varies with intestinal location, circadian phase, and age.
(A,B) Regional changes in ENS gene expression. (A) Mean expression levels (color bar) of DE genes for neurons from regions 1, 2, 3, and 4 (n = 682, 742, 506, and 657 neurons per region), sorted by peak expression. (B) Mean expression levels of synthesis and receptor genes for neurotransmitters and neuropeptides in distal (y axis, n = 1,163) vs. proximal (x axis, n = 1,424) colon. Dashed line: identity. Select genes highlighted in black. (C,D) Circadian changes in ENS gene expression. (C) DE genes between neurons from evening (n = 1,432 neurons; 11 mice) vs. morning (n = 1,170 neurons; 13 mice) showing effect size (x axis) and significance (y axis). Red dots: clock genes. (D) Distribution of gene expression levels (y axis) of select genes (x axis) upregulated in morning (red) or evening (blue) across all neurons (left) or in PSN1 and PSN2 (right). MAST regression (discrete term), adjusted p, * = 0.05, ** = 0.01, *** = 0.001. (E,F) Aging changes in ENS gene expression. (E) DE genes between neurons from aged (n = 434 neurons; 7 mice) vs. young (n = 2,223 neurons; 22 mice) mice, showing effect size (x axis) and significance (y axis). (F) Distribution of gene expression levels (y axis) of select risk genes (x axis) for neurodegenerative diseases. MAST regression (discrete term), adjusted p, * = 0.05, ** = 0.01, *** = 0.001. See also Table S3.
Figure 4:
Figure 4:. MIRACL-Seq enables efficient droplet-based profiling of the mouse ENS in the ileum and colon.
(A) Cell and doublet recovery using MIRACL-Seq. Number of nuclei per channel (left, y axis) and contamination rate (right, y axis) for a range of overloading coefficients (x axis). Error bars: SEM. Red line: expected multiplet rate. (B) MIRACL-Seq recovers high quality ENS. Mean expression levels (color bar) of select hallmark genes (columns) across cell subsets (rows). (C-E) MIRACL-Seq recapitulates plate-based colon atlas. (C) t-SNE of 343,000 highest-quality mouse colon nuclei (dots; n = 16 channels, 6 mice) colored by subset and annotated post-hoc. (D) t-SNE of 1,938 mouse colon neurons (dots) colored by subset and annotated with classifier. (E) Percent of neurons (dot size and color) from droplet-based subsets (rows) that map onto plate-based subsets (columns) using classifier. (F-H) Congruent subsets in ileum and colon. (F) t-SNE of 79,293 highest-quality mouse ileum nuclei (dots; n = 7 channels, 4 mice) colored by subset and annotated post-hoc. (G) t-SNE of 473 mouse ileum neurons (dots) colored by subset and annotated with classifier. (H) Percent of neurons (dot size and color) from droplet-based ileum subsets (rows) that map onto droplet-based colon subsets (columns) using classifier. (I-J) ENS differences between ileum and colon. (I) Frequencies (y axis) of neuron types (x axis) in ileum (n = 7; red) and colon (n = 16; blue). Dirichlet-multinomial regression, adjusted p, * = 0.05, ** = 0.01, *** = 0.001; error bars: SEM. (J) Fraction of nuclei (dot size) in neuron types (rows) expressing select genes (columns) that were enriched in the colon (left) or ileum (right), and their fold-change in colon vs. ileum (dot color; blue: colon-enriched, red: ileum-enriched) See also Figures S5-S7, and Tables S2, S4, and S6.
Figure 5:
Figure 5:. Human colon ENS atlas reveals conserved expression programs across species.
(A-E) Reference map of human colon muscularis ENS. (A) t-SNE of 146,442 highest-quality human colon nuclei (dots; n = 52 channels, 16 patients) colored by subset and annotated post-hoc. (B) t-SNE of 1,445 human colon neurons (dots) colored by subset and annotated with classifier. (C) t-SNE of 6,054 human colon glia (dots) colored by shared or unique subsets (legend). (D) Human colon neurons express diverse signaling genes. Fraction of cells (dot size) in subsets (columns) expressing synthesis (left) or receptor (right) genes for signaling molecules (rows), and their mean expression level in expressing cells (dot color). (E) Percent of neurons (dot size and color) from droplet-based human colon subsets (rows) that map onto droplet-based mouse colon subsets (columns) using classifier. (F) Differences in ENS composition between species. Frequencies (y axis) of neuron types in mouse (n = 16; red) or human (n = 14; blue) colon. Dirichlet-multinomial regression, adjusted p, * = 0.05, ** = 0.01, *** = 0.001); error bars: SEM. (G) Conserved expression programs between species. Fraction of nuclei (dot size) in neuron types (rows) expressing select genes (columns) from conserved transcriptional programs, and their mean expression level in expressing cells (dot color), for mouse (top) and human (bottom). (H) DE genes between colon neurons from human (n = 1,445) vs. mouse (n = 1,938) showing effect size (x axis) and significance (y axis). (I) Fraction of cells (dot size) in each glia subset (rows) expressing select marker genes (columns) and their mean expression level in expressing cells (dot color), for mucosal vs. myenteric glia (left) or myenteric subsets (right). See also Figures S4–S7, and Tables S2 and S4.
Figure 6:
Figure 6:. Cell-cell interactions connect the ENS and diverse cell subsets in mouse and human.
(A) Recovery of peristaltic circuit in mouse colon. Interactions (arrows) from ligand- to receptor-expressing cell subsets involved in the peristaltic circuit. Black: cell subset; Blue: ligand; EEC: enteroendocrine cell. (B-G) ENS interactions in mouse and human colon. For mouse (B-D) and human (E-G) colon, interactions (arrows) from ligand- to receptor-expressing cell subsets, between all neurons and other subsets (B, E), neuron subsets and other subsets (C,F), or among neuron subsets (D,G). Grey: ligand; Red: neuron subset; Blue: other subset. (H,I) Expression validation for putative neuro-immune interactions. Representative smFISH (n = 3 biological replicates per stain) for IL7 and NOS1 showing expression of IL-7 in nitrergic neurons (H) and IL12A and NOS1 showing expression of IL-12 in nitrergic neurons (I), with TUBB3 immunostaining. Scale bar: 100 μm. See also Table S5.
Figure 7:
Figure 7:. Human ENS expresses risk genes for intestinal and extraintestinal diseases.
(A,B) Mean expression levels across cell subsets (rows) of risk genes (columns) implicated by genome-wide association studies for Hirschsprung’s disease (HRSC), inflammatory bowel disease (IBD), autism spectrum disorders (ASD), and Parkinson’s disease (PD), which are enriched in cell subsets from either the human colon mucosa (A) or muscularis propria (B). (C) Fold enrichment (log2) of the expression of disease risk genes in colon vs. cortex neurons. See also Figure S4.

Comment in

References

    1. Assas BM, Pennock JI, and Miyan JA (2014). Calcitonin gene-related peptide is a key neurotransmitter in the neuro-immune axis. Front. Neurosci. 8, 23. - PMC - PubMed
    1. Benjamini Y, and Hochberg Y (1995). Controlling the False Discovery Rate: A Practical and Powerful Approach to Multiple Testing. J. R. Stat. Soc. Series B Stat. Methodol. 57, 289–300.
    1. Bernard CE, Gibbons SJ, Gomez-Pinilla PJ, Lurken MS, Schmalz PF, Roeder JL, Linden D, Cima RR, Dozois EJ, Larson DW, et al. (2009). Effect of age on the enteric nervous system of the human colon. Neurogastroenterol. Motil. 21, 746–e46. - PMC - PubMed
    1. Bernstein N, Fong N, Lam I, Roy M, Hendrickson DG, and Kelley DR (2019). Solo: doublet identification via semi-supervised deep learning. - PubMed
    1. Betancur P, Bronner-Fraser M, and Sauka-Spengler T (2010). Genomic code for Sox10 activation reveals a key regulatory enhancer for cranial neural crest. Proc. Natl. Acad. Sci. U. S. A. 107, 3570–3575. - PMC - PubMed

Publication types

MeSH terms