. 2020 Oct 12;38(4):534-550.e9.
doi: 10.1016/j.ccell.2020.08.003. Epub 2020 Sep 3.

FOXA1 Mutations Reveal Distinct Chromatin Profiles and Influence Therapeutic Response in Breast Cancer

Affiliations

FOXA1 Mutations Reveal Distinct Chromatin Profiles and Influence Therapeutic Response in Breast Cancer

Amaia Arruabarrena-Aristorena et al. Cancer Cell. .

Abstract

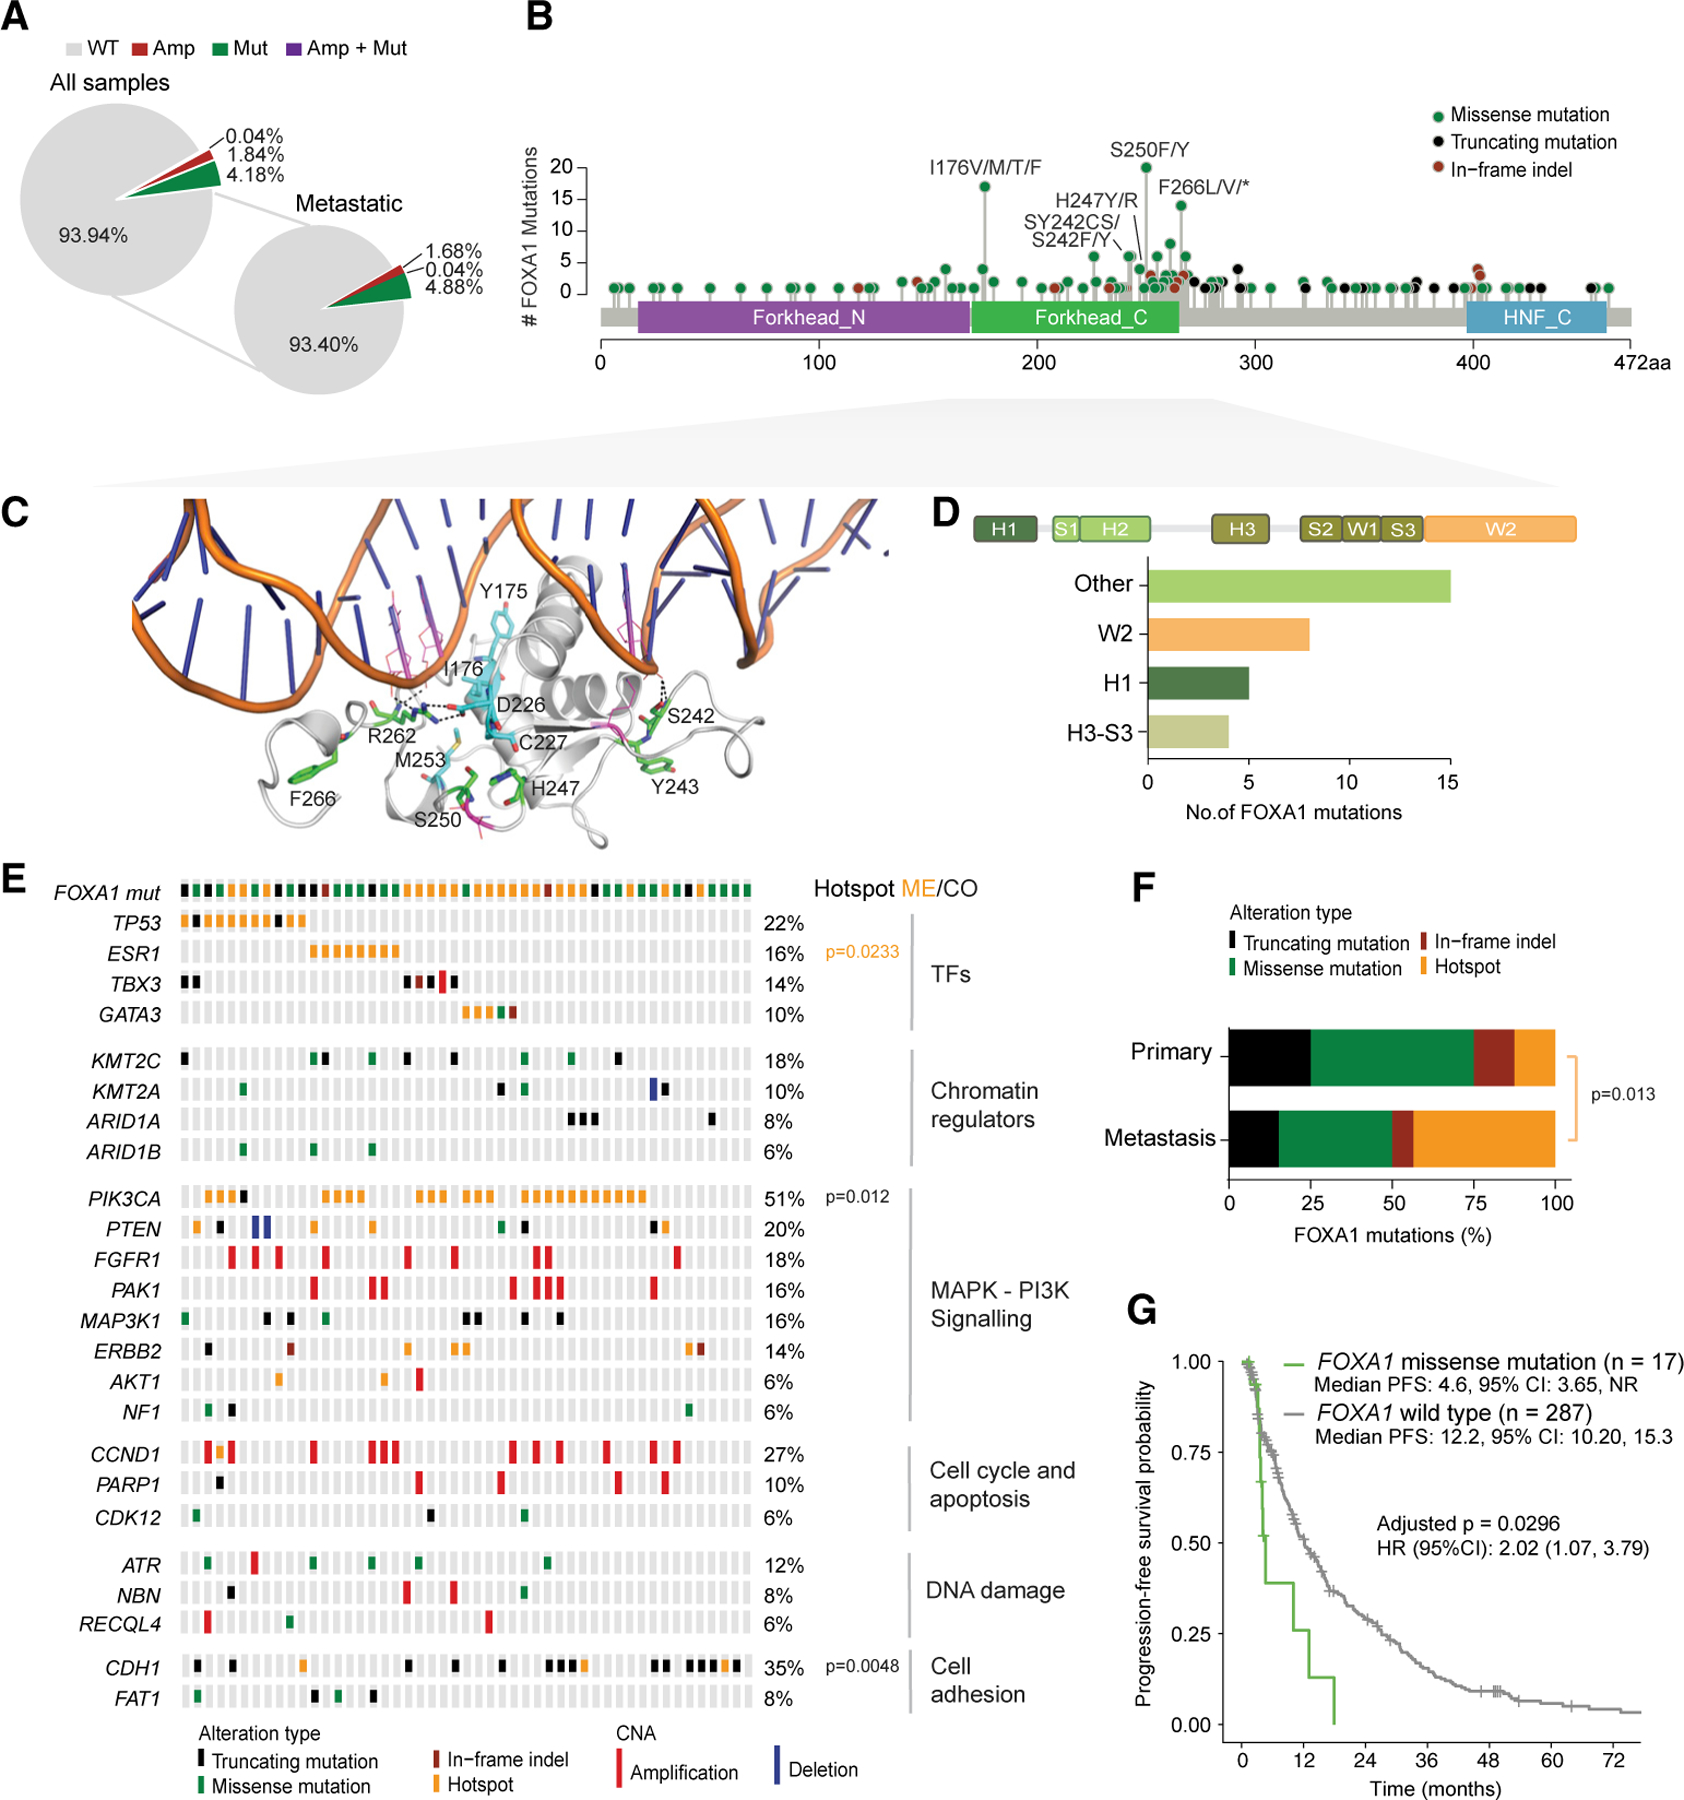
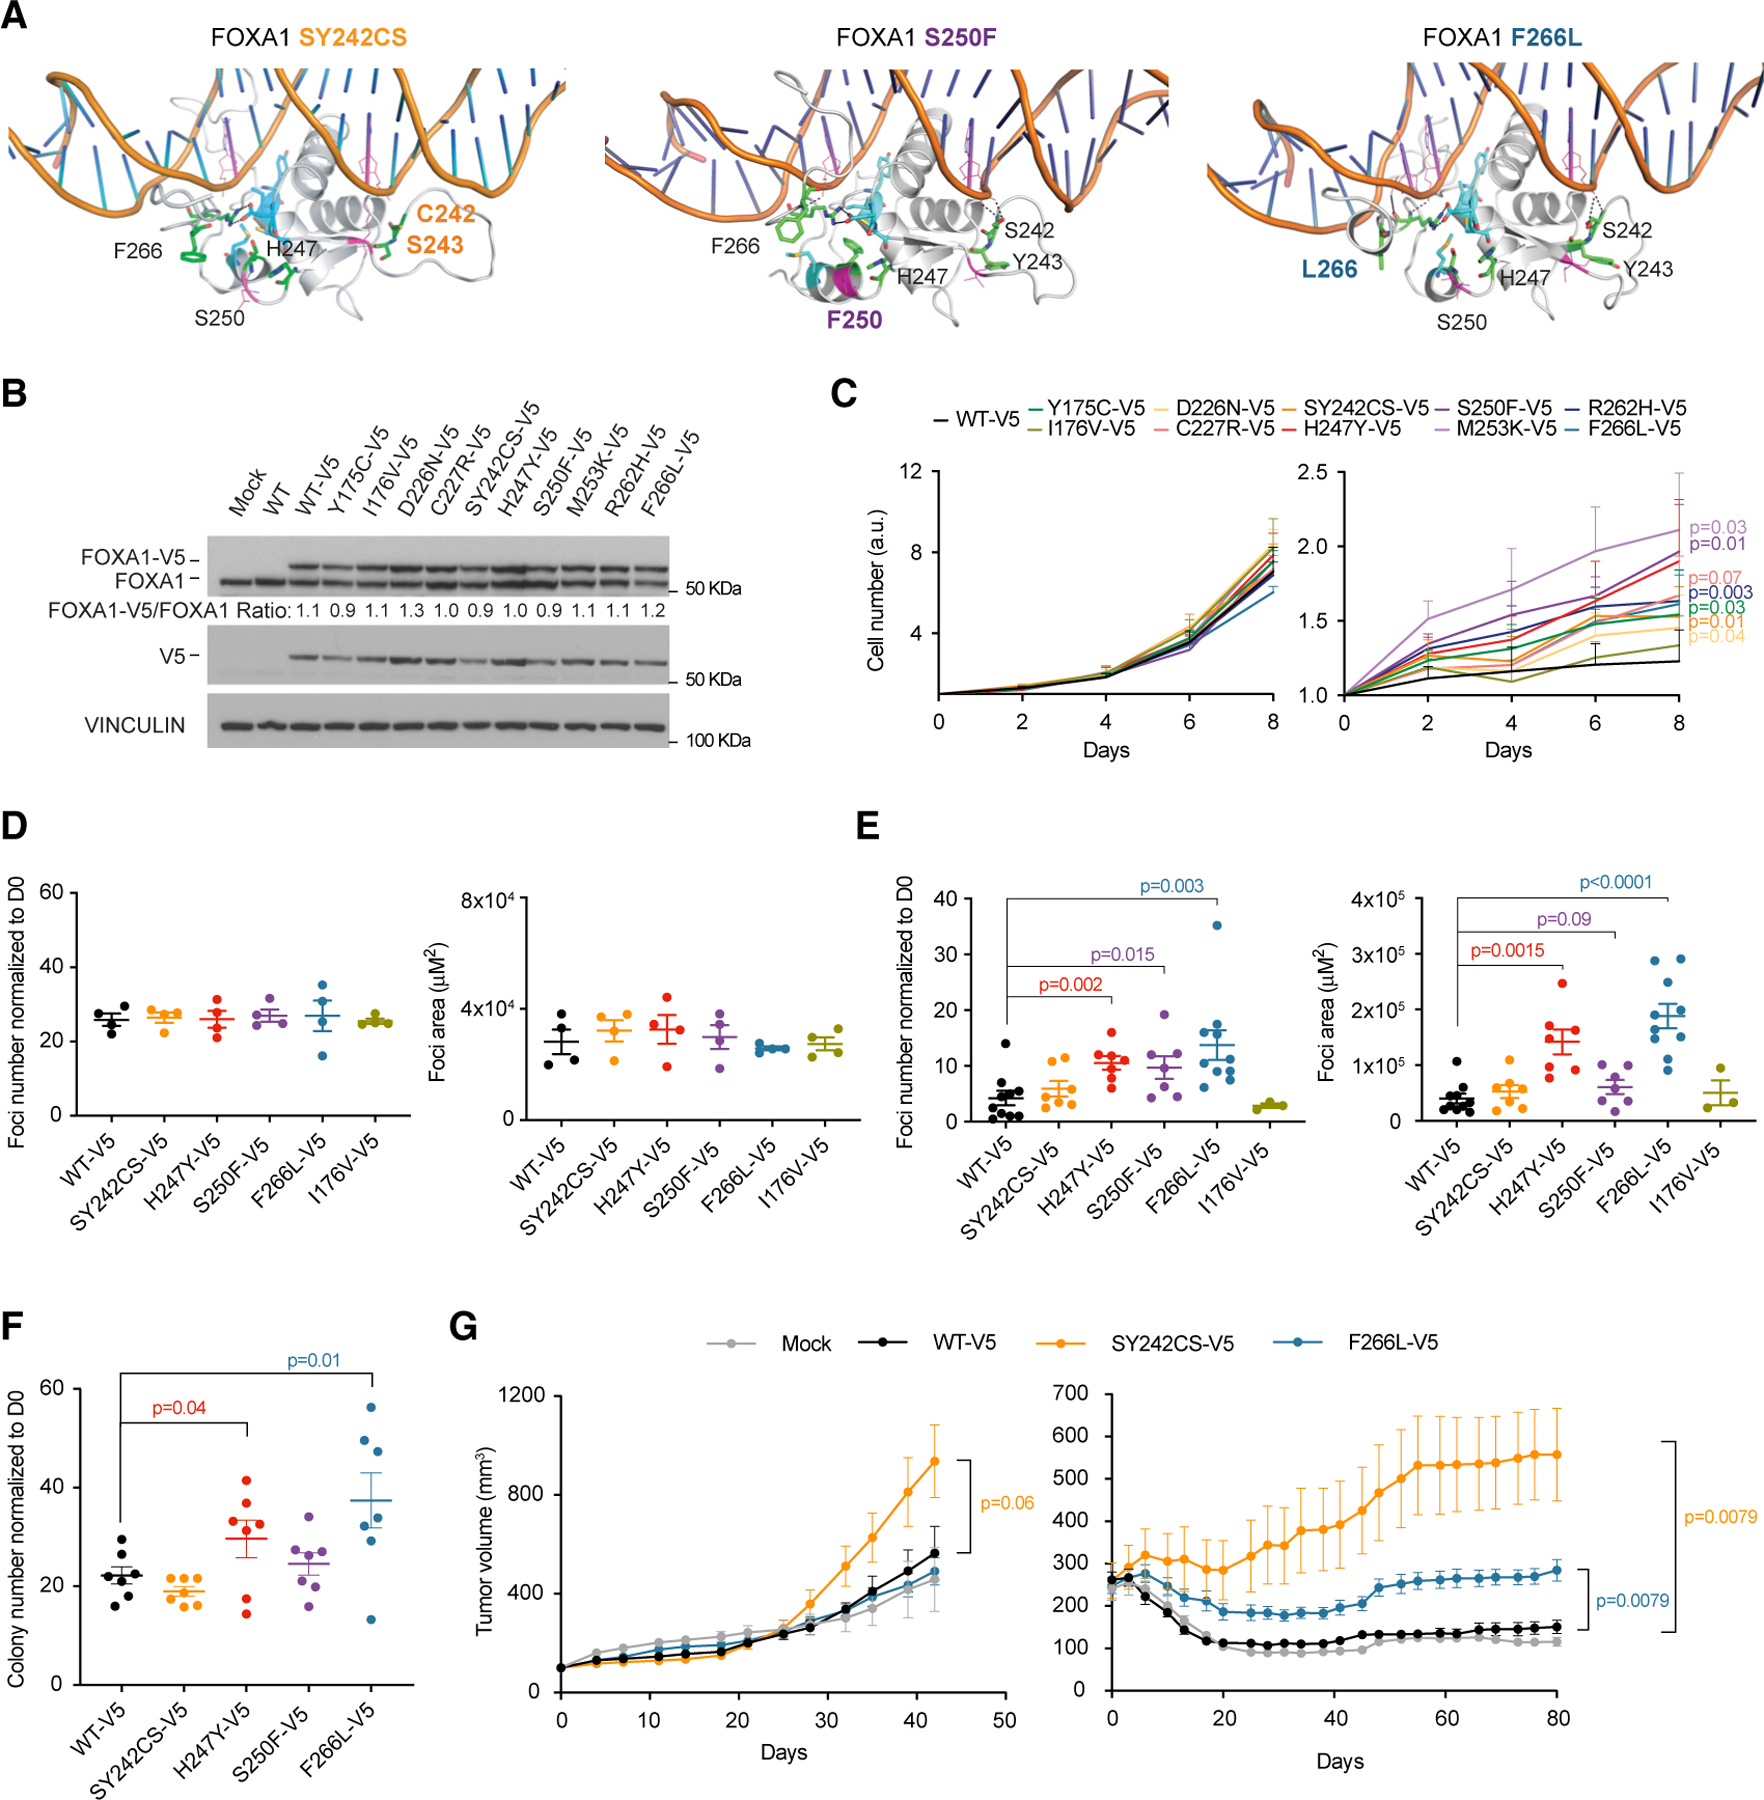
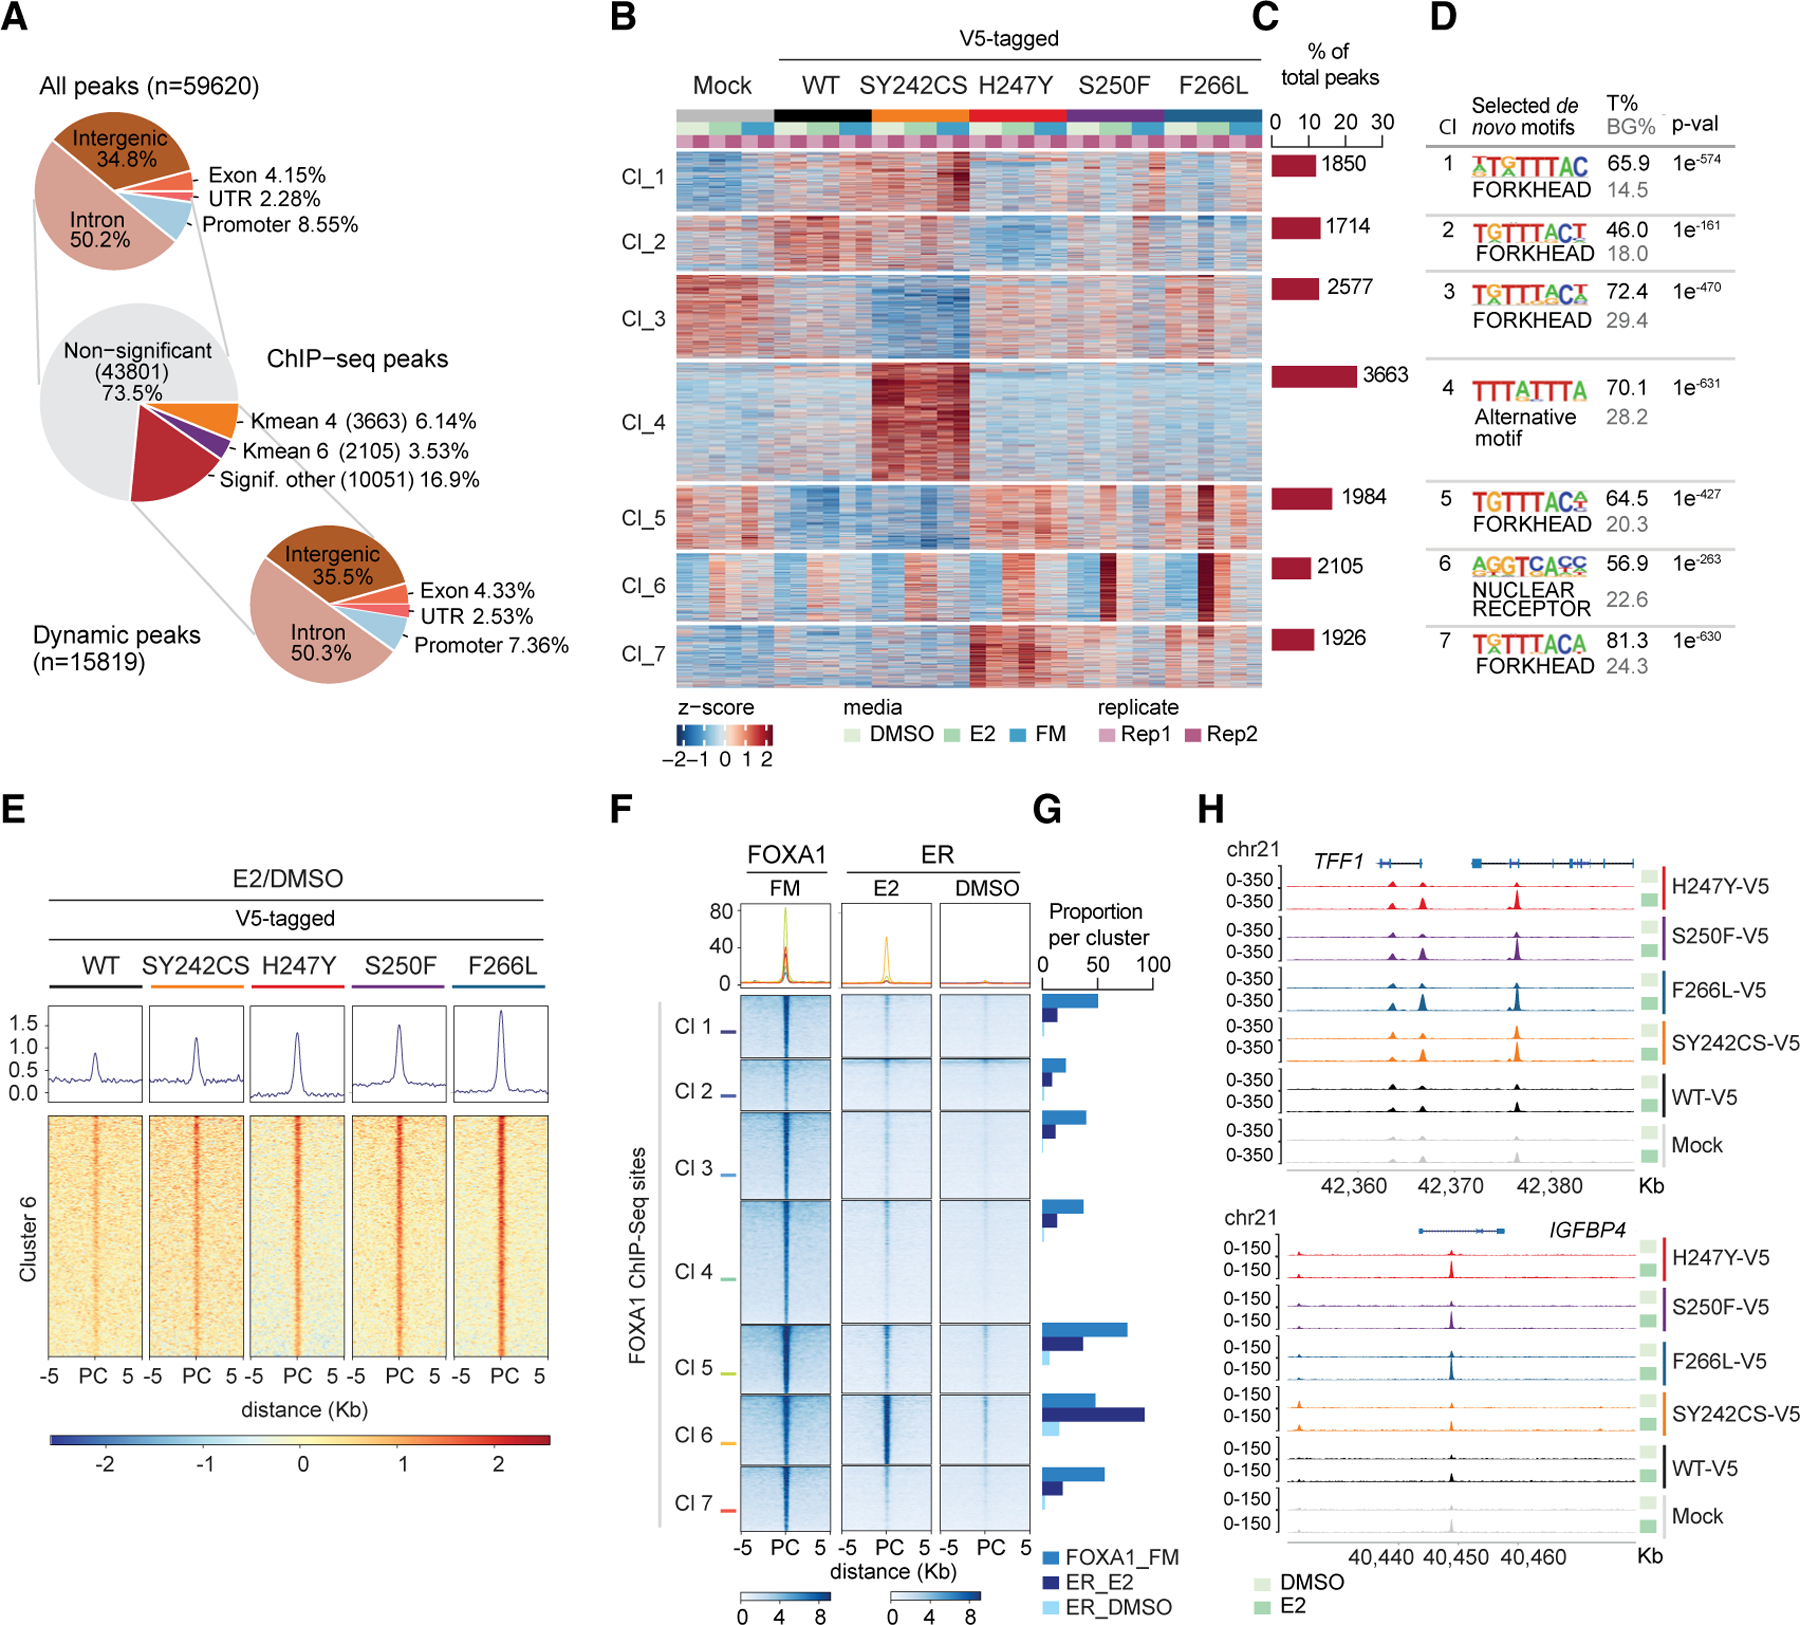
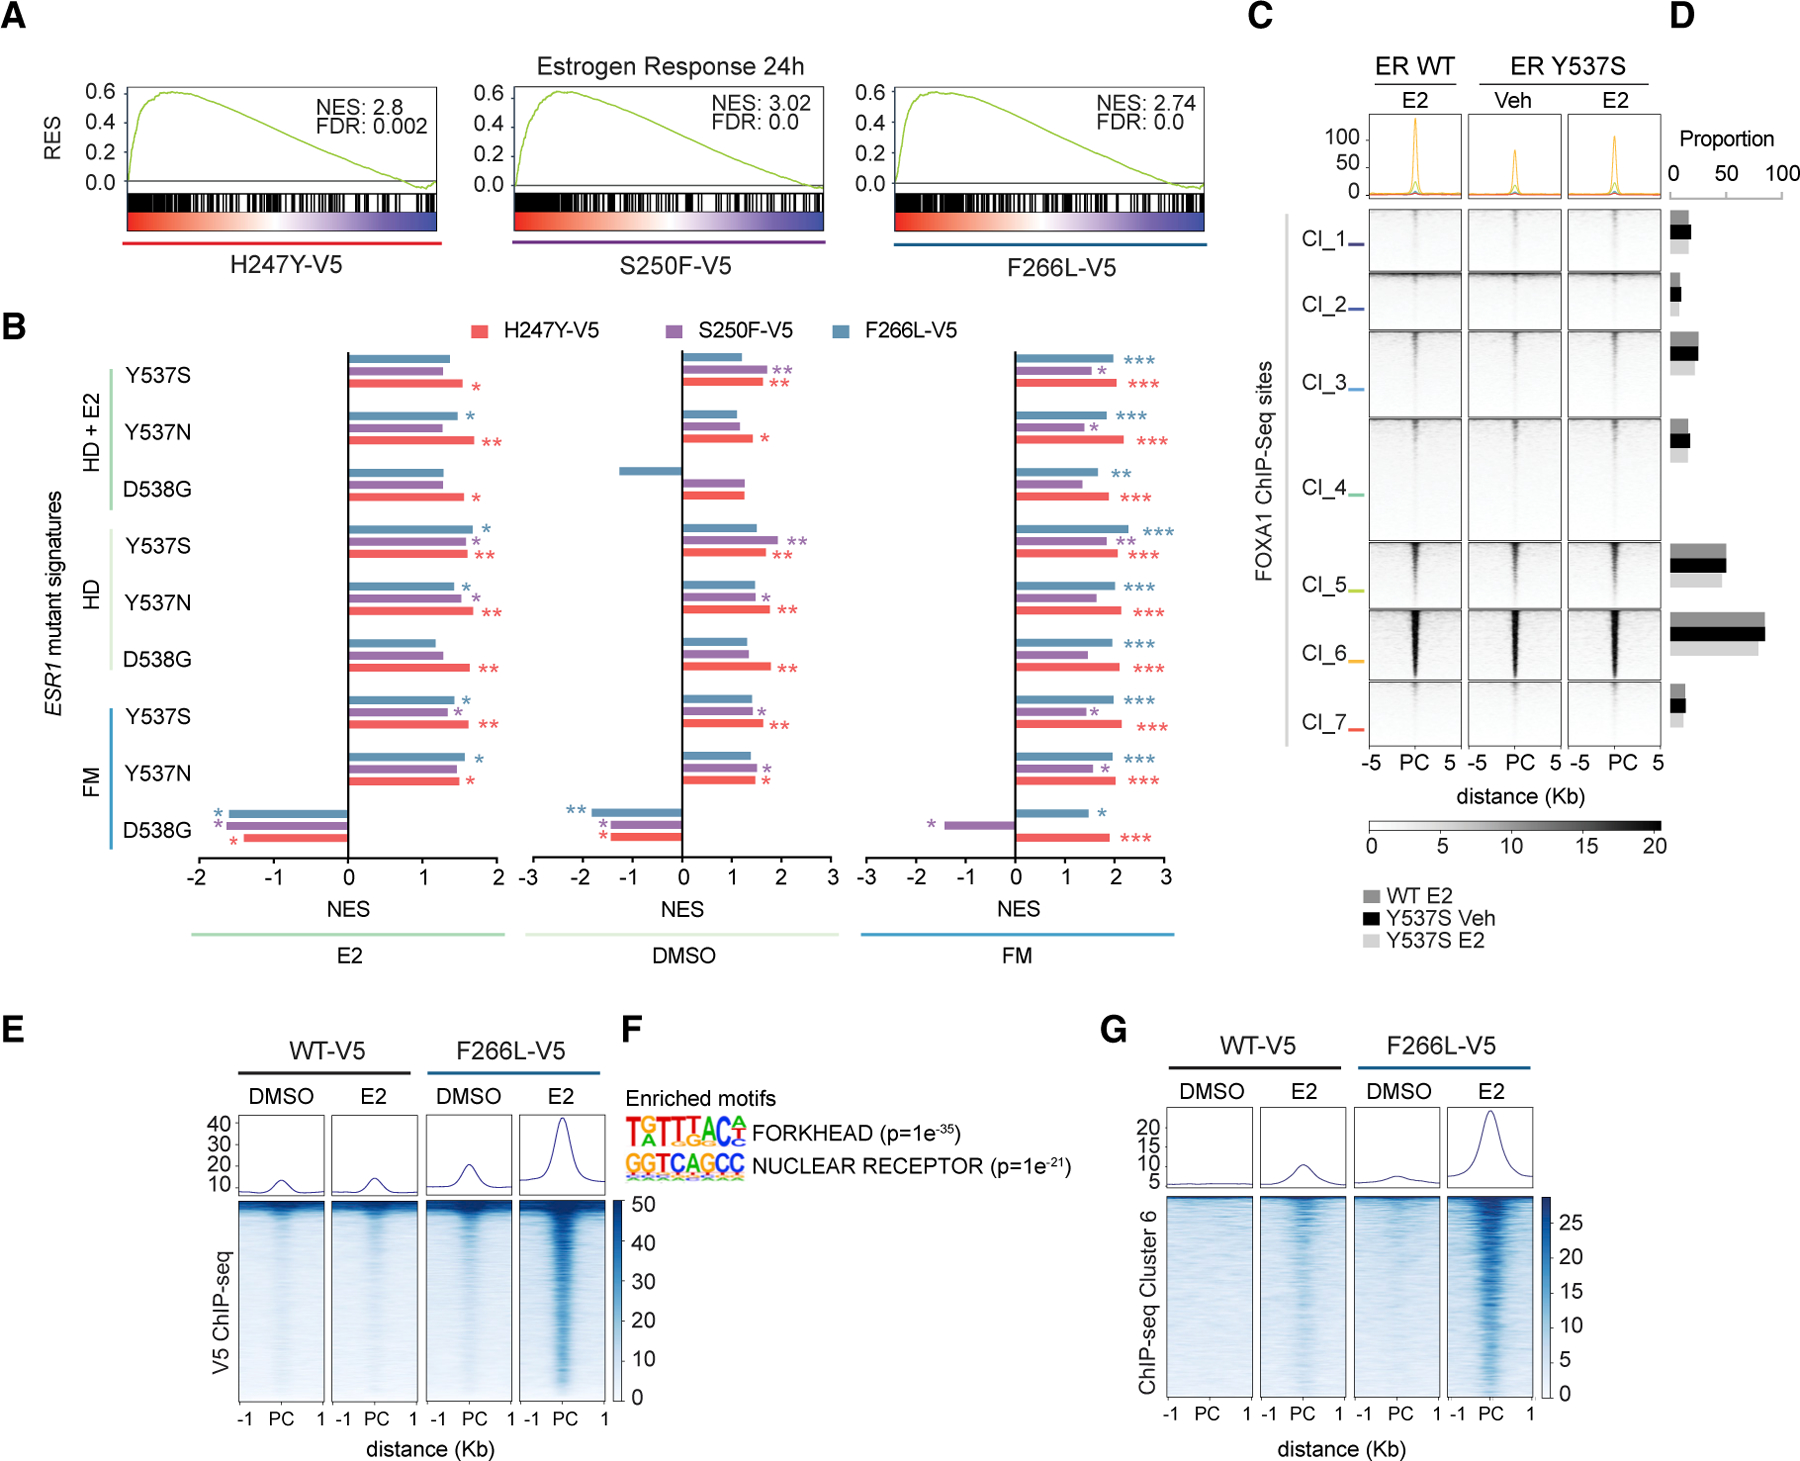
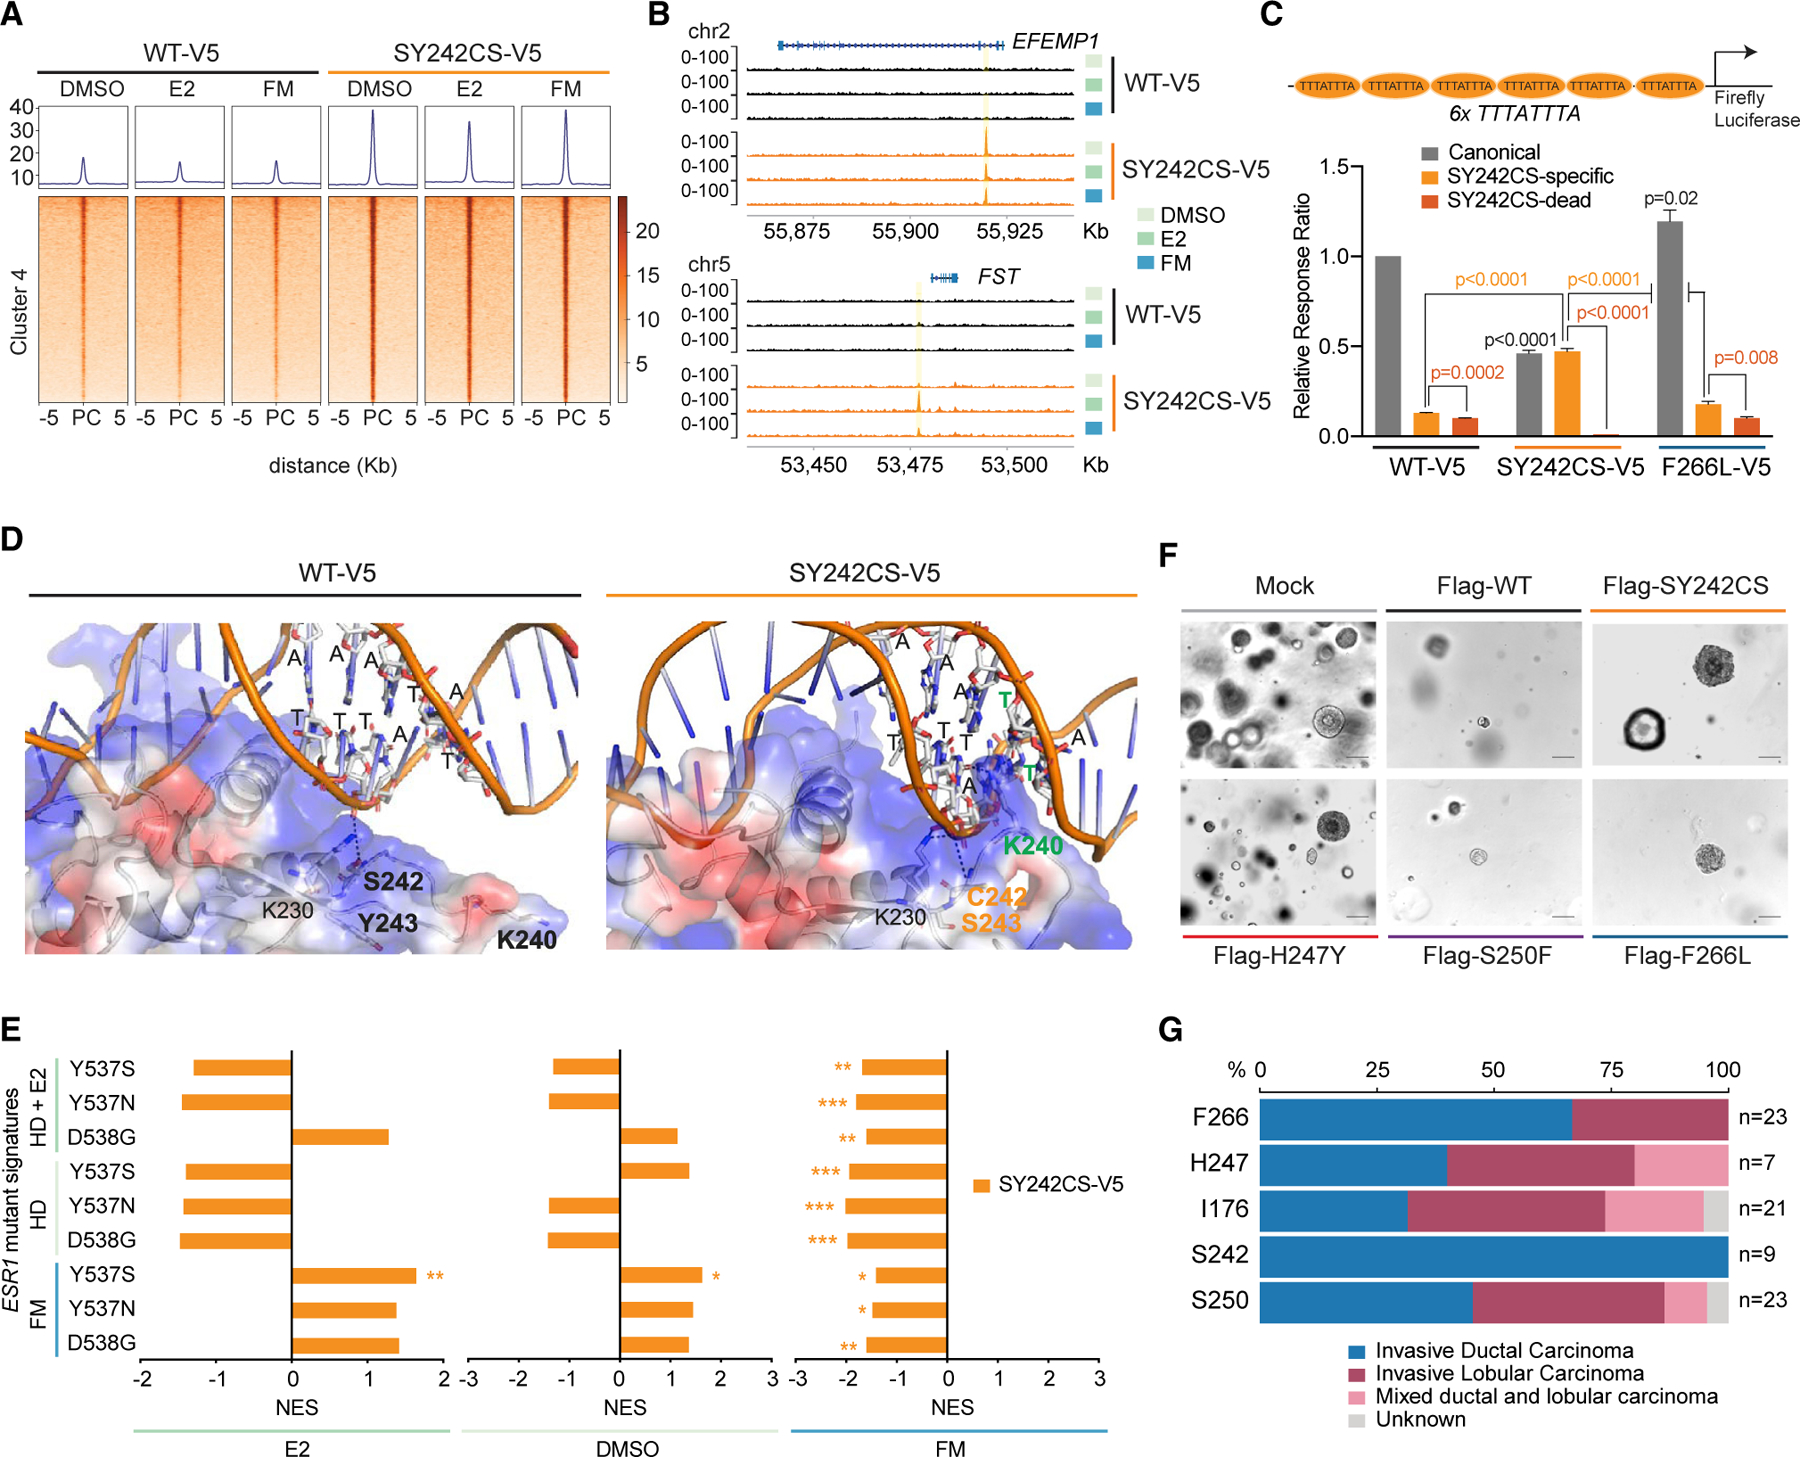
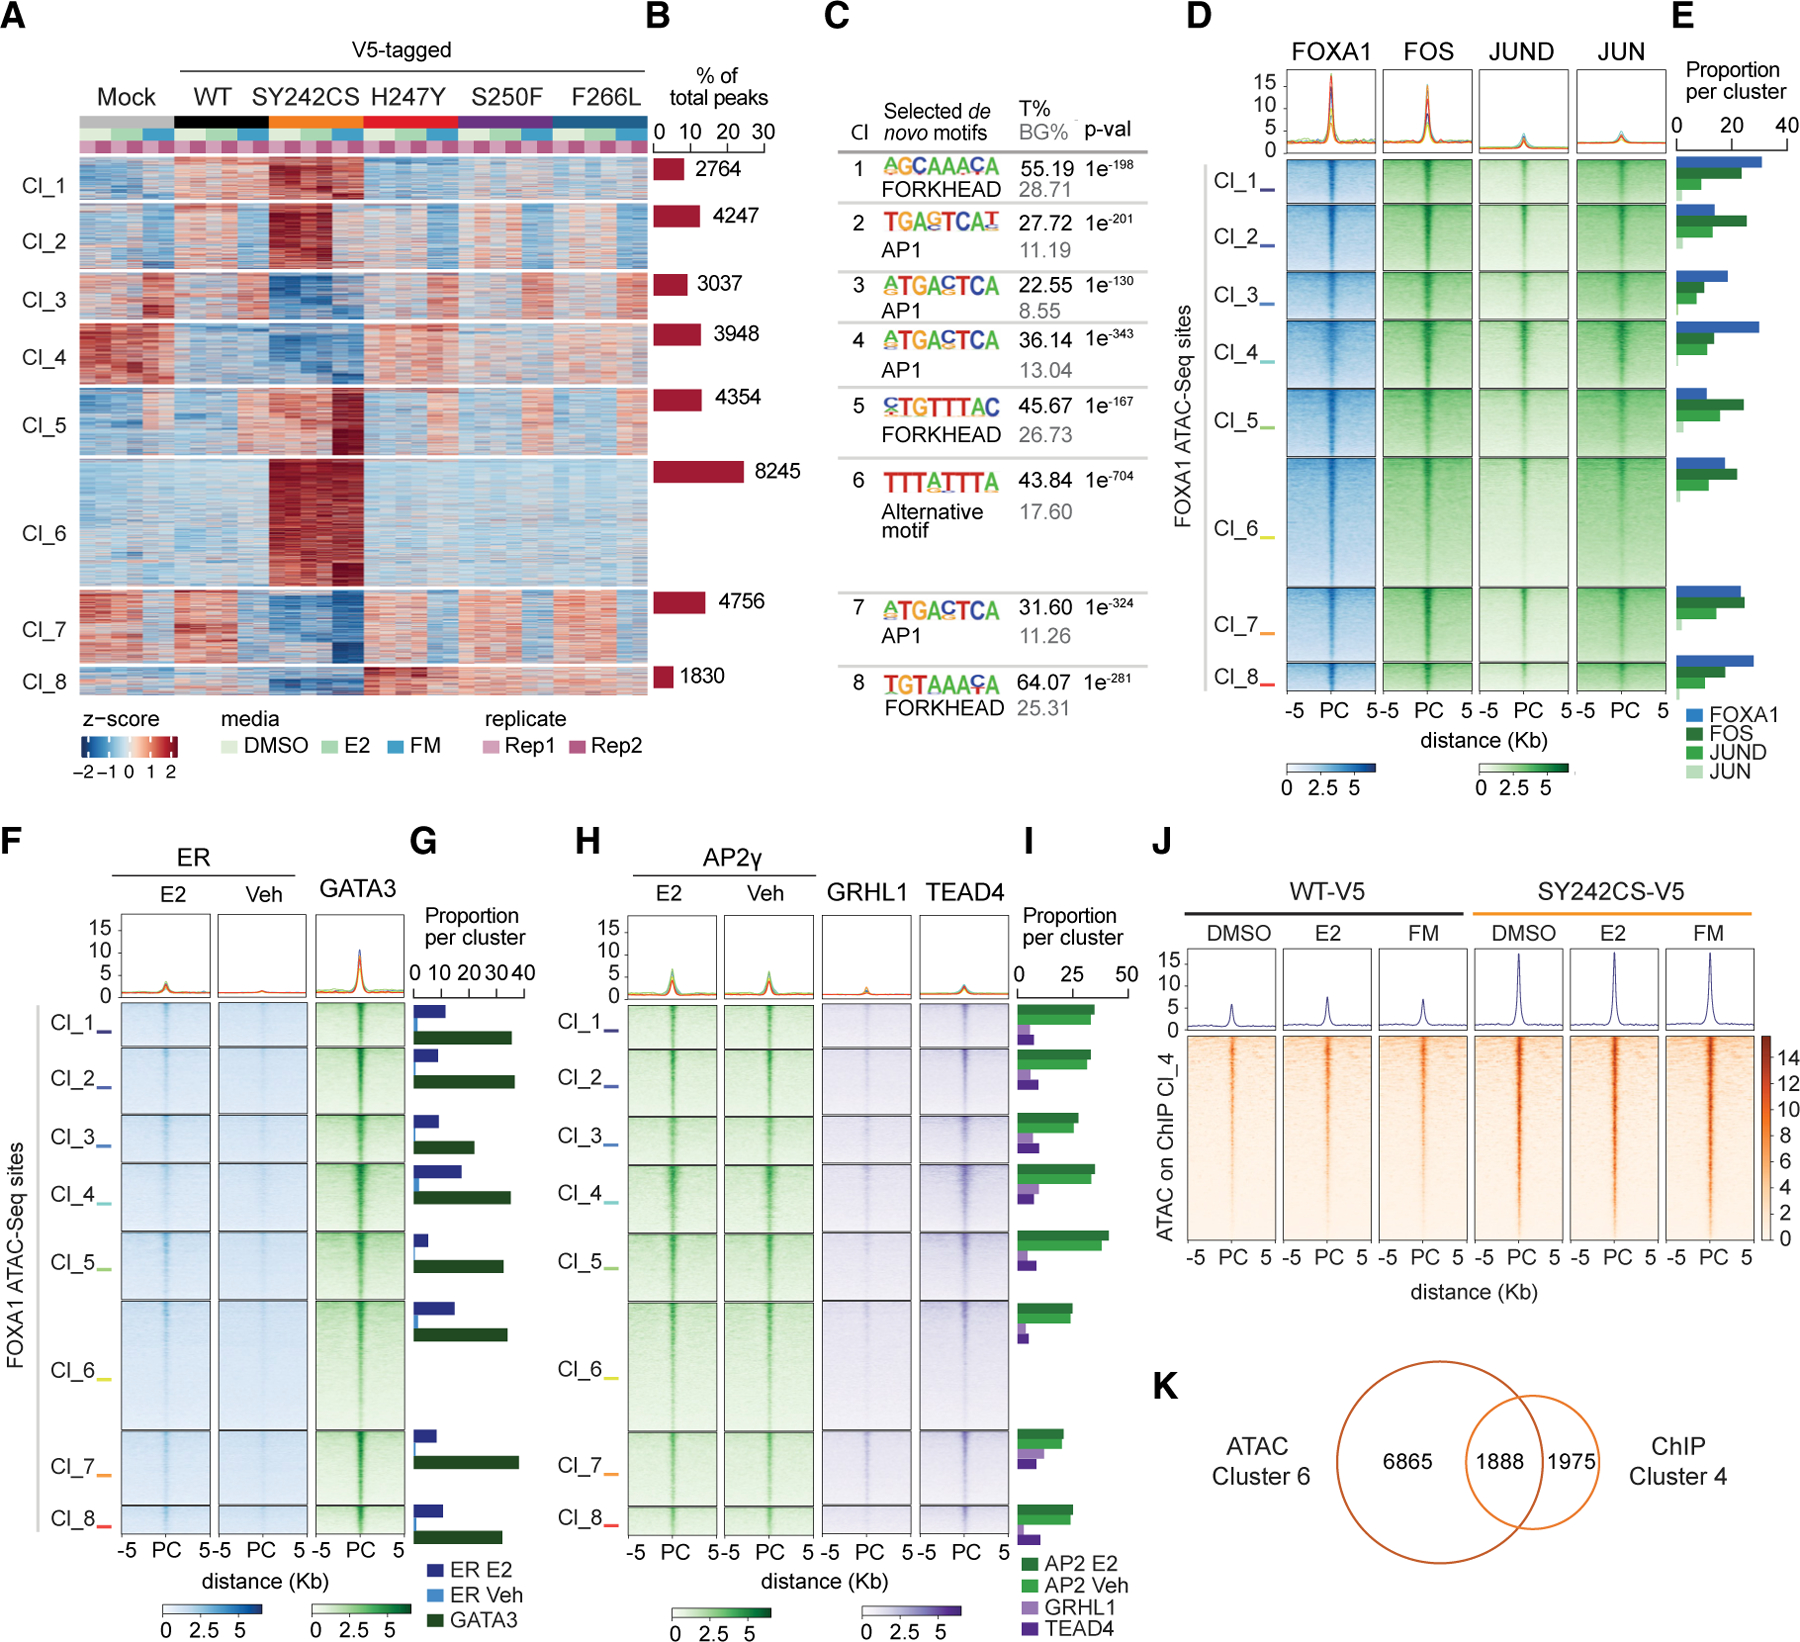
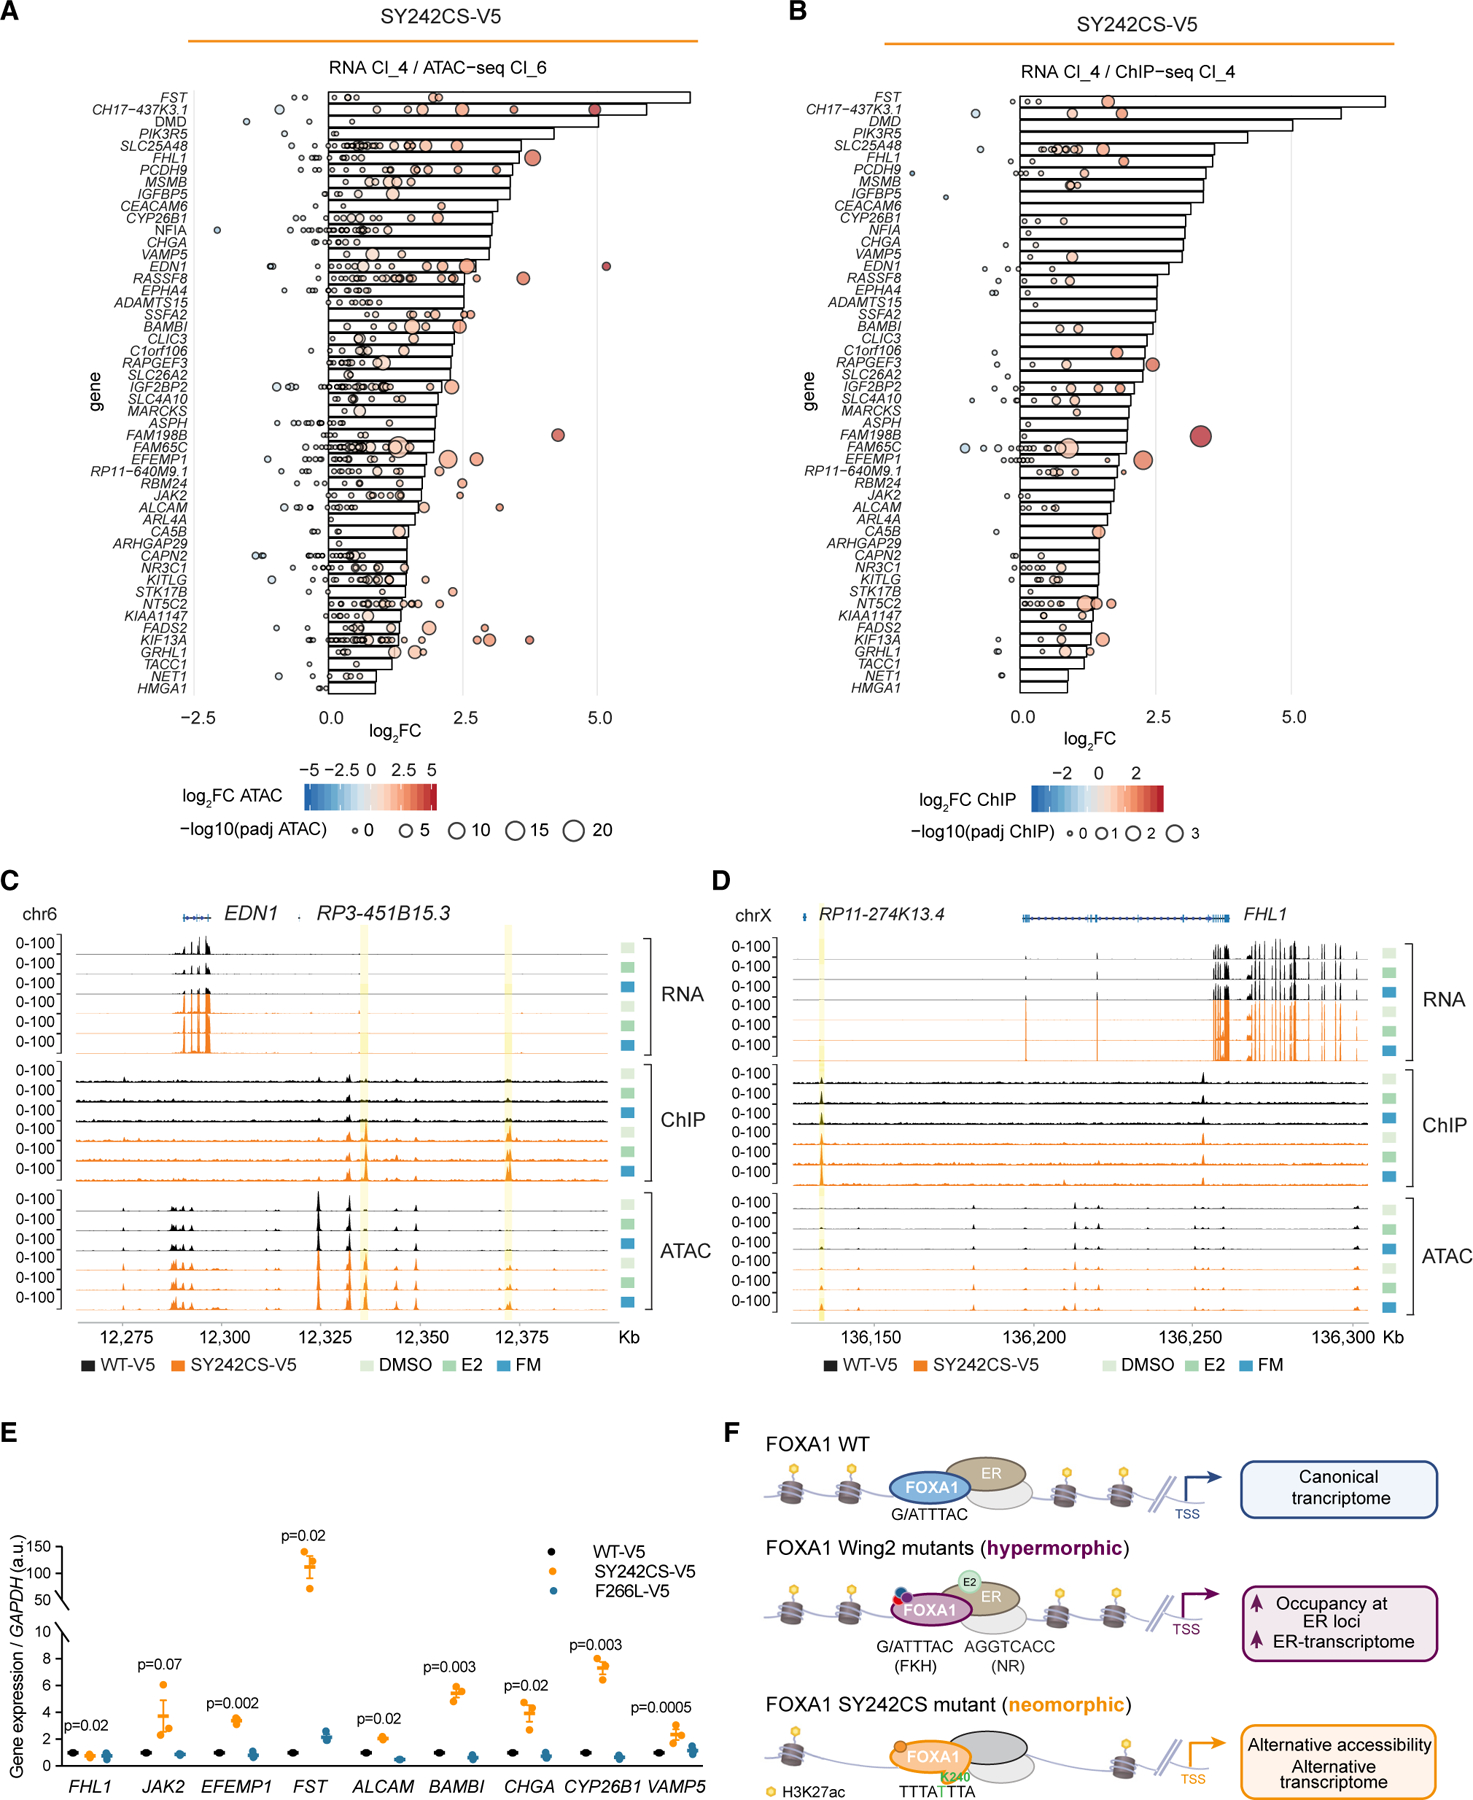
Mutations in the pioneer transcription factor FOXA1 are a hallmark of estrogen receptor-positive (ER+) breast cancers. Examining FOXA1 in ∼5,000 breast cancer patients identifies several hotspot mutations in the Wing2 region and a breast cancer-specific mutation SY242CS, located in the third β strand. Using a clinico-genomically curated cohort, together with breast cancer models, we find that FOXA1 mutations associate with a lower response to aromatase inhibitors. Mechanistically, Wing2 mutations display increased chromatin binding at ER loci upon estrogen stimulation, and an enhanced ER-mediated transcription without changes in chromatin accessibility. In contrast, SY242CS shows neomorphic properties that include the ability to open distinct chromatin regions and activate an alternative cistrome and transcriptome. Structural modeling predicts that SY242CS confers a conformational change that mediates stable binding to a non-canonical DNA motif. Taken together, our results provide insights into how FOXA1 mutations perturb its function to dictate cancer progression and therapeutic response.

Keywords: ESR1 mutations; FOXA1 mutations; breast cancer; chromatin accessibility; endocrine therapy; epigenomics; estrogen receptor; pioneer transcription factor; transcription; transcriptomics.


Conflict of interest statement

Declaration of Interests J.L.V.M. is an employee at Inzen Therapeutics. M.Sallaku has received funds from Puma Biotechnology, AstraZeneca, Daiichi-Sankio, Immunomedics, Targimmune, and Menarini Ricerche, is a cofounder of Medendi.org and is on the advisory board of Menarini Ricerche. J.B. is an employee and shareholder of AstraZeneca, Board of Directors member of Foghorn Therapeutics, and is a past board member of Varian Medical Systems, Bristol-Myers Squibb, Grail, Aura Biosciences, and Infinity Pharmaceuticals. He has performed consulting and/or advisory work for Grail, PMV Pharma, ApoGen, Juno, Lilly, Seragon, Novartis, and Northern Biologics. He has stock or other ownership interests in PMV Pharma, Grail, Juno, Varian, Foghorn, Aura, Infinity, ApoGen, as well as Tango and Venthera, of which he is a co-founder. He has previously received Honoraria or Travel Expenses from Roche, Novartis, and Lilly. C.L.S. serves on the board of directors of Novartis, is a co-founder of ORIC Pharm and co-inventor of enzalutamide and apalutamide. He is a science advisor to Agios, Beigene, Blueprint, Column Group, Foghorn, Housey Pharma, Nextech, KSQ, Petra, and PMV. He was a co-founder of Seragon (purchased by Genentech/Roche, 2014). J.S.R.-F. is a consultant of Goldman Sachs and REPARE Therapeutics, a member of the Scientific Advisory Board of VolitionRx and Paige.AI, and an ad hoc member of the Scientific Advisory Board of Ventana Medical Systems, Roche, Genentech, Novartis, and InviCRO. C.S.V. has been the recipient of research grants from Ipsen Pharmaceuticals, MSD International, and Proctor & Gamble. E.T. has received Honoraria from AstraZeneca for invited lectures. P.R. has received consultation fees from Novartis, AstraZeneca, Foundation Medicine and institutional research funds from Grail, Novartis and Illumina. W.R.K. is a patent holder with KNAW, Organoid Technology shared with Hans Clevers.S.Kannan and C.S.V. are founder directors of SiNOPSEE Therapeutics and Aplomex. The other authors declare no competing interests.

Figures

Figure 1.
Figure 1.. FOXA1 Missense Mutations Were Enriched in Metastatic Tumors and Associated with Worse Outcome to Endocrine Therapy
(A) Pie charts representing frequency of FOXA1 alteration types (wild-type [WT], amplification [Amp], mutation [Mut], or both [Amp + Mut] among all breast cancer patients or metastatic tumors; www.cbioportal.com). (B) Lollipop plot depicting distribution of FOXA1 mutations (truncating, missense, and in-frame indels) found in breast cancer patients (www.cbioportal.org) along the protein sequence. (C) 3D structure of the forkhead domain of the FOXA1-DNA complex generated by comparative homology modeling using the crystal structure (PDB: 1VTN) of the forkhead domain of FOXA3-DNA complex as template. Residues of interest mentioned throughout the manuscript are highlighted and labeled in the structure. (D–G) Characterization of FOXA1 mutations from MSK-IMPACT breast cancer cohort (n = 1,918 breast cancer patients) (Razavi et al., 2018). (D) Barplot showing number of mutations per subdomains indicated. W2, Wing2; H1, Helix1; H3-S3, from helix 3 to third β strand. (E) Association of FOXA1 mutant samples with pattern, frequency, and type of genomic alterations of the key breast cancer genes indicated. Genes with alteration frequency >5% are represented. Also shown is the mutual exclusivity (ME) between FOXA1 and ESR1 hotspot mutations as calculated by CoMET (cometExactTest package), and the co-occurrence (CO) between FOXA1 and PIK3CA or CDH1 mutations (Fisher’s exact test). p value as indicated. (F) Frequency of FOXA1 alteration types in primary versus metastatic tumors. Hotspot mutations enrichment calculated by Fisher’s exact test. (G) Kaplan-Meier curves displaying progression-free survival of patients harboring either WT or mutant FOXA1 under aromatase inhibitor treatment. p value as indicated, estimated using Cox proportional hazards model.
Figure 2.
Figure 2.. FOXA1 Wing2 Mutations Provided a Growth Advantage under Estrogen Deprivation
(A) Impact of ectopic expression of V5-tagged FOXA1 variants (SY242CS, S250F, and F266L) on 3D structural interaction of the forkhead domain (FKHD) with DNA. (B and C) Impact of ectopic expression of V5-tagged FOXA1 variants (Y175C, I176V, D226N, C227R, SY242CS, H247Y, S250F, M253K, R262H, and F266L) on protein abundance (B) (representative experiment is shown) and cell number in full medium and under estrogen deprivation in vitro (C) left (n = 4 independent experiments) and right (n = 6 independent experiments) panels, respectively, in MCF7 cell lines. Two-tailed Student’s t test, p values as indicated. (D) Effect of ectopic expression of FOXA1 SY242CS-V5, H247Y-V5, S250F-V5, and F266L-V5 on foci number (left) and foci area (right) compared with WT FOXA1 in MCF7 cells in full medium (left, n = 4 independent experiments as indicated by dots). One-tailed Student’s t test, p values as indicated. (E) Effect of ectopic expression of FOXA1 SY242CS-V5, H247Y-V5, S250F-V5, and F266L-V5 on foci number (left) and foci area (right) as compared with WT FOXA1 in MCF7 cells under estrogen deprivation (n = 7 independent experiments as indicated by dots). One-tailed Student’s t test, p values as indicated. (F) Effect of ectopic expression of FOXA1 SY242CS-V5, H247Y-V5, S250F-V5, and F266L-V5 on anchorage-independent growth upon estrogen deprivation in MCF7 cells (n = 7 independent experiments as indicated by dots). One-tailed Student’s t test, p values as indicated. (G) In vivo xenografts of MCF7 cells expressing exogenous FOXA1 WT-V5, SY242CS-V, and F266L-V5, together with controls cells, under estrogen supplementation (0.72 mg estrogen pellet) (left panel: n = 5 tumors for Mock, SY242CS-V5, and F266L-V5, n = 4 for WT-V5) or upon estrogen pellet removal (right panel: n = 5 per group). Two-tailed Mann-Whitney U test, p values as indicated. Error bars, mean ± SEM.
Figure 3.
Figure 3.. FOXA1 Wing2 Mutations Induced an Enhanced Estrogen Response through Increased Occupancy at ER Loci
(A) Pie plots representing percentages and genomic features of all ChIP-seq peaks and dynamic peaks. (B and C) Heatmap (B) and barplot (C) of k-means clustering of ChIP-seq peaks from FOXA1 mutant (SY242CS-V5, H247Y-V5, S250F-V5, and F266L-V5) and control (WT-V5, WT, and Mock, empty vector) MCF7 cells, representing seven clusters (B) and percentage and number of peaks per cluster (C) under the conditions indicated. Rep1, replicate 1; Rep 2, replicate 2 (n = 2 biological replicates). (D) Table listing selected homer de novo motifs per cluster in (B) Fisher’s exact rest, p value (p-val) as indicated. T%, percentage of target sites; BG%, background percentage; Cl, cluster. (E) Tornado plot representing estrogen-induced FOXA1 binding peaks at cluster 6 for FOXA1 mutant (SY242CS-V5, H247Y-V5, S250F-V5, and F266L-V5) and WT-V5 MCF7 cells. PC, peak center. Average of two biological replicates is represented. (F and G) Tornado plot (F) and barplot (G) showing ChIP-seq peaks and proportions of FOXA1 (ENCODE, ENCSR126YEB) and ER (GEO: GSE59530; Franco et al., 2015) overlap with our FOXA1 ChIP-seq sites in MCF7 cells. PC, peak center. (H) ChIP-seq tracks of FOXA1 in FOXA1 mutant (SY242CS-V5, H247Y-V5, S250F-V5, and F266L-V5) and control MCF7 cells (Mock and WT-V5) at TFF1 and IGFBP4 gene loci at chromosome 21.
Figure 4.
Figure 4.. Wing2 Mutants Drove an Enhanced Estrogen Response
(A) Gene set enrichment analysis (GSEA) plot showing ‘‘Dutertre Estradiol Response 24h Up’’ enriched in RNA-seq from FOXA1 Wing2 mutant cells (H247Y-V5, S250F-V5, and F266L-V5) as compared with FOXA1 WT-V5 cells. RES, running enrichment score, as indicated. False discovery rate (FDR) represents p adjusted value, calculated using the GSEA package. DMSO, estrogen depletion; E2, upon estrogen stimulation; FM, in full medium. (B) Comparison of ESR1 mutant (Y537S, Y537N, and D538G) gene signatures compared with WT ESR1 in hormone-depleted (HD) medium, hormone depleted estrogen induced (HD + E2) and FM, with FOXA1 mutant (H247Y, S250F, and F226L) gene signatures compared with WT FOXA1 under three different media: E2, DMSO, and FM. Adjusted p value calculated using the GSEA package is also shown. *p < 0.05, **p < 0.01, ***p < 0.001. (C and D) Tornado plot (C) and barplot (D) representing ChIP-seq peaks and proportions of WT ER and mutant ER (Jeselsohn et al., 2018; accession no. PRJNA417235) overlap upon vehicle (Veh) or estrogen (E2) induction, with our FOXA1 ChIP-seq sites in MCF7 cells. PC, peak center. (E and F) Tornado plot showing V5-ChIP-seq upregulated peaks in E2 and DMSO conditions in WT-V5-, SY242CS-V5-, and F266L-V5 FOXA1-expressing MCF7 cells. Also shown are the enriched motifs for nuclear receptor (p = 1 3 × 10‒21) and FKH (p = 1 3 × 10‒35) by Fisher’s exact test (n = 1 biological replicate). (G) Tornado plot representing V5-ChIP-seq peak overlap with FOXA1 ChIP-seq cluster 6 from Figure 3B. DMSO, estrogen depletion; E2, upon estrogen stimulation; FM, in full medium.
Figure 5.
Figure 5.. FOXA1 SY242CS-Driven Conformational Changes Led to a Non-canonical DNA Binding Motif, Cistrome, and Transcriptome
(A) Tornado plot showing ChIP-seq peaks of FOXA1 cluster 4 in Figure 3B from MCF7 cells expressing either FOXA1 WT or SY242CS under the conditions indicated. PC, peak center. Average of two biological replicates is represented. (B) ChIP-seq tracks of FOXA1 in either SY242CS-V5 or WT FOXA1 MCF7 cells at EFEMP1 and FST gene loci at chromosome 2 and 5, respectively, under medium condition indicated. (C) Luciferase reporter assay showing activity of FOXA1 variants (WT-V5, SY242CS-V5, and F266L-V5) on canonical forkhead motif (positive control, gray), SY242CS-specific motif (TTTATTTA, light orange) and SY242CS-dead motif (TTTATGTA, dark orange) DNA templates. Firefly luciferase to Renilla luciferase ratio signals normalized to FOXA1 WT signal on canonical forkhead motif reporter are represented. Two-tailed Student’s t test with Welch’s t test for different variance correction, p values as indicated. Error bars, mean ± SEM. (D) 3D structure of the forkhead domain of the FOXA1 SY242CS-DNA (SY242CS-specific motif TTTATTTA) complex generated by comparative homology modeling using the crystal structure (PDB: 1VTN) of the forkhead domain of FOXA3-DNA complex as template. Residues C242 and S243 are highlighted in orange. Residue K240 and thymines involved in interaction are highlighted in green. (E) Comparison of ESR1 mutant (Y537S, Y537N, and D538G) gene signatures compared with WT ESR1 in hormone-depleted (HD) medium, hormone-depleted estrogen-induced (HD + E2) and FM, with FOXA1 mutant (SY242CS) gene signatures compared with WT FOXA1 under three different media: E2, DMSO, and FM. NES, normalized enrichment score, as indicated. Adjusted p value calculated using the GSEA package is also shown. *p < 0.05, **p < 0.01, ***p < 0.001. (F) Representative images of organoid lines overexpressing variants of FOXA1 via the doxycycline-inducible pCW vector 7 days after seeding. Images from a single biological experiment. Scale bar, 100 µm. (G) Stacked barplot representing the histology of tumors harboring FOXA1 mutations from MSK-IMPACT cohort. DMSO, estrogen depletion; E2, upon estrogen stimulation; FM, in full medium.
Figure 6.
Figure 6.. FOXA1 SY242CS Caused Opening of New Loci Enriched for the Non-canonical Motif
(A and B) Heatmap (A), and barplot (B) of k-means clustering of ATAC-seq peaks from FOXA1 mutant (SY242CS-V5, H247Y-V5, S250F-V5, and F266L-V5) and control (WT-V5, WT, and Mock, empty vector) MCF7 cells, representing eight clusters (A) and percentage and number of peaks per cluster (B) under the conditions indicated. Rep1, replicate 1; Rep 2, replicate 2 (n = 2 biological replicates). (C) Table listing selected homer de novo motifs per cluster in (A). Fisher’s exact test, p value (p-val) as indicated. T%, percentage of target sites; BG%, background percentage; Cl, cluster. (D and E) Tornado plot (D) and barplot (E) showing overlap of public ChIP-seq peaks for FOXA1 (ENCODE, ENCSR126YEB) and the subunits conforming AP1 (FOS, ENCSR569XNP; JUN, ENCSR176EXN; JUND, ENCSR000BSU) with gained accessible sites per cluster for FOXA1 ATAC-seq in (A). Quantification of overlapping percentage is represented on the right-hand barplot. (F and G) Tornado plots (F) and barplot (CG showing ChIP-seq peaks of public ChIP-seq data for transcription factors with enriched occupancy at FOXA1 ATAC-seq clusters in (A) (ER [GEO: GSE59530, Franco et al., 2015] and GATA3 [ENCSR000BST]). (H and I) Tornado plots (H) and barplot (I) showing ChIP-seq peaks of public ChIP-seq data for transcription factors with enriched occupancy at FOXA1 ATAC-seq clusters in (A) (AP2gamma [GEO: GSE26741], GRHL1, and TEAD [ENCSR000BUO]). (J) Tornado plot representing chromatin accessibility of peaks in ChIP-seq cluster 4 for FOXA1 SY242CS and WT MCF7 cells under the conditions indicated. (K) Venn diagram depicting overlap of peaks from ChIP-seq cluster 4 (Figure 3A) with enhanced chromatin accessibility represented in ATAC-seq cluster 6. DMSO, estrogen depletion; E2, upon estrogen stimulation; FM, in full medium; PC, peak center.
Figure 7.
Figure 7.. FOXA1 SY242CS Promoted Expression of an Alternative Transcriptome
(A) Waterfall plot showing integration of the top 50 genes with highest mRNA expression for FOXA1 SY242CS-V5, as compared with FOXA1 WT-V5, from RNA-seq cluster 4 (represented in bars) with highest changes in chromatin accessibility from ATAC-seq cluster 6 (left panel, represented in bubbles) in FM. Each bubble represents a peak, size correlating with –log10 (adjusted p value) and color denoting log2 fold change. (B) Waterfall plot showing integration of 50 genes with highest mRNA expression for FOXA1 SY242CS-V5, as compared with FOXA1 WT-V5, from RNA-seq cluster 4 (represented in bars) with highest changes in chromatin binding affinity from ChIP-seq cluster 6 (represented in bubbles) in FM. Each bubble represents a peak, size correlating with –log10 (adjusted p value) and color denoting log2 fold change. (C and D) Genome tracks of FOXA1 from RNA-seq, ChIP-seq, and ATAC-seq in either SY242CS-V5 or WT FOXA1 MCF7 cells at same EDN1 (C) and FHL1 (D) gene loci at chromosome 6, under medium condition indicated. (E) mRNA expression of indicated genes in MCF7 cells expressing FOXA1 variants (WT-V5, SY242CS-V5, and F266K-V5) in FM. Error bars, mean ± SEM. p values as indicated, one-tailed Student’s t test (n = 3 biological replicates). (F) Schematic depicting the different phenotypic groups of FOXA1 mutations uncovered in this study and their transcriptional outcomes, as compared with WT FOXA1. DMSO, estrogen depletion; E2, upon estrogen stimulation; FM, in full medium.

References

    1. Adams EJ, Karthaus WR, Hoover E, Liu D, Gruet A, Zhang Z, Cho H, DiLoreto R, Chhangawala S, Liu Y, et al. (2019). FOXA1 mutations alter pioneering activity, differentiation and prostate cancer phenotypes. Nature 571, 408–412. - PMC - PubMed
    1. Akamatsu S, Takata R, Haiman CA, Takahashi A, Inoue T, Kubo M, Furihata M, Kamatani N, Inazawa J, Chen GK, et al. (2012). Common variants at 11q12, 10q26 and 3p11.2 are associated with prostate cancer susceptibility in Japanese. Nat. Genet 44, 426–429, s421. - PubMed
    1. Amemiya HM, Kundaje A, and Boyle AP (2019). The ENCODE blacklist: identification of problematic regions of the genome. Sci. Rep 9, 9354. - PMC - PubMed
    1. Anders S, Pyl PT, and Huber W (2015). HTSeq‒a Python framework to work with high-throughput sequencing data. Bioinformatics (Oxford, England) 31, 166–169. - PMC - PubMed
    1. Balko JM, Schwarz LJ, Luo N, Estrada MV, Giltnane JM, Davila-Gonzalez D, Wang K, Sanchez V, Dean PT, Combs SE, et al. (2016). Triple-negative breast cancers with amplification of JAK2 at the 9p24 locus demonstrate JAK2-specific dependence. Sci. Transl. Med 8, 334ra353. - PMC - PubMed

Publication types

MeSH terms