Observational Study
. 2020 Nov 2;30(21):4177-4187.e4.
doi: 10.1016/j.cub.2020.08.016. Epub 2020 Sep 3.

Recurrent Processing Drives Perceptual Plasticity

Affiliations
Observational Study

Recurrent Processing Drives Perceptual Plasticity

Ke Jia et al. Curr Biol. .

Abstract

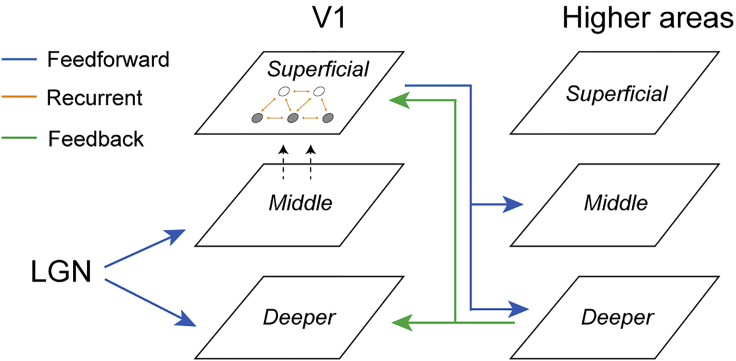
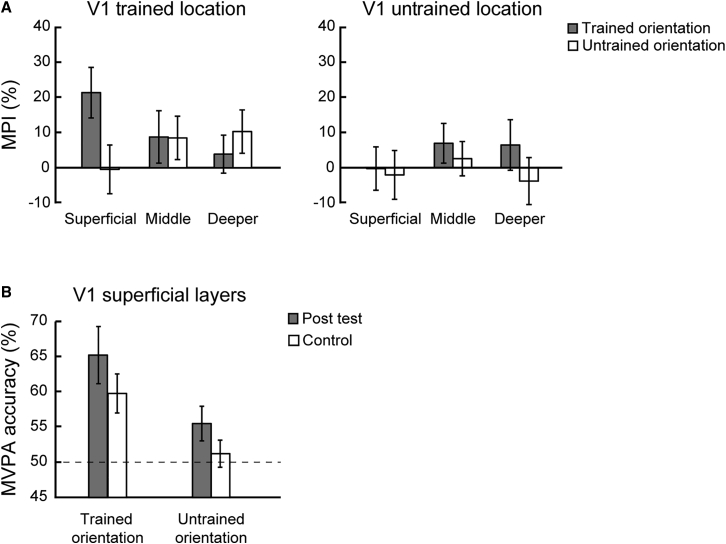
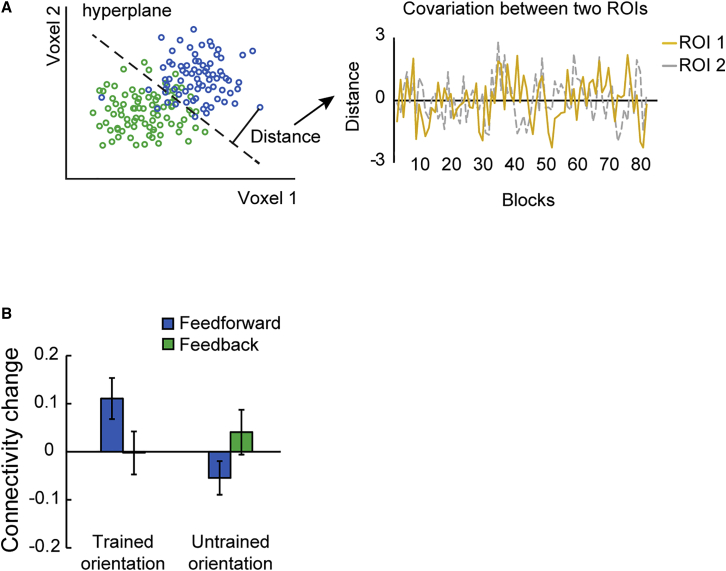
Learning and experience are critical for translating ambiguous sensory information from our environments to perceptual decisions. Yet evidence on how training molds the adult human brain remains controversial, as fMRI at standard resolution does not allow us to discern the finer scale mechanisms that underlie sensory plasticity. Here, we combine ultra-high-field (7T) functional imaging at sub-millimeter resolution with orientation discrimination training to interrogate experience-dependent plasticity across cortical depths that are known to support dissociable brain computations. We demonstrate that learning alters orientation-specific representations in superficial rather than middle or deeper V1 layers, consistent with recurrent plasticity mechanisms via horizontal connections. Further, learning increases feedforward rather than feedback layer-to-layer connectivity in occipito-parietal regions, suggesting that sensory plasticity gates perceptual decisions. Our findings reveal finer scale plasticity mechanisms that re-weight sensory signals to inform improved decisions, bridging the gap between micro- and macro-circuits of experience-dependent plasticity.

Keywords: experience-dependent plasticity; layer-to-layer functional connectivity; learning; perceptual decisions; ultra-high-field brain imaging; visual cortex.


Conflict of interest statement

Declaration of Interests The authors declare no competing interests.

Figures

Figure 1
Figure 1
Laminar Brain Circuits Schematic representation of the hypotheses tested; training may modify (1) feedforward processing (blue arrows) between LGN and V1, (2) recurrent processing via horizontal connections within the visual cortex (horizontal connections [indicated by orange arrows] between excitatory [open circles] and inhibitory [filled circles] neurons, and (3) feedback processing (green arrows) between V1 and higher areas (i.e., V2, V3, V4, and IPS) based on known anatomical circuits.
Figure 2
Figure 2
Experimental Design, Task, and Behavioral Results (A) Experimental design. Participants were trained on an orientation discrimination task with feedback for 5 consecutive days. Before and after training, we measured participant’s performance on the same task without feedback in the lab and during scanning. (B) Orientation discrimination task. For each trial, participants were asked to report whether the second grating was tilted clockwise or counterclockwise relative to the first grating. (C) Mean performance across participants at 79.4% threshold for the training (filled circles) and the control (open circle) sessions. (D) Mean improvement index (MPI) ([pre-test threshold − post-test threshold]/pre-test threshold × 100%) showed learning specificity for the trained compared to the untrained orientation presented at the trained versus untrained location. A two-way repeated-measures ANOVA on MPI (orientation × location) showed a significant interaction (F(1,12) = 14.847; p = 0.002). Post hoc comparisons showed significantly higher improvement for the trained than the untrained (t(12) = 5.564; p < 0.001) orientation at the trained location. In contrast, no significant differences were observed between the trained and the untrained (t(12) = −1.608; p = 0.134) orientations at the untrained location. See Figure S1 for threshold performance before and after training. Error bars indicate standard error of the mean across participants.
Figure 3
Figure 3
fMRI Layer Definition and Vascular Correction (A) Coronal view of the anatomical image of a sample participant. Red inset indicates region of interest in visual cortex. (B) Layers definition map overlaid on an anatomical image (blue, deeper layers; green, middle layers; red, superficial layers). (C) Voxels confounded by vasculature-related effects (highlighted by arrows and in red) overlaid on functional images. (D) BOLD activation map (stimulus versus fixation) overlaid on the anatomical (left panel) and functional data (right panel). (E) Mean normalized BOLD in V1 before and after correction for vasculature-related effects, showing reduced superficial bias after correction. Error bars indicate standard error of the mean across participants. We observed significant interactions (pre-test session: F(2,24) = 50.961, p < 0.001; post-test session: F(2,24) = 36.887, p < 0.001) between layer (superficial, middle, and deeper) and BOLD signal (before versus after correction). The stronger BOLD decrease in upper (i.e., superficial and middle) than deeper layers after correction suggests that our approach for correcting vasculature-related effects controlled substantially for the superficial bias.
Figure 4
Figure 4
MVPA Results before and after Training across V1 Layers MVPA accuracy across V1 layers for the trained and untrained orientations presented at the trained location. Dotted line indicates MVPA accuracy at 50% chance. To further validate our MVPA results, we trained the classifier after shuffling the labels of the training dataset for 5,000 times. This analysis returned accuracies that did not differ significantly (all p > 0.618; false discovery rate [FDR] corrected), suggesting that our MVPA analysis extracted reliable voxel pattern information from the ROIs tested. Error bars indicate standard error of the mean across participants. See Figures S2 and S3 for the univariate and control analyses, respectively.
Figure 5
Figure 5
Learning-Dependent Changes in V1 (A) MPI ([post-test accuracy − pre-test accuracy]/pre-test accuracy × 100%) for the trained and untrained orientations across V1 layers. The left panel shows significantly higher MPI for the trained than the untrained orientation at the trained location in superficial V1 layers (t(12) = 3.218; p = 0.007). The right panel shows no significant differences in MPI across layers for orientations presented at the untrained location. In particular, there was no significant difference in MPI for trained versus untrained orientations in the superficial layers (t(12) = 0.396; p = 0.699). (B) MVPA accuracy for the trained and untrained orientation at the trained location after training (post-test) compared to the control experiment in superficial layers of V1. Dotted line indicates MVPA accuracy at 50% chance. Error bars indicate standard error of the mean across participants. See Figure S4 for learning-dependent changes across visual areas.
Figure 6
Figure 6
Learning-Dependent Changes in IPS MPI across IPS layers for the trained and untrained orientations presented at the trained location. The results showed significantly higher MPI for the trained than the untrained orientation at the trained location in the middle IPS layers (t(12) = 2.861; p = 0.014), but not in superficial (t(12) = −0.695; p = 0.500) or deeper (t(12) = 1.382; p = 0.192) layers. Error bars indicate standard error of the mean across participants.
Figure 7
Figure 7
Informational Connectivity Analysis (A) Schematic illustration of the procedure followed for the MVPA-based functional connectivity analysis. For each ROI and block, we calculated the distance to the classifier hyperplane (indicated by the dotted line) as index of pattern discriminability (left panel). Green and blue dots indicate test patterns from different classes (i.e., trained or untrained versus control orientations). For each ROI, we calculated a time series of distances across blocks during each scanning session. Spearman correlation was used to calculate covariance between time series across ROIs (right panel). (B) Learning-dependent changes (Fisher’s z post- minus pre-test) in functional connectivity between superficial V1 layers and middle IPS layers (feedforward connectivity) and between deeper V1 and IPS layers (feedback connectivity) for the trained and untrained orientations. Error bars indicate standard error of the mean across participants.

Comment in

Similar articles

Cited by

References

    1. Gilbert C.D., Sigman M., Crist R.E. The neural basis of perceptual learning. Neuron. 2001;31:681–697. - PubMed
    1. Gilbert C.D., Li W. Adult visual cortical plasticity. Neuron. 2012;75:250–264. - PMC - PubMed
    1. Hooks B.M., Chen C. Circuitry underlying experience-dependent plasticity in the mouse visual system. Neuron. 2020;106:21–36. - PMC - PubMed
    1. Sagi D., Tanne D. Perceptual learning: learning to see. Curr. Opin. Neurobiol. 1994;4:195–199. - PubMed
    1. Dosher B., Lu Z.-L. Visual perceptual learning and models. Annu. Rev. Vis. Sci. 2017;3:343–363. - PMC - PubMed

Publication types

LinkOut - more resources