. 2020 Sep 3;182(5):1311-1327.e14.
doi: 10.1016/j.cell.2020.07.040.

Mortality Risk Profiling of Staphylococcus aureus Bacteremia by Multi-omic Serum Analysis Reveals Early Predictive and Pathogenic Signatures

Affiliations

Mortality Risk Profiling of Staphylococcus aureus Bacteremia by Multi-omic Serum Analysis Reveals Early Predictive and Pathogenic Signatures

Jacob M Wozniak et al. Cell. .

Abstract

Staphylococcus aureus bacteremia (SaB) causes significant disease in humans, carrying mortality rates of ∼25%. The ability to rapidly predict SaB patient responses and guide personalized treatment regimens could reduce mortality. Here, we present a resource of SaB prognostic biomarkers. Integrating proteomic and metabolomic techniques enabled the identification of >10,000 features from >200 serum samples collected upon clinical presentation. We interrogated the complexity of serum using multiple computational strategies, which provided a comprehensive view of the early host response to infection. Our biomarkers exceed the predictive capabilities of those previously reported, particularly when used in combination. Last, we validated the biological contribution of mortality-associated pathways using a murine model of SaB. Our findings represent a starting point for the development of a prognostic test for identifying high-risk patients at a time early enough to trigger intensive monitoring and interventions.

Keywords: Staphylococcus aureus; bacteremia; biomarkers; host-pathogen interaction; infectious disease; metabolomics; post-translational modifications; proteomics.


Conflict of interest statement

Declaration of Interests G.S. has received speaking honoraria from Allergan and Melinta Pharmaceuticals and consulting fees from Allergan and Paratek Pharmaceuticals

Figures
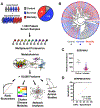
Figure 1
Figure 1. Multi-omic Analysis of SaB Patient Serum.
(A) Workflow for SaB serum analysis. (B) Hierarchical clustering (Pearson) for proteins detected across all samples. (C) Abundance of SERPINA5 in control (gray: NN and HN) and infected samples (blue: HS; red: HM). (D) ROC curve of SERPINA5 (control vs. infected).
Figure 2
Figure 2. Definition of High-confidence Biomarkers for the Prediction of SaB Patient Mortality.
(A) Top 25 EFS proteins (survival vs. mortality; ER_RF - error-rate based, Gini_RF - Gini index random forests). (B) Abundance and ROC curve of Fetuin B (survival vs. mortality). (C) Abundance and ROC curve of SVEP1 (survival vs. mortality). (D) Top 25 EFS metabolites (survival vs. mortality). (E) Abundance and ROC curve of metabolite ID-349 (survival vs. mortality). (F) Abundance and ROC curve of metabolite ID-854 (survival vs. mortality). (G) Dual-omic ROC curve (survival vs. mortality; Protein: FETUB; Metabolite: ID-349; Combo: FETUB + IGFBP3 + ID-349 + ID-854). (H) ELISA abundance and ROC curve of Fetuin B (survival vs. mortality). (I) Survival curves of Fetuin B high (>2.2 μg/ml) and low (<2.2 μg/ml) patients. (J) Metadata assessment of Fetuin B. For B, C, E and F, Kruskal-Wallis tests with Dunn’s multiple comparison test significance is displayed. For H, MWU tests significance is displayed.
Figure 3
Figure 3. PTM-tolerant Analysis of SaB Patient Serum.
(A) Pie chart of networked MS2 spectra. (B) Network edge histogram with top mass shifts highlighted. (C) Percent of MS2 spectra matched in both workflows. (D) Correlation of network edges and PTMs detected in PTM-tolerant workflow. (E) Abundance and ROC curve of AHSG N156 HexNAc(4)Hex(5)NeuAc(2) (control vs. infected). (F) Abundance and ROC curve of AHSG N156 HexNAc(4)Hex(5)NeuAc(1) (survival vs. mortality). (G) Fold-changes of total AHSG protein and glycosylations of N156 for infection and mortality samples. (H) Multi-omic ROC curve (survival vs. mortality). (I) Abundance of modified peptides assigned to the mortality-specific cluster. (J) Distribution of peptide counts and modifications types of albumin (ALB) and serotransferrin (TF). (K) Albumin mortality associated PTM plot depicting modified peptide abundance (left) and modified peptide abundance normalized to protein levels (right). For E and F, Kruskal-Wallis tests with Dunn’s multiple comparison test significance is displayed.
Figure 4
Figure 4. Clustering of Proteomics/Metabolomics Data into Disease-relevant Modules.
(A) K means clustered heatmap, (B) protein association network, and (C) module cross-talk network of all significantly altered proteins (ANOVA p<0.05) across the four primary groups. In B and C, nodes are colored as in A. (D) K means clustered heatmap, (E) molecular networking overview, (F) within network co-regulation pie chart, and (G) module cross-talk network of all significantly altered metabolites (ANOVA p<0.05) across the four primary groups. In E and G, nodes are colored as in D.
Figure 5
Figure 5. Detection of Metabolic Dysfunction in SaB Mortality Patients.
Abundance of IGFBP (A) binary and (B) ternary complex members. (C) Abundance of IGFI and II. (D) Correlation matrix of IGF-related proteins. (E) Heatmap of apolipoprotein abundance. (F) Abundance of thyroxine-binding serum proteins. (G) Molecular network and (H) abundance of acyl-carnitines. In G and H, nodes and points are colored according to Fig 4D. In G, nodes are sized according to ANOVA −log10(p-value). For A, B, C and F, ANOVA with Tukey’s multiple comparison test significance is displayed. For E and H, repeated measures one-way ANOVA with Holms-Sidak’s multiple comparison test significance is displayed.
Figure 6
Figure 6. Knowledge-based Analysis of Cytokines Predicts Major Contributors to Proteomic Alterations and Identifies Core of Modulated Proteins.
(A) Schematic for cytokine inference analysis. (B) Correlation of the cytokine inference score and IPA upstream regulator analysis score. The Core-5 cytokines are highlighted according to their inflammatory actions (red – pro-inflammatory; blue – anti-inflammatory). (C) Edges between the Core-5 cytokines and each mortality-associated K-means cluster as determined by STRING-db. (D) Refined network of Core-5 cytokines and pMortality+ proteins. Protein nodes are sized according to −log10(p-value) determined via ANOVA and highlighted based their connections to pro-inflammatory cytokines (red), anti-inflammatory cytokines (blue) or both (purple). Cytokine node outlines and neighboring edges are colored based on pro-inflammatory (red) or anti-inflammatory (blue) activity. In A and C, heatmap, nodes and bars are colored as in Fig 4A.
Figure 7
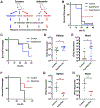
Figure 7. Thyroid and Adiponectin Signaling Contribute to SaB Mortality in vivo.
(A) Schematic for treatment plan and mouse model of SaB. (B) Survival curve of mice given hyperthyroid, hypothyroid or control treatments then infected. (C) Survival curve of mice given hypothyroid or control treatments then infected. CFUs recovered from the kidney (D) and heart (E) in hypothyroid or control mice 48 hrs after infection. (F) Survival curve of mice given AdipoRon or control treatments then infected. CFUs recovered from the spleen (G) and heart (H) in AdipoRon or control mice 48 hrs after infection. All infections were with 5×10⁷ CFU S. aureus except for panel B (1×10⁸ CFU). For D, E, G, and H, MWU test significance is displayed.

References

    1. Achari AE, and Jain SK (2017). Adiponectin, a Therapeutic Target for Obesity, Diabetes, and Endothelial Dysfunction. Int J Mol Sci 18. - PMC - PubMed
    1. Al-Abed Y, Metz CN, Cheng KF, Aljabari B, VanPatten S, Blau S, Lee H, Ochani M, Pavlov VA, Coleman T, et al. (2011). Thyroxine is a potential endogenous antagonist of macrophage migration inhibitory factor (MIF) activity. Proc Natl Acad Sci U S A 108, 8224–8227. - PMC - PubMed
    1. Alobaidi R, Basu RK, Goldstein SL, and Bagshaw SM (2015). Sepsis-associated acute kidney injury. Semin Nephrol 35, 2–11. - PMC - PubMed
    1. Baxter RC (2014). IGF binding proteins in cancer: mechanistic and clinical insights. Nat Rev Cancer 14, 329–341. - PubMed
    1. Bello G, Pennisi MA, Montini L, Silva S, Maviglia R, Cavallaro F, Bianchi A, De Marinis L, and Antonelli M (2009). Nonthyroidal illness syndrome and prolonged mechanical ventilation in patients admitted to the ICU. Chest 135, 1448–1454. - PubMed

Publication types