. 2021 Jan 21;28(1):46-59.e7.
doi: 10.1016/j.chembiol.2020.08.012. Epub 2020 Sep 3.

Proteostasis Regulators Restore Function of Epilepsy-Associated GABAA Receptors

Affiliations

Proteostasis Regulators Restore Function of Epilepsy-Associated GABAA Receptors

Xiao-Jing Di et al. Cell Chem Biol. .

Abstract

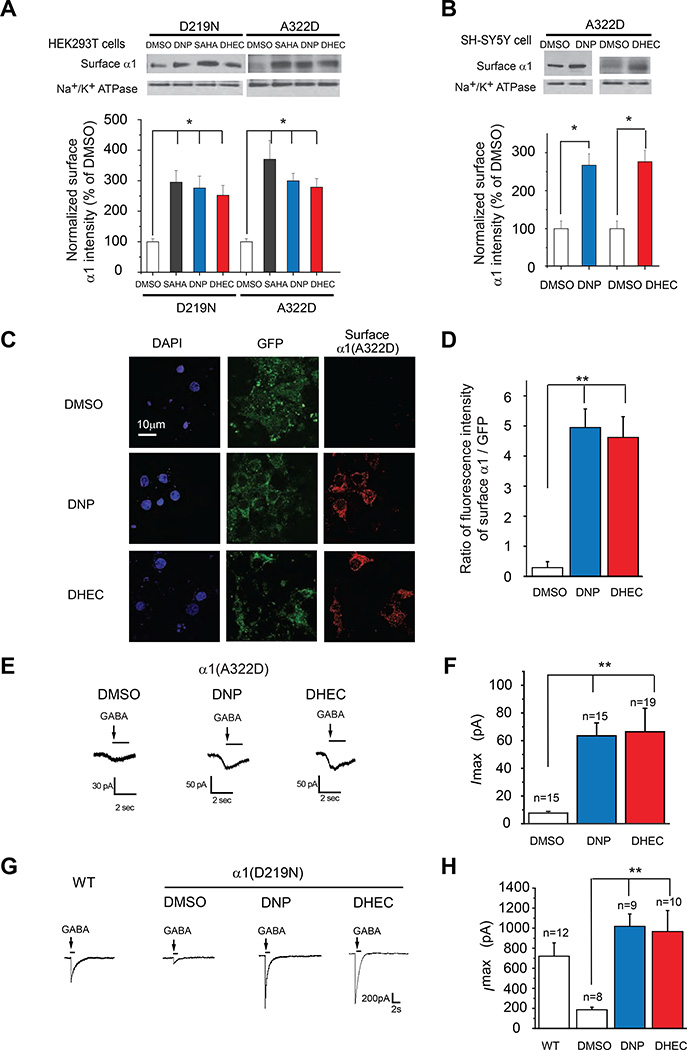
Proteostasis deficiency in mutated ion channels leads to a variety of ion channel diseases that are caused by excessive endoplasmic reticulum-associated degradation (ERAD) and inefficient membrane trafficking. We investigated proteostasis maintenance of γ-aminobutyric acid type A (GABAA) receptors, the primary mediators of neuronal inhibition in the mammalian central nervous system. We screened a structurally diverse, Food and Drug Administration-approved drug library and identified dinoprost (DNP) and dihydroergocristine (DHEC) as highly efficacious enhancers of surface expression of four epilepsy-causing trafficking-deficient mutant receptors. Furthermore, DNP and DHEC restore whole-cell and synaptic currents by incorporating mutated subunits into functional receptors. Mechanistic studies revealed that both drugs reduce subunit degradation by attenuating the Grp94/Hrd1/Sel1L/VCP-mediated ERAD pathway and enhance the subunit folding by promoting subunit interactions with major GABAA receptors-interacting chaperones, BiP and calnexin. In summary, we report that DNP and DHEC remodel the endoplasmic reticulum proteostasis network to restore the functional surface expression of mutant GABAA receptors.

Keywords: ERAD; GABA(A) receptors; assembly; chaperone; epilepsy; folding; misfolding; proteostasis; trafficking.


Conflict of interest statement

Declaration of Interests The authors declare no competing interests.

Figures

Figure 1.
Figure 1.. Dinoprost (DNP) and dihydroergocristine (DHEC) increase the total protein level of the α1 subunit variants of GABAA receptors.
(A) Structure of the α1β2γ2 pentameric GABAA receptors from the cryo-EM structure (6D6U.pdb) (Zhu et al., 2018), rendered using PyMOL. The residues of A322 and D219 in one α1 subunit and the residues of R82 and R177 in the γ2 subunit are shown as space filling models and colored in red. (B) The chemical structures of Dinoprost (DNP) and Dihydroergocristine (DHEC). (C,D) Dose-response analysis of DNP, DHEC, and SAHA treatment (24 h) in HEK293T cells expressing α1(A322D)β2γ2 GABAA receptors. (E, F) Time-course study of DNP’s effect (10 μM) (E) and DHEC’s effect (10 μM) (F) on total α1(A322D) subunit (n = 3). IB: immunoblotting. Each data point in (D) (E) and (F) is reported as mean ± SEM. * p < 0.05. See also Figure S1 and Table S1.
Figure 2.
Figure 2.. Both DNP and DHEC promote the functional surface expression of epilepsy-associated mutant α1 subunits.
(A and B) DNP (10 μM, 24 h) or DHEC (10 μM, 24 h) increase the surface protein expression of the α1 subunit in HEK293T cells (A) and neuronal SH-SY5Y cells (B) stably expressing α1(D219N)β2γ2 or α1(A322D)β2γ2 receptors according to surface biotinylation analysis. Quantification of the surface α1 bands intensities were shown on the bottom panels (n = 3). SAHA (2.5 μM, 24 h)-treated cells were used as a positive control. Na+/K+ ATPase serves as a membrane protein loading control. (C and D) Rat primary cortical neurons were transfected with plasmids containing pIRES2-EGFP-Flag-tagged α1(A322D), β2 and γ2 for 7 days before drug treatment for another 24 h. Nucleus staining by DAPI was in blue; transfection control by GFP in green, and surface α1 subunit staining by anti-Flag antibody in red. Representative images are shown from 30–50 cells per condition. Quantification of the ratio of fluorescence intensity of the surface α1(A322D) / GFP is shown in D. (E-H) Treatments with DNP or DHEC increase the peak amplitude of GABA-induced chloride currents in HEK293T cells expressing α1(A322D)β2γ2 (E, F) or α1(D219N)β2γ2 (G, H) receptors. Representative whole-cell voltage-clamping recording traces are shown in E and G. Quantifications of the peak currents (Imax) are shown in F and H. pA: pico Ampere. Each data point in (A) (B) (D) (F) and (H) is reported as mean ± SEM. * p < 0.05; ** p < 0.01.
Figure 3.
Figure 3.. Both DNP and DHEC inhibit the ERAD of misfolding-prone α1(A322D) subunits.
(A) DNP and DHEC do not change the mRNA level of the α1(A322D) subunit according to quantitative RT-PCR analysis (n = 9). SAHA (2.5 μM, 24 h) treated cells were used as a positive control. (B, C) DNP (10 μM, 24 h) and DHEC (10 μM, 24 h) decrease the degradation rate of the α1 subunit in HEK293T cells stably expressing α1(A322D)β2γ2 receptors using cycloheximide (CHX)-chase analysis. (D, E) DNP or DHEC decreases the protein level of Hrd1 and Sel1L among the tested ERAD factors in HEK293T cells stably expressing α1(A322D)β2γ2 receptors (n = 3) (F, G) DNP or DHEC decrease ubiquitinated α1(A322D) subunit and the interactions between Grp94, Hrd1, or VCP and the α1(A322D) subunit in HEK293T cells stably expressing FLAG-α1(A322D)β2γ2 receptors (n = 3). The IgG serves as a negative control. IP: immunoprecipitation. Quantification of the ratio between Grp94, Hrd1, VCP, or ubiquitin and α1 band intensity post IP is shown in (G). (H) Effect of DNP and DHEC on the protein stability of Sel1L in HEK293T cells expressing α1(A322D)β2γ2 receptors according to CHX-chase analysis. Quantification of the remaining Sel1L was shown on the bottom. (I) Effect of DNP or DHEC on the mRNA levels of Hrd1 and Sel1L according to quantitative RT-PCR analysis (n = 9). (J, K) Effect of Sel1L knockdown on the interactions between the α1(A322D) subunit and its proteostasis network components, including ERAD factors Grp94 and VCP (J) and folding factors BiP and calnexin and β2 subunits of GABAA receptors (K) using HEK293T cells stably expressing FLAG-α1(A322D)β2γ2 receptors. Quantification of the ratio between selected proteins and α1 band intensity post IP is shown on the bottom (n = 3). Each data point in (A-C), (E) and (G-K) is reported as mean ± SEM. * p < 0.05.
Figure 4.
Figure 4.. Both DNP and DHEC promote the folding and forward trafficking of misfolding-prone α1(A322D) subunits.
(A, B) DNP or DHEC decrease the NP-40 (1%) insoluble protein level of the α1(A322D) subunits in HEK293T cells expressing α1(A322D)β2γ2 receptors (n = 3). Quantification is shown in (B). (C, D) DNP or DHEC increases the interaction between α1(A322D) subunits and BiP/calnexin in HEK293T cells expressing α1(A322Dβ2γ2 receptors (n = 3). Quantification of the ratio between α1(A322D) and BiP/calnexin post IP is shown in the bottom panels. (E, F) DNP or DHEC increases the interaction between Flag-β2 and the α1(A322D) subunits in HEK293T cells expressing α1(A322D)(Flag-β2)γ2 receptors (n = 3). Quantification of the ratio between Flag and α1 band intensity post IP is shown in (F). (G, H) DNP or DHEC increases the endo H-resistant post-ER glycoform of the α1 subunit in HEK293 cells stably expressing α1(A322D)β2γ2 receptors (n = 3). PNGase F treatment serves as a control for unglycosylated α1 subunit. Quantifications of the ratio of endo H-resistant / total α1 subunit bands are shown in (H).
Figure 5.
Figure 5.. DNP- or DHEC- induced changes in IPSC peak current and decay times.
(A) IPSCs mediated by wild type α1β2γ2 GABAA receptors. (B) IPSCs mediated by cells transfected with α1(D219N), β2 and γ2 subunits. (C) IPSCs mediated by cells transfected with α1, β2 and γ2(R177G) subunits. (D) IPSCs mediated by cells transfected with α1, β2 and γ2(R82Q) subunits. (E) Group bar plots showing changes in IPSC peak amplitude for the indicated GABAA receptors. (F) Group bar plots showing changes in IPSC decay times for the indicated GABAA receptors. For all panels, Control, drug naïve cells (CNT, black, left), cells that were incubated with DNP (DNP, blue, middle), and cells that were incubated with DHEC (DHEC, red, right). Asterisks represent p values for the post-hoc comparisons of a two-way ANOVA with and without drug exposure, where * p < 0.05, ** p < 0.01, *** p < 0.005. Number signs represent the p values for a one-way ANOVA without drug exposure, where ## p < 0.01 and #### p < 0.0001. ANOVAs are always compared to α1β2γ2 receptors. See also Figure S2.
Figure 6.
Figure 6.. DNP- or DHEC- induced changes in IPSC pharmacology.
(A) IPSCs mediated by wild type α1β2γ2 receptors. (B) IPSCs mediated by cells transfected with α1(D219N), β2 and γ2 subunits. (C) IPSCs mediated by cells transfected with α1, β2 and γ2(R177G) subunits. (D) IPSCs mediated by cells transfected with α1, β2 and γ2(R82Q) subunits. (E) Group bar plots showing diazepam enhancement of IPSC peak amplitude for the indicated GABAA receptors. (F) Group bar plots showing diazepam enhancement of IPSC decay times for the indicated GABAA receptors. (G) Group bar plots showing Zn2+ inhibition of IPSC peak amplitude for the indicated GABAA receptors. For panels in (A) (C) (D), Control, DNP naïve cells (CNT, black, left), cells that were incubated with DNP (DNP, blue, middle), and cells that were incubated with DHEC (DHEC, red, right). For panels in (B), Control, DNP naïve cells (CNT, black, left), and cells that were incubated with DNP (10 μM, 24 h, DNP, blue, right). Asterisks represent p values for the post-hoc comparisons of a two-way ANOVA with and without drug exposure, where * p < 0.05, ** p < 0.01, *** p < 0.005, **** p < 0.001. Number signs represent the p values for a one-way ANOVA without drug exposure, where ## p < 0.01 and #### p < 0.0001. ANOVAs are always compared to α1β2γ2 receptors.
Figure 7.
Figure 7.. General effect of DNP and DHEC on ERAD substrates.
(A) Effect of co-application of DNP, DHEC, and SAHA (2.5 μM) on total α1(A322D) protein levels in HEK293T cells. Quantifications of the normalized α1(A322D) band intensities are shown on the right (n = 4). (B) Effect of DNP (10 μM, 24h) and DHEC (10 μM, 24h) on L444P β-glucocerebrosidase (GC) protein levels in patient-derived skin fibroblasts harboring mutant L444P GC. MG-132 (0.25 μM, 24h) was used as a positive control. Quantifications of the normalized GC band intensities are shown on the bottom (n = 4). (C) Effect of DNP and DHEC on L444P GC maturation. Quantifications of the ratio of endo H-resistant / total GC bands are shown on the bottom (n = 3). (D, E) Effect of DNP and DHEC on ERAD substrates, the null Hong-Kong variant of α1-antitrypsin (NHK) and a mutant of ribophorin I (RI332). HEK293T cells were transiently transfected with HA-tagged NHK (D) or HA-tagged RI332 (E) and treated with DNP (10 μM), or DHEC (10 μM). Quantifications of the normalized ERAD substrate band intensities are shown on the bottom (n = 4). Each data point in (A – E) is reported as mean ± SEM. * p < 0.05. (F) Proposed mechanism of action of DNP and DHEC on GABAA receptor proteostasis. DNP and DHEC (PRs, proteostasis regulators) attenuate the ERAD of mutant GABAA receptor subunits by decreasing the protein levels of the ubiquitin E3 ligase complex Hrd1/Sel1L and inhibiting their interactions with Grp94 and VCP. In addition, DNP and DHEC enhance the interactions between mutant subunits and pro-folding chaperones BiP and calnexin to promote their productive folding. Enhanced folding and reduced ERAD of mutant GABAA receptor subunits lead to their enhanced receptor assembly and trafficking to the plasma membrane.

Similar articles

Cited by

References

    1. Allen AS, Berkovic SF, Cossette P, Delanty N, Dlugos D, Eichler EE, Epstein MP, Glauser T, Goldstein DB, Han Y, et al. (2013). De novo mutations in epileptic encephalopathies. Nature 501, 217–221. - PMC - PubMed
    1. Angelotti TP, and Macdonald RL (1993). Assembly of GABAA receptor subunits: alpha 1 beta 1 and alpha 1 beta 1 gamma 2S subunits produce unique ion channels with dissimilar single-channel properties. J Neurosci 13, 1429–1440. - PMC - PubMed
    1. Balch WE, Morimoto RI, Dillin A, and Kelly JW (2008). Adapting proteostasis for disease intervention. Science 319, 916–919. - PubMed
    1. Bell WR, and Wentz AC (1973). Abortion and coagulation by prostaglandin. Intra-amniotic dinoprost tromethamine effect on the coagulation and fibrinolytic systems. Jama 225, 1082–1084. - PubMed
    1. Britton S, Dernoncourt E, Delteil C, Froment C, Schiltz O, Salles B, Frit P, and Calsou P (2014). DNA damage triggers SAF-A and RNA biogenesis factors exclusion from chromatin coupled to R-loops removal. Nucleic acids research 42, 9047–9062. - PMC - PubMed

Publication types