

Identifying controllable cortical neural markers with machine learning for adaptive deep brain stimulation in Parkinson's disease
- PMID: 32889400
- PMCID: PMC7479445
- DOI: 10.1016/j.nicl.2020.102376
Identifying controllable cortical neural markers with machine learning for adaptive deep brain stimulation in Parkinson's disease
Abstract
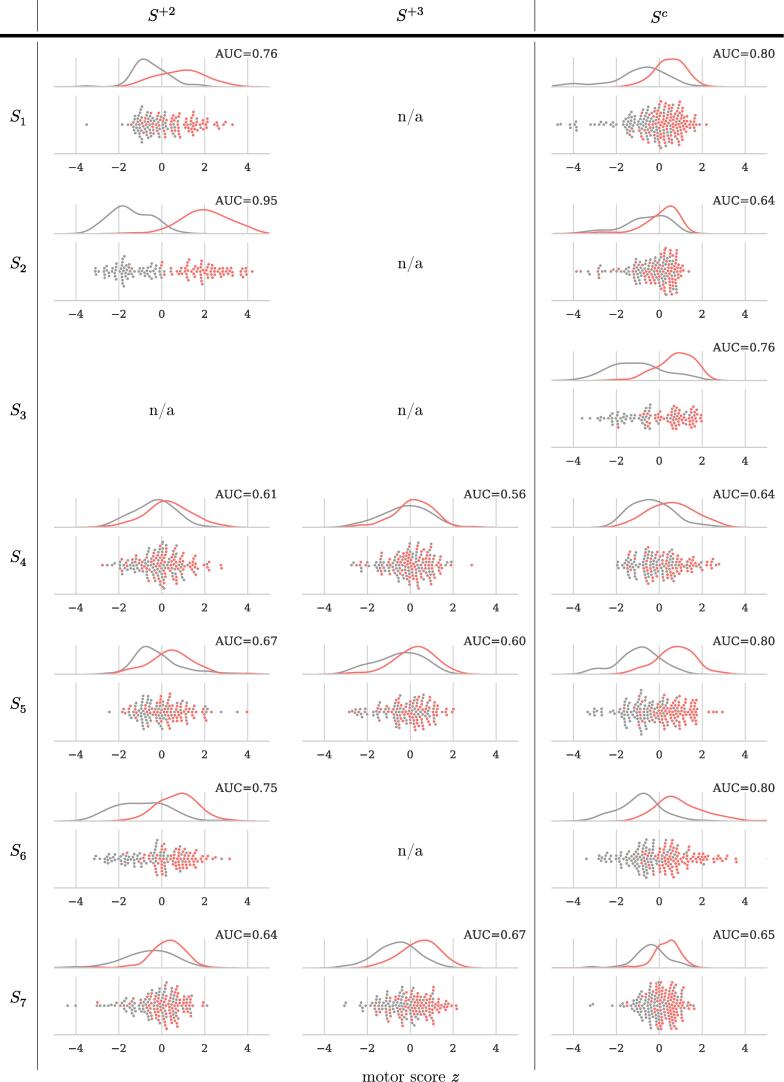
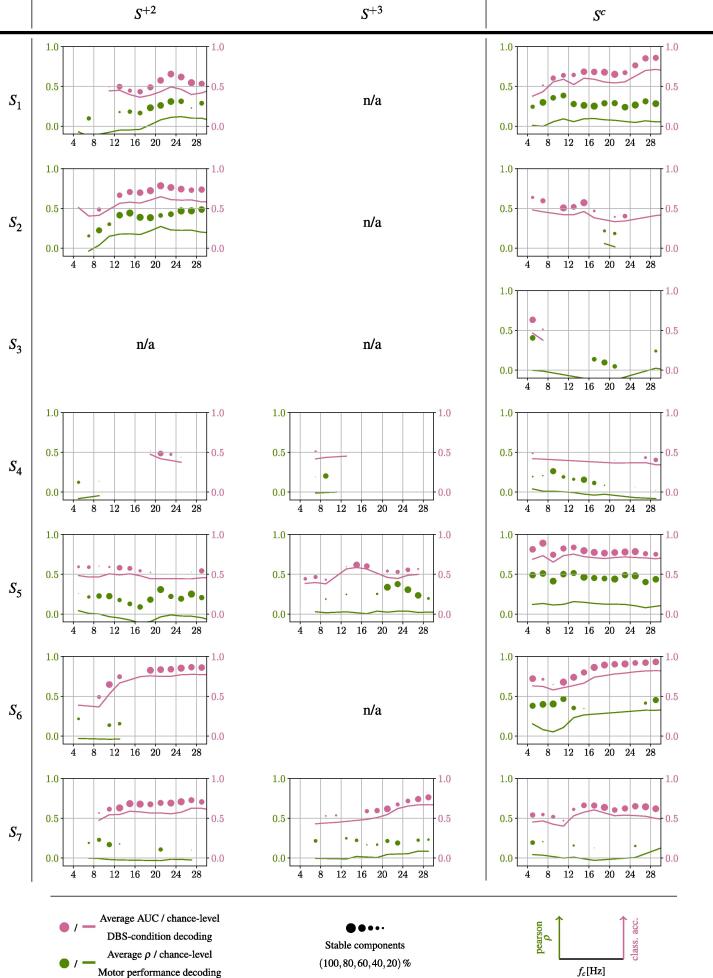
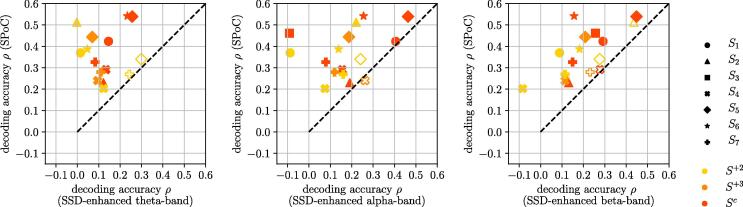
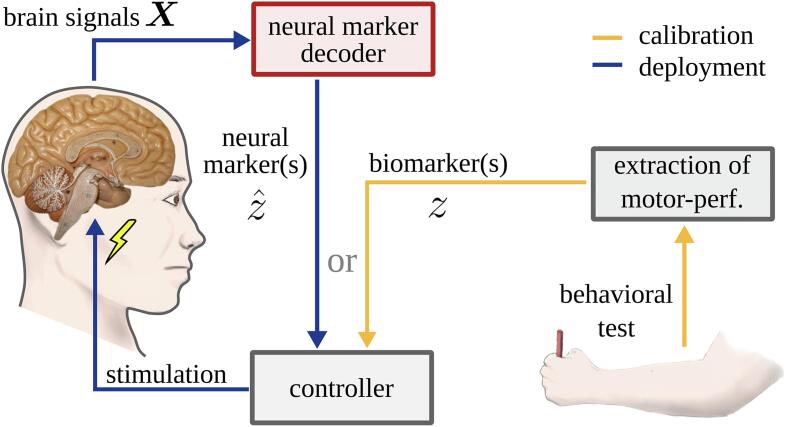
The identification of oscillatory neural markers of Parkinson's disease (PD) can contribute not only to the understanding of functional mechanisms of the disorder, but may also serve in adaptive deep brain stimulation (DBS) systems. These systems seek online adaptation of stimulation parameters in closed-loop as a function of neural markers, aiming at improving treatment's efficacy and reducing side effects. Typically, the identification of PD neural markers is based on group-level studies. Due to the heterogeneity of symptoms across patients, however, such group-level neural markers, like the beta band power of the subthalamic nucleus, are not present in every patient or not informative about every patient's motor state. Instead, individual neural markers may be preferable for providing a personalized solution for the adaptation of stimulation parameters. Fortunately, data-driven bottom-up approaches based on machine learning may be utilized. These approaches have been developed and applied successfully in the field of brain-computer interfaces with the goal of providing individuals with means of communication and control. In our contribution, we present results obtained with a novel supervised data-driven identification of neural markers of hand motor performance based on a supervised machine learning model. Data of 16 experimental sessions obtained from seven PD patients undergoing DBS therapy show that the supervised patient-specific neural markers provide improved decoding accuracy of hand motor performance, compared to group-level neural markers reported in the literature. We observed that the individual markers are sensitive to DBS therapy and thus, may represent controllable variables in an adaptive DBS system.
Keywords: Adaptive deep brain stimulation; Brain-computer interface; Deep brain stimulation; Machine learning; Neural marker.
Copyright © 2020 The Authors. Published by Elsevier Inc. All rights reserved.
Conflict of interest statement
The authors declare that they have no known competing financial interests or personal relationships that could have appeared to influence the work reported in this paper.
Figures
Similar articles
-
Prediction of mild parkinsonism revealed by neural oscillatory changes and machine learning.J Neurophysiol. 2020 Dec 1;124(6):1698-1705. doi: 10.1152/jn.00534.2020. Epub 2020 Oct 14. J Neurophysiol. 2020. PMID: 33052766 Free PMC article.
-
LFP-Net: A deep learning framework to recognize human behavioral activities using brain STN-LFP signals.J Neurosci Methods. 2020 Apr 1;335:108621. doi: 10.1016/j.jneumeth.2020.108621. Epub 2020 Feb 3. J Neurosci Methods. 2020. PMID: 32027889
-
Cortical Plasticity Induction by Pairing Subthalamic Nucleus Deep-Brain Stimulation and Primary Motor Cortical Transcranial Magnetic Stimulation in Parkinson's Disease.J Neurosci. 2016 Jan 13;36(2):396-404. doi: 10.1523/JNEUROSCI.2499-15.2016. J Neurosci. 2016. PMID: 26758832 Free PMC article.
-
Machine learning for adaptive deep brain stimulation in Parkinson's disease: closing the loop.J Neurol. 2023 Nov;270(11):5313-5326. doi: 10.1007/s00415-023-11873-1. Epub 2023 Aug 2. J Neurol. 2023. PMID: 37530789 Free PMC article. Review.
-
Congress of Neurological Surgeons Systematic Review and Evidence-Based Guideline on Subthalamic Nucleus and Globus Pallidus Internus Deep Brain Stimulation for the Treatment of Patients With Parkinson's Disease: Executive Summary.Neurosurgery. 2018 Jun 1;82(6):753-756. doi: 10.1093/neuros/nyy037. Neurosurgery. 2018. PMID: 29538685 Free PMC article.
Cited by
-
Directionally non-rotating electric field therapy delivered through implanted electrodes as a glioblastoma treatment platform: A proof-of-principle study.Neurooncol Adv. 2024 Jul 13;6(1):vdae121. doi: 10.1093/noajnl/vdae121. eCollection 2024 Jan-Dec. Neurooncol Adv. 2024. PMID: 39156619 Free PMC article.
-
An in-silico framework for modeling optimal control of neural systems.Front Neurosci. 2023 Mar 8;17:1141884. doi: 10.3389/fnins.2023.1141884. eCollection 2023. Front Neurosci. 2023. PMID: 36968496 Free PMC article.
-
On closed-loop brain stimulation systems for improving the quality of life of patients with neurological disorders.Front Hum Neurosci. 2023 Mar 23;17:1085173. doi: 10.3389/fnhum.2023.1085173. eCollection 2023. Front Hum Neurosci. 2023. PMID: 37033911 Free PMC article. Review.
-
Machine learning based brain signal decoding for intelligent adaptive deep brain stimulation.Exp Neurol. 2022 May;351:113993. doi: 10.1016/j.expneurol.2022.113993. Epub 2022 Jan 29. Exp Neurol. 2022. PMID: 35104499 Free PMC article. Review.
-
Machine Learning in Spinal Cord Stimulation for Chronic Pain.Oper Neurosurg. 2023 Aug 1;25(2):112-116. doi: 10.1227/ons.0000000000000774. Epub 2023 May 22. Oper Neurosurg. 2023. PMID: 37219574 Free PMC article.
References
-
- Aiello M., Eleopra R., Foroni F., Rinaldo S., Rumiati R.I. Weight gain after STN-DBS: The role of reward sensitivity and impulsivity. Cortex. 2017;92:150–161. - PubMed
-
- Airaksinen K., Butorina A., Pekkonen E., Nurminen J., Taulu S., Ahonen A., Schnitzler A., Mäkelä J.P. Somatomotor mu rhythm amplitude correlates with rigidity during deep brain stimulation in Parkinsonian patients. Clin. Neurophysiol. 2012;123(10):2010–2017. - PubMed
-
- Blankertz B., Lemm S., Treder M., Haufe S., Müller K.-R. Single-trial analysis and classification of ERP components–a tutorial. NeuroImage. 2011;56(2):814–825. - PubMed
Publication types
MeSH terms
LinkOut - more resources
Full Text Sources
Medical
