. 2020 Sep:59:102973.
doi: 10.1016/j.ebiom.2020.102973. Epub 2020 Sep 3.

Plasma metabolomic profiles in liver cancer patients following stereotactic body radiotherapy

Affiliations

Plasma metabolomic profiles in liver cancer patients following stereotactic body radiotherapy

Sylvia S W Ng et al. EBioMedicine. 2020 Sep.

Abstract

Background: Stereotactic body radiotherapy (SBRT) is an effective treatment for hepatocellular carcinoma (HCC). This study sought to identify differentially expressed plasma metabolites in HCC patients at baseline and early during SBRT, and to explore if changes in these metabolites early during SBRT may serve as biomarkers for radiation-induced liver injury and/or tumour response.

Methods: Forty-seven HCC patients were treated with SBRT on previously published prospective trials. Plasma samples were collected at baseline and after one to two fractions of SBRT, and analysed by GC/MS and LC/MS for untargeted and targeted metabolomics profiling, respectively.

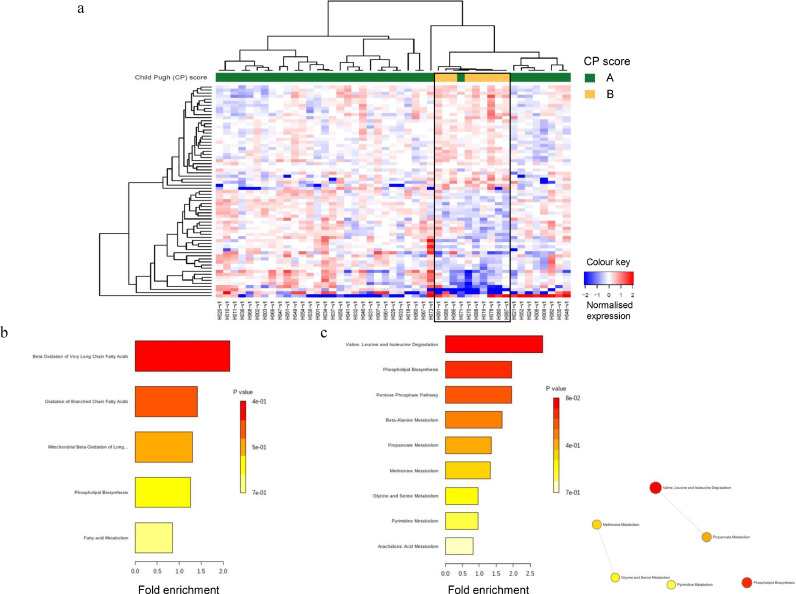
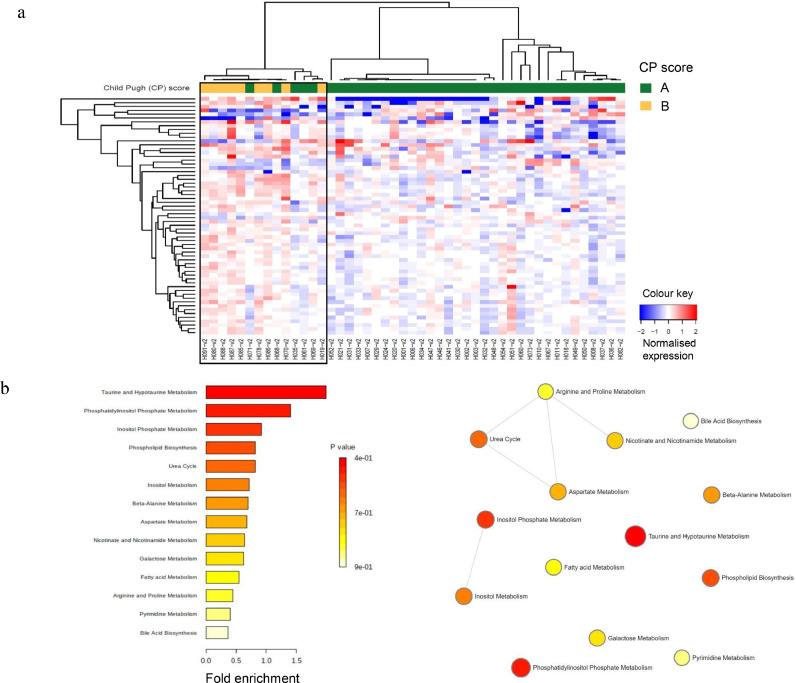
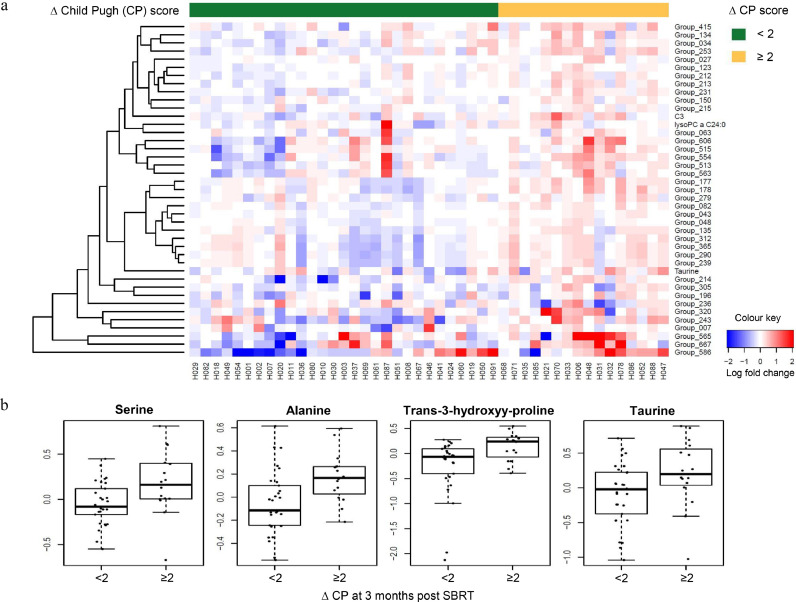
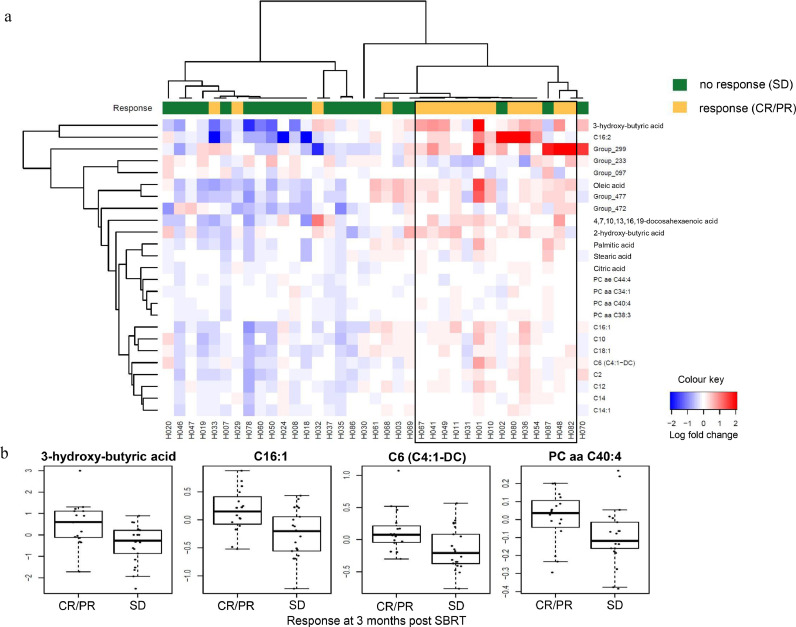
Findings: Sixty-nine metabolites at baseline and 62 metabolites after one to two fractions of SBRT were differentially expressed, and strongly separated the Child Pugh (CP) B from the CP A HCC patients. These metabolites are associated with oxidative stress and alterations in hepatic cellular metabolism. Differential upregulation of serine, alanine, taurine, and lipid metabolites early during SBRT from baseline was noted in the HCC patients who demonstrated the greatest increase in CP scores at three months post SBRT, suggesting that high protein and lipid turnover early during SBRT may portend increased clinical liver toxicity. Twenty annotated metabolites including fatty acids, glycerophospholipids, and acylcarnitines were differentially upregulated early during SBRT from baseline and separated patients with complete/partial response from those with stable disease at three months post SBRT.

Interpretation: Dysregulation of amino acid and lipid metabolism detected early during SBRT are associated with subsequent clinical liver injury and tumour response in HCC.

Keywords: Biomarkers; Hepatocellular carcinoma, Stereotactic body radiotherapy; Metabolomics.


Conflict of interest statement

Declaration of competing interest The authors have no competing interest to declare.

Figures

Fig 1
Fig. 1
Differential expression of metabolites in HCC patients at baseline. (a) Heatmap showing differentially expressed (all three p-values ≤0⋅05) plasma metabolites by Child Pugh (CP) scores, A (green) and B (yellow). Each column represents a patient; each row represents an individual metabolite. The more intense the red colour, the higher the level of the metabolite was detected. The more intense the blue colour, the lower the level of the metabolite was detected. See Table 2 for the identities of the annotated metabolites. (b) Metabolic set enrichment analysis (MSEA) of the high expressing metabolites. (c) MESA and enrichment node connections of the low expressing metabolites. Each node represents a metabolite set with its colour based on the P value, and its size is based on the fold enrichment for the metabolite list in query. Two metabolite sets are connected by an edge if the number of combined metabolites is over 20% the number of their combined metabolite sets.
Fig 2
Fig. 2
Differential expression of metabolites in HCC patients following one to two fractions of SBRT. (a) Heatmap showing differentially expressed (all three p-values ≤0⋅05) plasma metabolites by Child Pugh (CP) scores, A (green) and B (yellow). Each column represents a patient; each row represents an individual metabolite. The more intense the red colour, the higher the level of the metabolite was detected. The more intense the blue colour, the lower the level of the metabolite was detected. See Table 3 for the identities of the annotated metabolites. (b) MESA and enrichment node connections of the high expressing metabolites. Each node represents a metabolite set with its colour based on the P value, and its size is based on the fold enrichment for the metabolite list in query. Two metabolite sets are connected by an edge if the number of combined metabolites is over 20% the number of their combined metabolite sets.
Fig 3
Fig. 3
Differential expression changes of metabolites after one to two fractions of SBRT from baseline by change in Child Pugh (CP) score at three months post SBRT. (a) Heatmap of differential upregulation or downregulation (all three p-values ≤0⋅05) of plasma metabolites with increase in Child Pugh (ΔCP) score of <2 (green) vs. ≥2 (yellow) points at three months post SBRT compared to baseline. Each column represents a patient. Each row represents an individual metabolite. The more intense the red colour, the higher the level of the metabolite was detected. The more intense the blue colour, the lower the level of the metabolite was detected. See Table 4 for the identities of the annotated metabolites. (b) Representative boxplots showing the fold change of 4 metabolites plotted against increasing ΔCP score at three months post SBRT.
Fig 4
Fig. 4
Differential expression changes of metabolites after one to two fractions of SBRT from baseline by in-field tumour response at three months post SBRT. (a) Heatmap of differential upregulation or downregulation (all three p-values ≤0⋅05) of plasma metabolites in HCC patients with response (complete/partial, CR/PR, yellow) vs. those with no response (stable disease, SD, green) at three months post SBRT. Each column represents a patient. Each row represents an individual metabolite. The more intense the red colour, the higher the level of the metabolite was detected. The more intense the blue colour, the lower the level of the metabolite was detected. (b) Representative boxplots showing the fold change of 4 metabolites plotted against in-field tumour response at 3 months post SBRT.

References

    1. Bujold A, Massey CA, Kim JJ, Brierley J, Cho C, Wong RKS. Sequential phase I and II trials of stereotactic body radiotherapy for locally advanced hepatocellular carcinoma. J Clin Oncol. 2013;31:1631–1639. - PubMed
    1. Sanuki N, Takeda A, Oku Y, Mizuno T, Aoki Y, Eriguchi T. Stereotactic body radiotherapy for small hepatocellular carcinoma: a retrospective outcome analysis in 185 patients. Acta Oncol. 2014;53:399–404. - PubMed
    1. Yoon SM, Lim Y-S, Park MJ, Kim SY, Cho B, Shim JH. Stereotactic body radiation therapy as an alternative treatment for small hepatocellular carcinoma. PLoS One. 2013;8:e79854. - PMC - PubMed
    1. Ohri N, Tomé WA, Méndez Romero A, Miften M, Ten Haken RK, Dawson LA. Local control after stereotactic body radiation therapy for liver tumors. Int J Radiat Oncol Biol Phys. 2018 doi: 10.1016/j.ijrobp.2017.12.288. S0360-3016(17)34525-X. - DOI - PMC - PubMed
    1. Culleton S, Jiang H, Haddad CR, Kim J, Brierley J, Brade A. Outcomes following definitive stereotactic body radiotherapy for patients with Child-Pugh B or C hepatocellular carcinoma. Radiother Oncol. 2014;111:412–417. - PubMed

MeSH terms