. 2020 Dec:145:106091.
doi: 10.1016/j.envint.2020.106091. Epub 2020 Sep 3.

Dysregulated lipid and fatty acid metabolism link perfluoroalkyl substances exposure and impaired glucose metabolism in young adults

Affiliations

Dysregulated lipid and fatty acid metabolism link perfluoroalkyl substances exposure and impaired glucose metabolism in young adults

Zhanghua Chen et al. Environ Int. 2020 Dec.

Abstract

Background: Per- and polyfluoroalkyl substances (PFASs) exposure is ubiquitous among the US population and has been linked to adverse health outcomes including cardiometabolic diseases, immune dysregulation and endocrine disruption. However, the metabolic mechanism underlying the adverse health effect of PFASs exposure is unknown.

Objective: The aim of this project is to investigate the association between PFASs exposure and altered metabolic pathways linked to increased cardiometabolic risk in young adults.

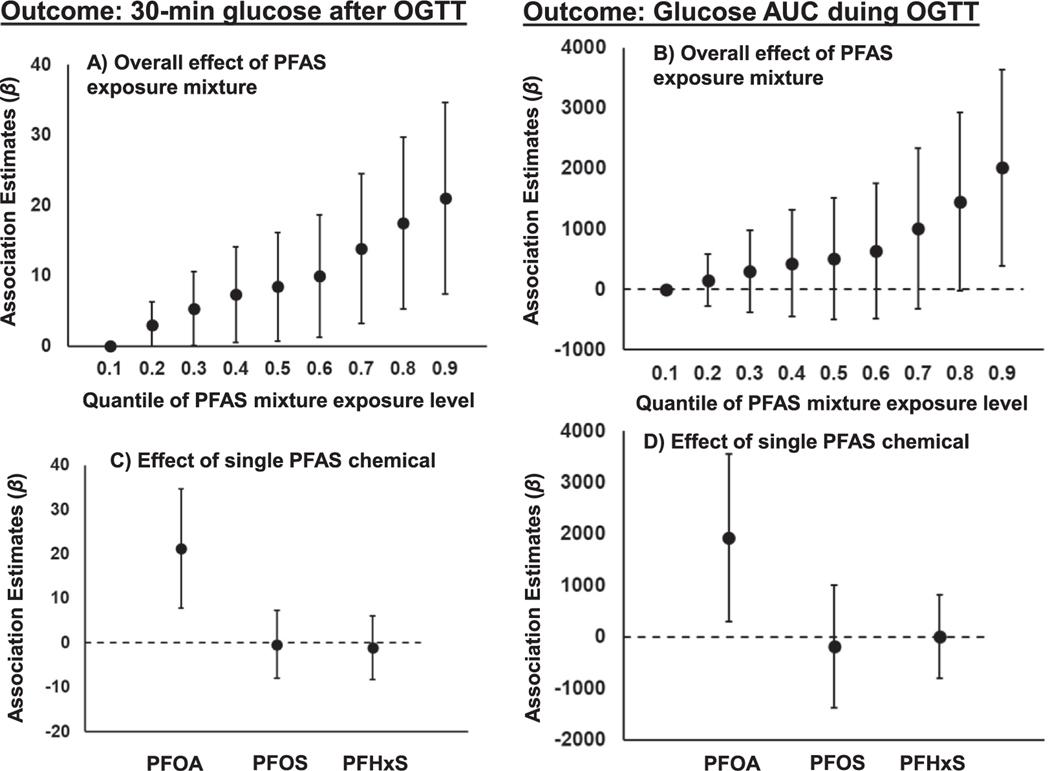
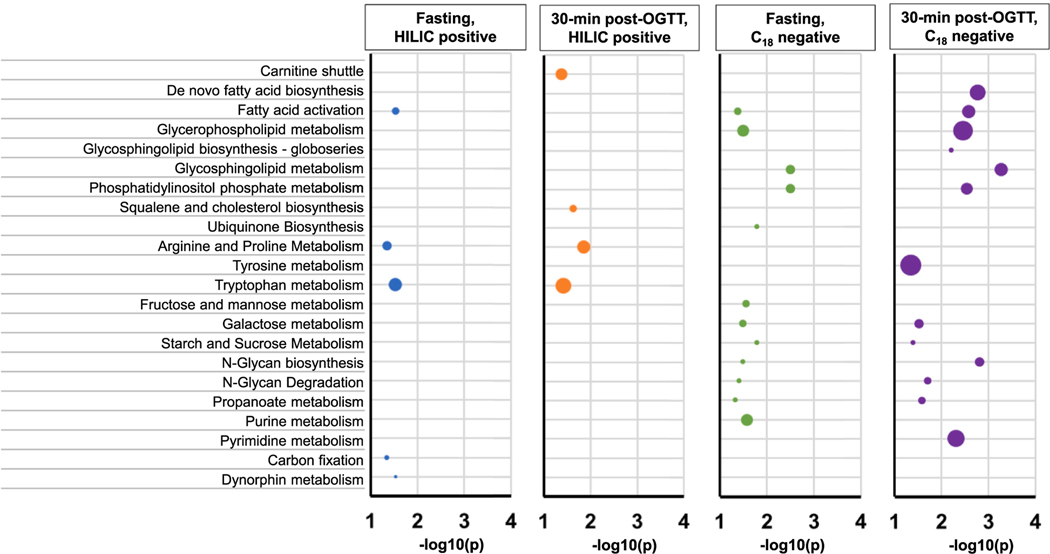
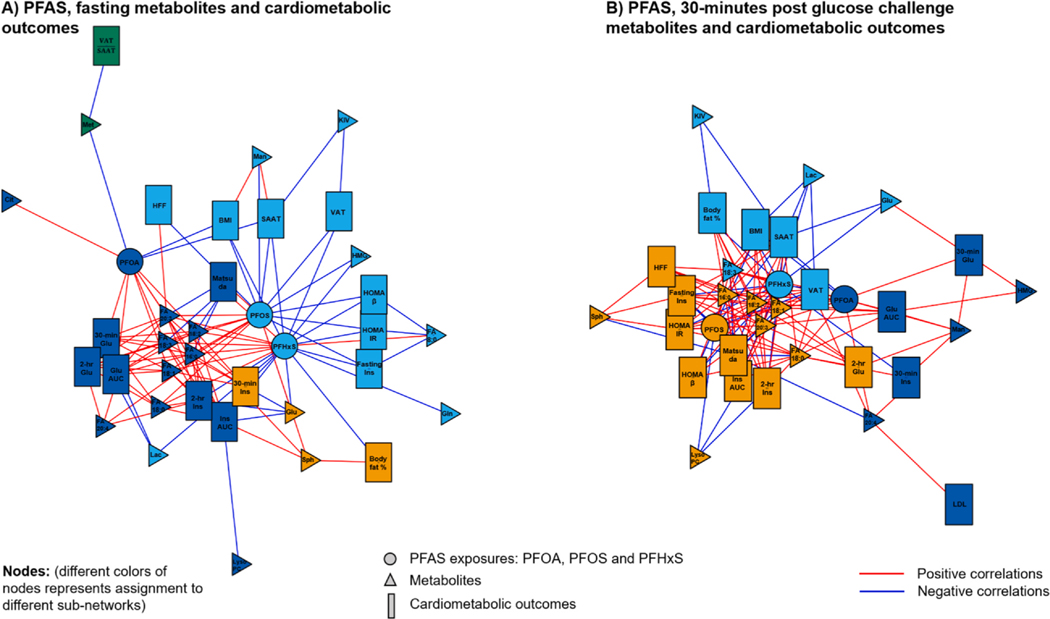
Methods: A total of 102 young adults with 82% overweight or obese participants were enrolled from Southern California between 2014 and 2017. Cardiometabolic outcomes were assessed including oral glucose tolerance test (OGTT) measures, body fat and lipid profiles. High-resolution metabolomics was used to quantify plasma exposure levels of three PFAS congeners and intensity profiles of the untargeted metabolome. Fasting concentrations of 45 targeted metabolites involved in fatty acid and lipid metabolism were used to verify untargeted metabolomics findings. Bayesian Kernel Machine Regression (BKMR) was used to examine the associations between PFAS exposure mixture and cardiometabolic outcomes adjusting for covariates. Mummichog pathway enrichment analysis was used to explore PFAS-associated metabolic pathways. Moreover, the effect of PFAS exposure on the metabolic network, including metabolomic profiles and cardiometabolic outcomes, was investigated.

Results: Higher exposure to perfluorooctanoic acid (PFOA) was associated with higher 30-minute glucose levels and glucose area under the curve (AUC) during the OGTT (p < 0.001). PFAS exposure was also associated with altered lipid pathways, which contributed to the metabolic network connecting PFOA and higher glucose levels following the OGTT. Targeted metabolomics analysis indicated that higher PFOA exposure was associated with higher levels of glycerol (p = 0.006), which itself was associated with higher 30-minute glucose (p = 0.006).

Conclusions: Increased lipolysis and fatty acid oxidation could contribute to the biological mechanisms linking PFAS exposure and impaired glucose metabolism among young adults. Findings of this study warrants future experimental studies and epidemiological studies with larger sample size to replicate.

Keywords: Cardiometabolic dysfunction; Lipolysis; Metabolomics; Perfluoroalkyl substances; Young adults; β-oxidation.


Figures

Fig. 1.
Fig. 1.
Associations of perfluoroalkyl substances (PFASs) exposure mixture with 30-minute glucose levels and glucose area under the curve (AUC) measured during the oral glucose tolerance test (OGTT). Panels A) and B) present total effects of PFAS exposure mixture on glucose outcomes by quantiles of exposure levels. Panels C) and D) present differences of glucose outcomes in participants with individual PFAS chemical exposure [perfluorooctanoic acid (PFOA), perfluorooctane sulfonate (PFOS) and perfluorohexane sulfonic acid (PFHxS)] level at 90th percentile to participants with the exposure level at 10th percentile, while conditioned on the other two PFAS chemical exposures both at 50th percentiles across all participants.
Fig. 2.
Fig. 2.
Metabolic pathways that are associated with PFAS exposures revealed by the analysis of high-resolution metabolomics data (metabolomic features having coefficients of variation ≤ 0.3 across 5 analytical batches) from fasting and 30-minute post glucose challenge plasma samples using both HILIC positive and C18 negative modes. The horizontal scale indicates the significance levels of pathway enrichment tests conducted by Mummichog software.
Fig. 3.
Fig. 3.
Integrated network analysis among PFAS exposures, metabolites with confirmed identity and multiple cardiometabolic outcomes including adiposity measures, oral-glucose tolerance test-derived glucose and insulin measures, insulin resistance index and lipid profiles. Each PFAS exposure, metabolite and outcome variable is treated as a node in the entire network and are plotted using different shapes. Sub-networks are classified by different colors and represent more connections between specific PFAS congener with a group of metabolomic signatures and cardiometabolic outcomes. Panel A presents the network among PFAS exposure, metabolite intensity in fasting plasma samples and cardiometabolic outcomes. Panel B presents the network among PFAS exposure, metabolite intensity in 30-minute post glucose challenge plasma samples and cardiometabolic outcomes. PFAS exposures: PFOA = Perfluorooctanoic acid; PFOS = Perfluorooctane sulfonate; PFHxS = Perfluorohexane sulfonic acid. Metabolites: LysoPC = LysoPC (18:0); FA8:0 = FA 8:0 (Octanoate); FA16:0 = FA 16:0 (Palmitate); FA18:3 = FA 18:3n-3 or n-6 (Linolenic acid); FA18:2 = FA 18:2 (Linoleic acid); FA18:1 = FA 18:1 (Oleic acid); FA18:0 = FA 18:0 (Stearic acid); FA20:4 = FA 20:4 (Arachidonic acid); FA20:3 = FA 20:3 (Homolinoleic acid); Sph = Sphingosine; Cit = Citrulline; Met = Methionine; Glu = Glucose; Man = Mannose/Galactose; Lac = Lactate; Gln = Glutamine; HMG = Hydroxymethylglutarate; KIV = Oxovalerate/Ketoisovalerate. Cardiometabolic outcomes: 30-min GLU = 30-min glucose after OGTT; 2-hr GLU = 2-hour glucose after OGTT; Glu AUC = OGTT glucose area under the curve; Fasting Ins = Fasting insulin; 30-min Ins = 30-min insulin after OGTT; 2-hr Ins = 2-hour insulin after OGTT; Ins AUC = OGTT insulin area under the curve; HFF = Hepatic fat fraction; HOMA-β = Homeostatic model assessment β-cell function; Matsuda = Matsuda index; HOMA-IR = Homeostatic model assessment insulin resistance; SAAT = Subcutaneous adipose tissue; BMI = Body mass index; Body fat % = Body fat percent; VAT = Visceral adipose tissue; VATSAAT  = VAT-to-SAAT ratio; LDL = Low-density lipoprotein.

References

    1. Juonala M, Singh GR, Davison B, et al. , 2016. Childhood metabolic syndrome, inflammation and carotid intima-media thickness. The Aboriginal Birth Cohort Study. Int. J. Cardiol 203, 32–36. - PubMed
    1. Morrison JA, Friedman LA, Gray-McGuire C, 2007. Metabolic syndrome in childhood predicts adult cardiovascular disease 25 years later: the Princeton Lipid Research Clinics Follow-up Study. Pediatrics 120, 340–345. - PubMed
    1. Sunderland EM, Hu XC, Dassuncao C, Tokranov AK, Wagner CC, Allen JG, 2019. A review of the pathways of human exposure to poly- and perfluoroalkyl substances (PFASs) and present understanding of health effects. J. Eposure Sci. Environ. Epidemiol 29, 131–147. - PMC - PubMed
    1. Lee YJ, 2018. Potential health effects of emerging environmental contaminants perfluoroalkyl compounds. Yeungnam Univ. J. Med 35, 156–164. - PMC - PubMed
    1. Grandjean P, Clapp R, 2014. Changing interpretation of human health risks from perfluorinated compounds. Public Health Rep 129, 482–485. - PMC - PubMed

Publication types

LinkOut - more resources