. 2020 Oct 26;375(1810):20190513.
doi: 10.1098/rstb.2019.0513. Epub 2020 Sep 7.

The fingerprint of the summer 2018 drought in Europe on ground-based atmospheric CO2 measurements

M Ramonet  1 P Ciais  1 F Apadula  2 J Bartyzel  3 A Bastos  4 P Bergamaschi  5 P E Blanc  6 D Brunner  7 L Caracciolo di Torchiarolo  8 F Calzolari  9 H Chen  10 L Chmura  3 A Colomb  11 S Conil  12 P Cristofanelli  9 E Cuevas  13 R Curcoll  14 M Delmotte  1 A di Sarra  15 L Emmenegger  7 G Forster  16 A Frumau  17 C Gerbig  18 F Gheusi  19 S Hammer  20 L Haszpra  21 J Hatakka  22 L Hazan  1 M Heliasz  23 S Henne  7 A Hensen  17 O Hermansen  24 P Keronen  25 R Kivi  22 K Komínková  26 D Kubistin  27 O Laurent  1 T Laurila  22 J V Lavric  18 I Lehner  23 K E J Lehtinen  22   28 A Leskinen  22   28 M Leuenberger  29 I Levin  20 M Lindauer  27 M Lopez  1 C Lund Myhre  24 I Mammarella  25 G Manca  5 A Manning  16 M V Marek  26 P Marklund  30 D Martin  31 F Meinhardt  32 N Mihalopoulos  33 M Mölder  34 J A Morgui  14 J Necki  3 S O'Doherty  35 C O'Dowd  36 M Ottosson  30 C Philippon  1 S Piacentino  15 J M Pichon  11 C Plass-Duelmer  27 A Resovsky  1 L Rivier  1 X Rodó  37   38 M K Sha  39 H A Scheeren  10 D Sferlazzo  15 T G Spain  36 K M Stanley  35   40 M Steinbacher  7 P Trisolino  9 A Vermeulen  41 G Vítková  26 D Weyrauch  27 I Xueref-Remy  6 K Yala  1 C Yver Kwok  1
Affiliations

The fingerprint of the summer 2018 drought in Europe on ground-based atmospheric CO2 measurements

M Ramonet et al. Philos Trans R Soc Lond B Biol Sci. .

Abstract

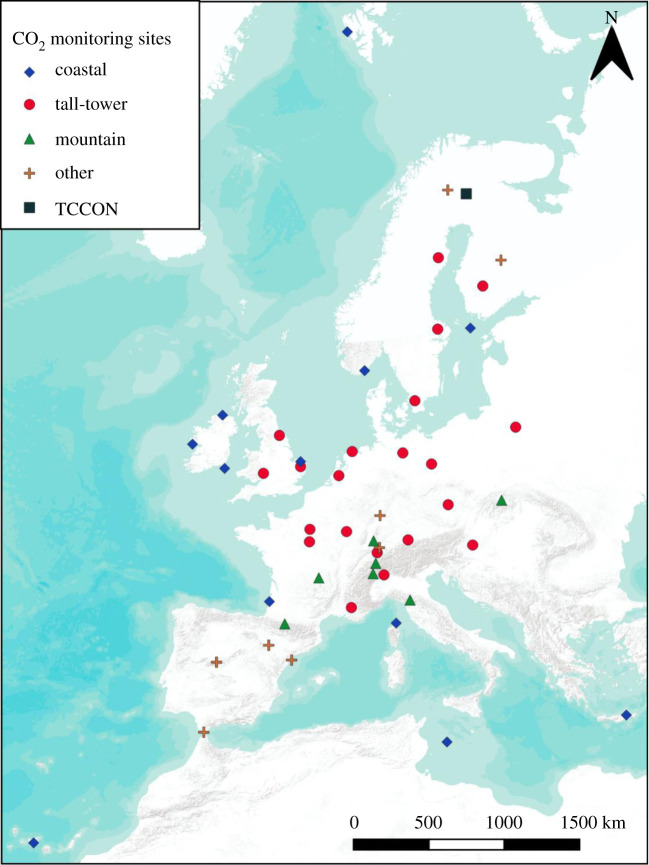
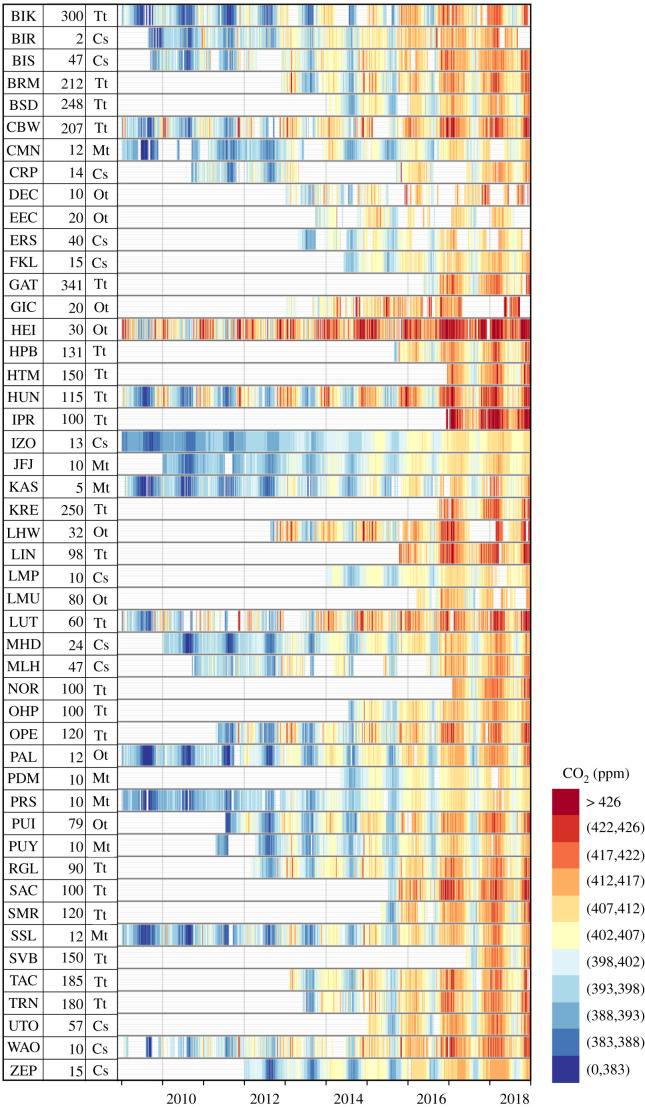
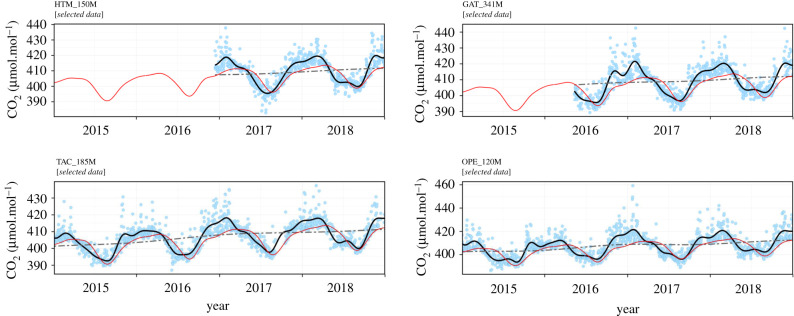
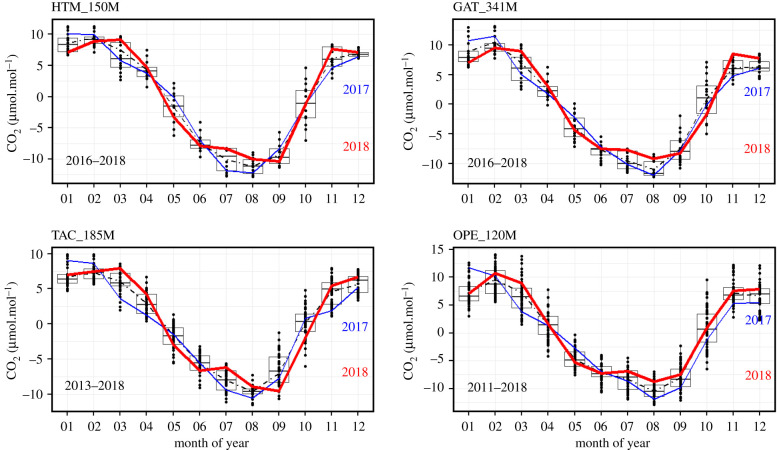
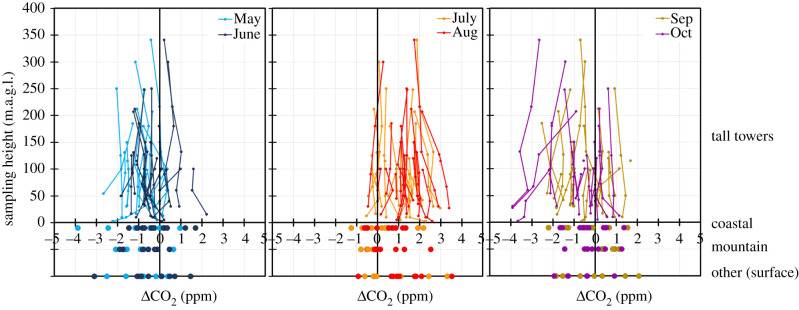
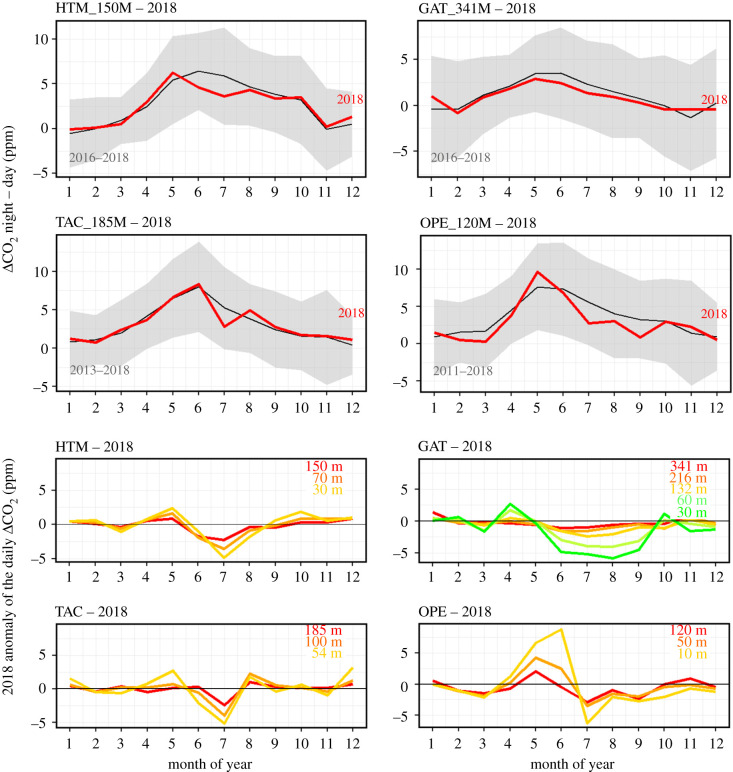
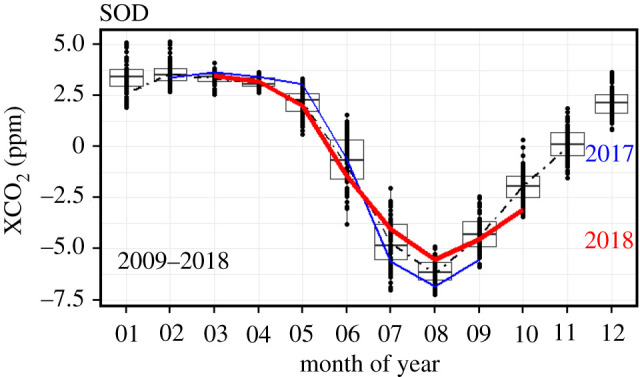
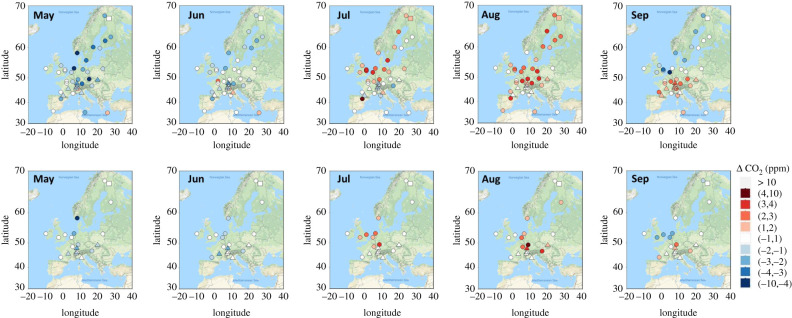
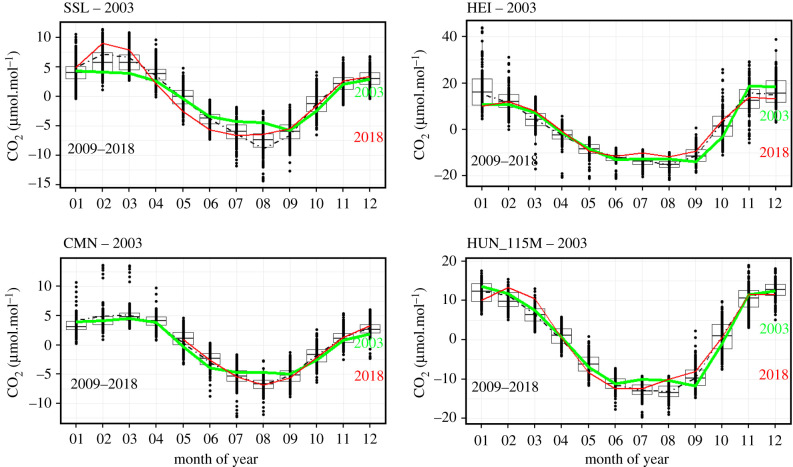
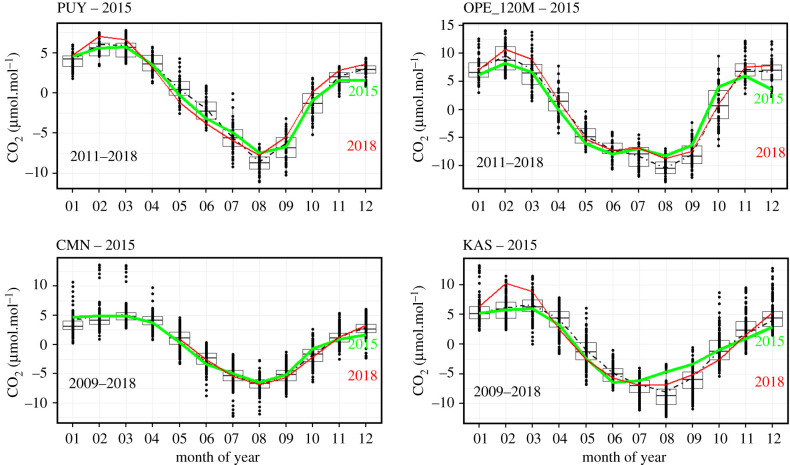
During the summer of 2018, a widespread drought developed over Northern and Central Europe. The increase in temperature and the reduction of soil moisture have influenced carbon dioxide (CO2) exchange between the atmosphere and terrestrial ecosystems in various ways, such as a reduction of photosynthesis, changes in ecosystem respiration, or allowing more frequent fires. In this study, we characterize the resulting perturbation of the atmospheric CO2 seasonal cycles. 2018 has a good coverage of European regions affected by drought, allowing the investigation of how ecosystem flux anomalies impacted spatial CO2 gradients between stations. This density of stations is unprecedented compared to previous drought events in 2003 and 2015, particularly thanks to the deployment of the Integrated Carbon Observation System (ICOS) network of atmospheric greenhouse gas monitoring stations in recent years. Seasonal CO2 cycles from 48 European stations were available for 2017 and 2018. Earlier data were retrieved for comparison from international databases or national networks. Here, we show that the usual summer minimum in CO2 due to the surface carbon uptake was reduced by 1.4 ppm in 2018 for the 10 stations located in the area most affected by the temperature anomaly, mostly in Northern Europe. Notwithstanding, the CO2 transition phases before and after July were slower in 2018 compared to 2017, suggesting an extension of the growing season, with either continued CO2 uptake by photosynthesis and/or a reduction in respiration driven by the depletion of substrate for respiration inherited from the previous months due to the drought. For stations with sufficiently long time series, the CO2 anomaly observed in 2018 was compared to previous European droughts in 2003 and 2015. Considering the areas most affected by the temperature anomalies, we found a higher CO2 anomaly in 2003 (+3 ppm averaged over 4 sites), and a smaller anomaly in 2015 (+1 ppm averaged over 11 sites) compared to 2018. This article is part of the theme issue 'Impacts of the 2018 severe drought and heatwave in Europe: from site to continental scale'.

Keywords: ICOS; atmospheric CO2 measurements; drought; net ecosystem exchange.


Conflict of interest statement

We declare we have no competing interests.

Figures

Figure 1.
Figure 1.
Location of the CO2 monitoring sites in Europe. The symbols represent the different type of stations: tall towers (red circles), coastal sites (blue diamonds), mountain sites (green triangles), other surface stations (crosses) and total carbon column observing network (TCCON) site (square). (Online version in colour.)
Figure 2.
Figure 2.
Time series of CO2 mole fractions (ppm) at 48 sites in Western Europe over the period 2009–2018. Each vertical coloured line represents a CO2 daily average. The second column indicates the sampling height above ground level, and the third column indicates whether the station is a tall tower (Tt), coastal (Cs), mountain (Mt) or other surface site (Ot). The colour code indicates the CO2 mole fraction in ppm. (Online version in colour.)
Figure 3.
Figure 3.
CO2 time series observed at Hyltemossa (HTM, Sweden), Gartow (GAT, Germany), Tacolneston (TAC, UK) and Observatoire Pérenne de l'Environnement (OPE, France). Each blue dot corresponds to a daily average, after data selection as described in the main text. The black curve shows the smoothed curve of these points, and the dash-dot line the long-term trends. The red curve represents the smooth curve of the CO2 time series at Mace Head, Ireland, in the marine sector. (Online version in colour.)
Figure 4.
Figure 4.
CO2 seasonal cycles observed at Hyltemossa (HTM, Sweden), Gartow (GAT, Germany), Tacolneston (TAC, UK) and Observatoire Pérenne de l'Environnement (OPE, France). The 2018 cycle is shown in red, 2017 in blue, and a statistical summary of the full measurement period as box-and-whisker plots showing the median, first and third quartiles over the entire measurement period of each station, indicated in the bottom left corners of the plots. Corresponding figures for all other stations are shown in electronic supplementary material, figure S2. (Online version in colour.)
Figure 5.
Figure 5.
Monthly mean CO2 differences anomalies for each month during May to October 2018, compared to the same month during previous years, the data being available from 2009 to 2018 with variable coverage between stations, i.e. CO2 (2018) minus CO2 (previous years). Upper panel shows the vertical profile of tall towers, whereas the bottom panel shows separately coastal, mountain and other surface sites. (Online version in colour.)
Figure 6.
Figure 6.
The top panel shows, at four tall towers (highest levels), the amplitude of the CO2 daily cycles averaged every month for all available years (black line and grey area), and for 2018 (red line). The bottom panel shows, for the same sites, the differences of CO2 daily cycles between 2018 and the average over all available years. The colours represent the different sampling levels at the towers (red curves correspond to the top panel figures). (Online version in colour.)
Figure 7.
Figure 7.
Same as figure 4 but for the column-averaged dry air mole fraction of CO2 (XCO2) measured at the TCCON site of Sodankylä, Finland. (Online version in colour.)
Figure 8.
Figure 8.
Map of the monthly mean CO2 differences (2018 minus 2017) from May (left) to September (right). Circles represent surface stations in lowlands. Triangles indicate the mountain sites, and the square indicates a total column measurement station (TCCON). Top panels show the differences for 2018 minus 2017. Bottom panels show differences for 2018 minus 2010–2017 mean. (Online version in colour.)
Figure 9.
Figure 9.
Same as figure 4 for the 2003 (green) and 2018 (red) seasonal cycles at Shauinsland (SSL, Germany), Heidelberg (HEI, Germany), Monte Cimone (CMN, Italy) and Hegyhatsall (HUN, Hungary). (Online version in colour.)
Figure 10.
Figure 10.
Same as figure 4 for the 2015 (green) and 2018 (red) seasonal cycles at Puy de Dôme (PUY, France), Observatoire Pérenne de l'Environnement (OPE, France), Monte Cimone (CMN, Italy), Kasprowy (KAS, Poland). (Online version in colour.)

References

    1. Ramonet M, et al. 2010. A recent build-up of atmospheric CO2 over Europe. Part 1: observed signals and possible explanations. Tellus B 62, 1–13. (10.1111/j.1600-0889.2009.00442.x) - DOI
    1. Conway TJ, Tans PP. 1999. Development of the CO2 latitude gradient in recent decades. Global Biogeochem. Cycles 13, 821 (10.1029/1999GB900045) - DOI
    1. Dlugokencky EJ, et al. 2009. Observational constraints on recent increases in the atmospheric CH4 burden. Geophys. Res. Lett. 36, L18803 (10.1029/2009gl039780) - DOI
    1. Miller JB, Gatti LV, d'Amelio MTS, Crotwell AM, Dlugokencky EJ, Bakwin P, Artaxo P, Tans PP. 2007. Airborne measurements indicate large methane emissions from the eastern Amazon basin. Geophys. Res. Lett. 34, L10809 (10.1029/2006gl029213) - DOI
    1. Ciais P, Rayner P, Chevallier F, Bousquet P, Logan M, Peylin P, Ramonet M. 2010. Atmospheric inversions for estimating CO2 fluxes: methods and perspectives. Clim. Change 103, 69–92. (10.1007/s10584-010-9909-3) - DOI

Publication types

LinkOut - more resources