

Non-small cell lung cancer in never- and ever-smokers: Is it the same disease?
- PMID: 32893009
- PMCID: PMC9126597
- DOI: 10.1016/j.jtcvs.2020.03.175
Non-small cell lung cancer in never- and ever-smokers: Is it the same disease?
Abstract
Objectives: To investigate differences in presentation, pathology, and outcomes after resection of non-small cell lung cancer (NSCLC) in never-smokers versus ever-smokers.
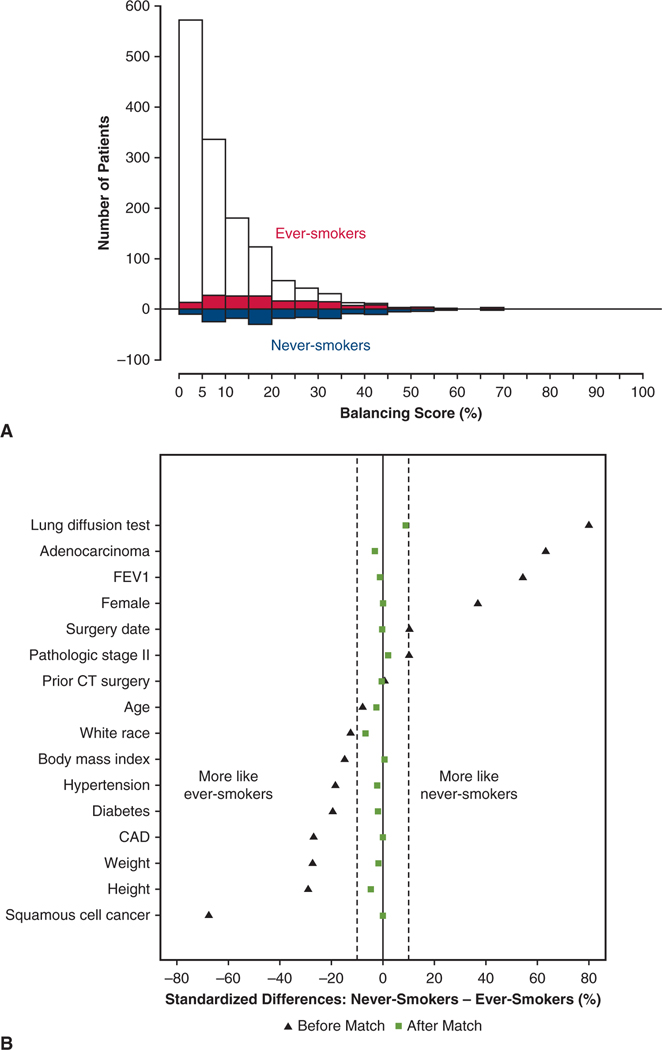
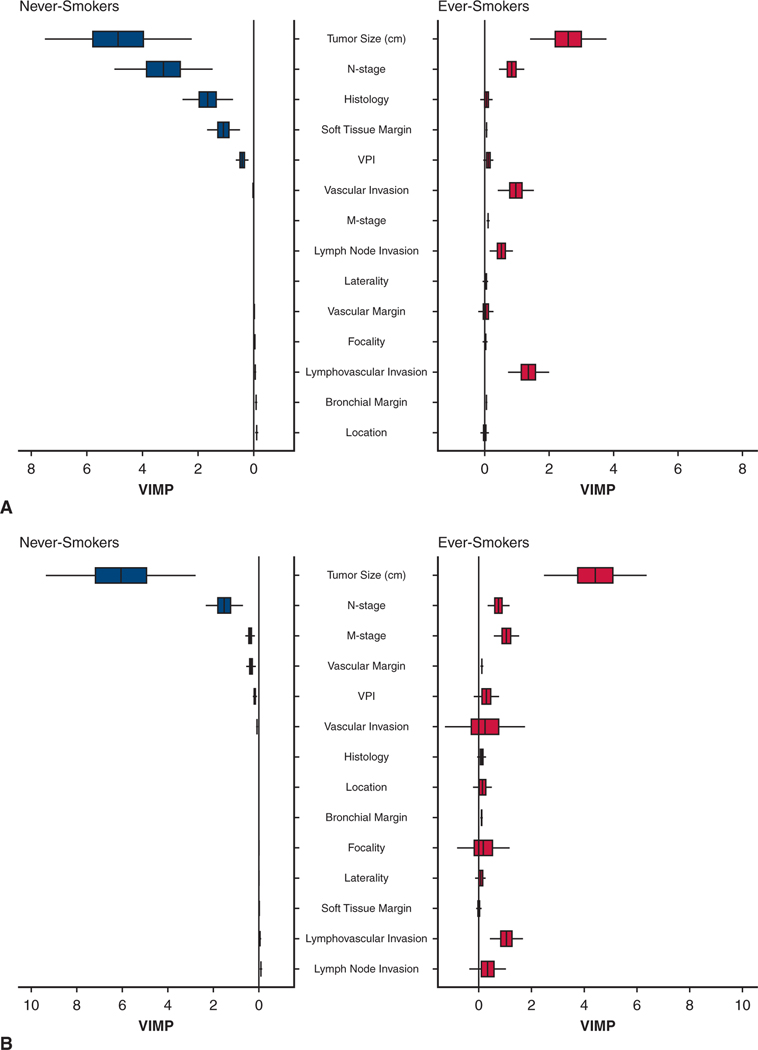
Methods: From January 2006 to July 2016, 172 never-smokers and 1376 ever-smokers with NSCLC underwent pulmonary resection. The 2 cohorts were matched on patient characteristics, histopathological cancer cell type, and pathological stage group using a weighted balancing score, and overall survival and cancer recurrence were compared by pathological stage. Random forests for survival was used to identify granular cancer characteristics with different survival and cancer recurrence importance between groups.
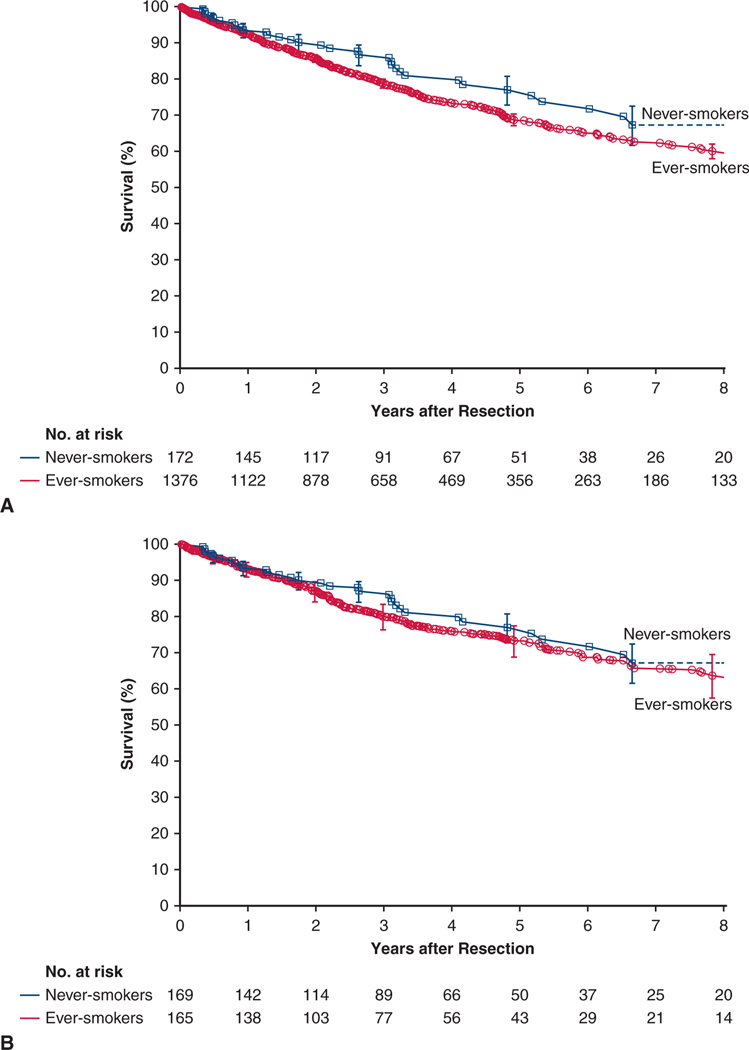
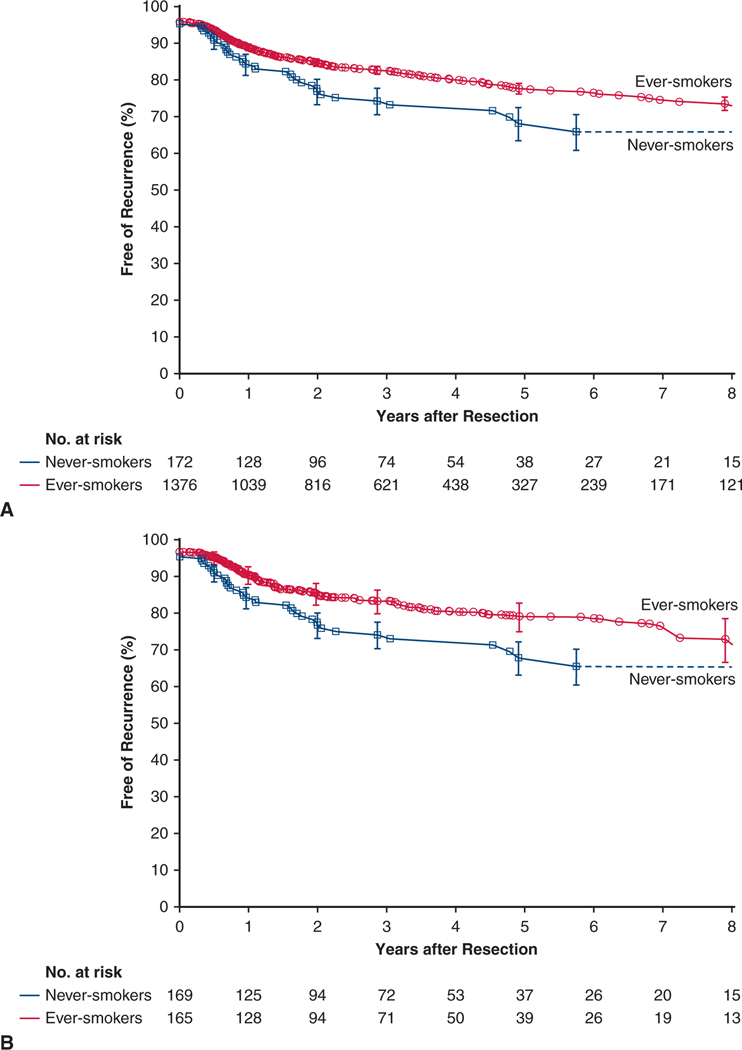
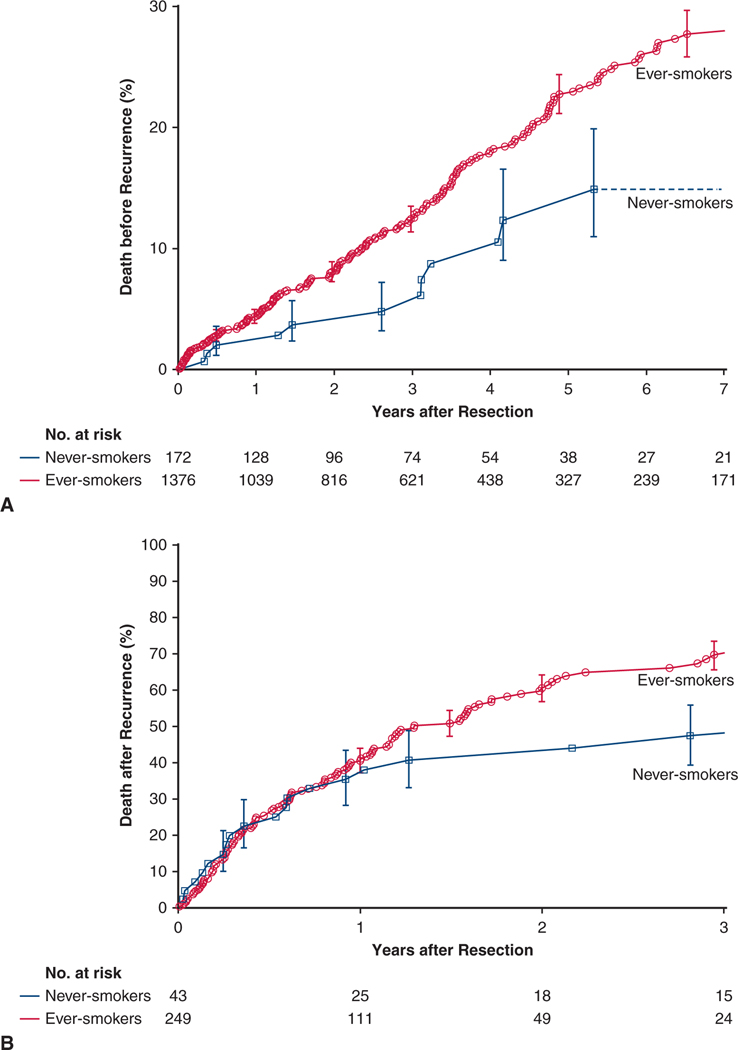
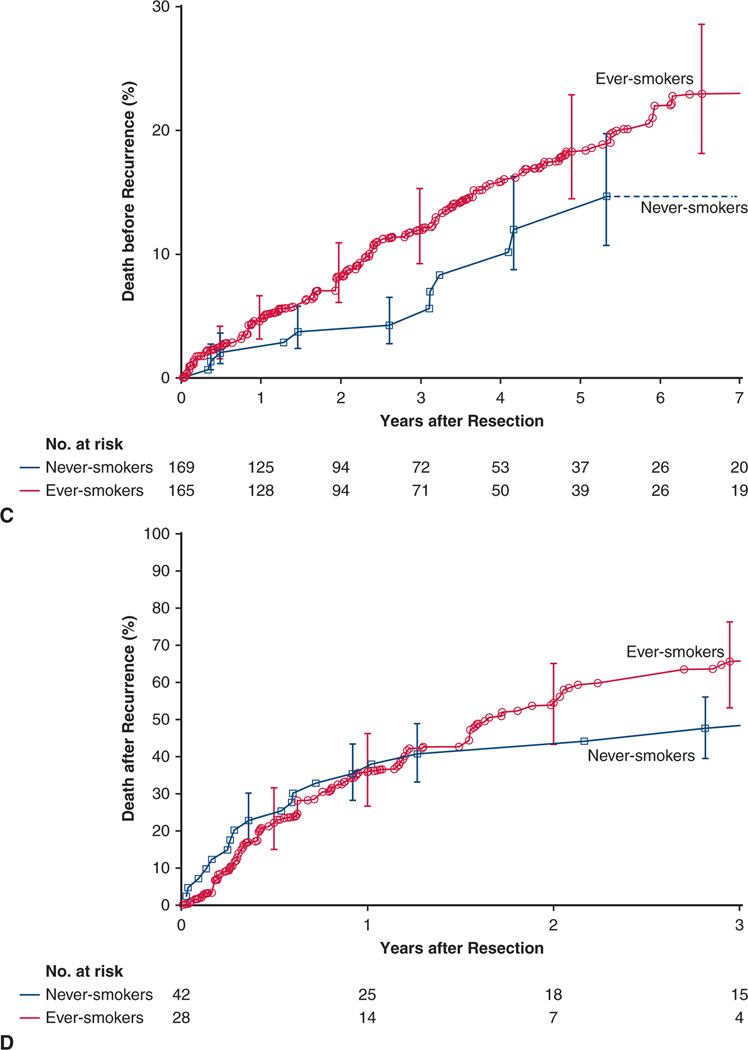
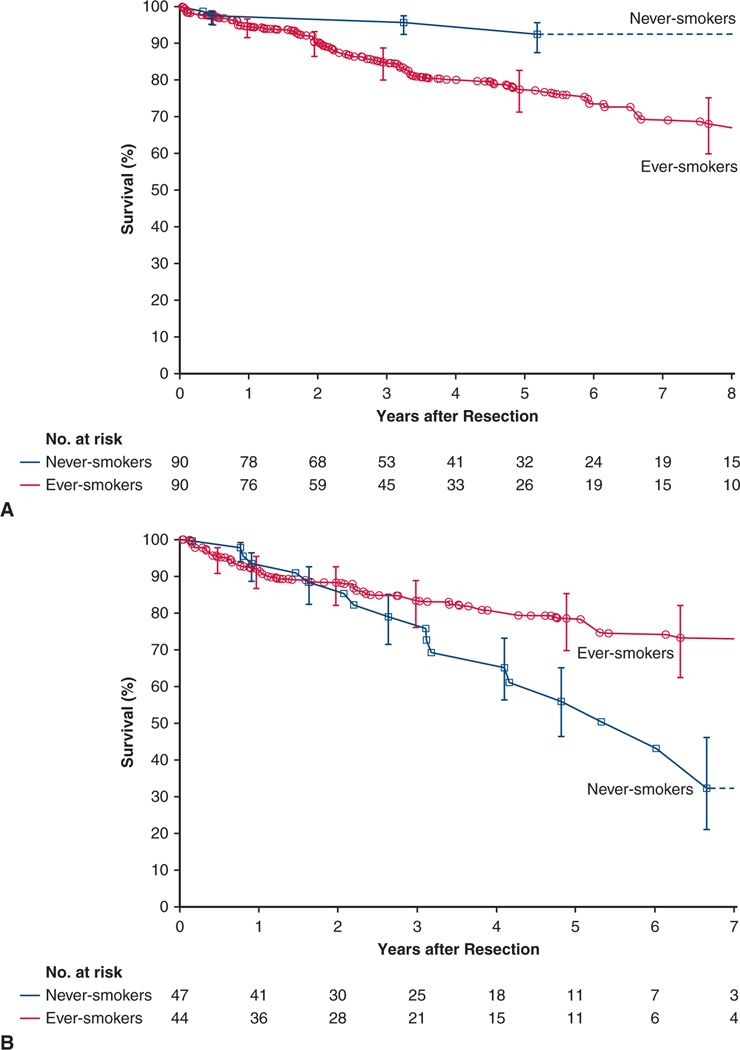
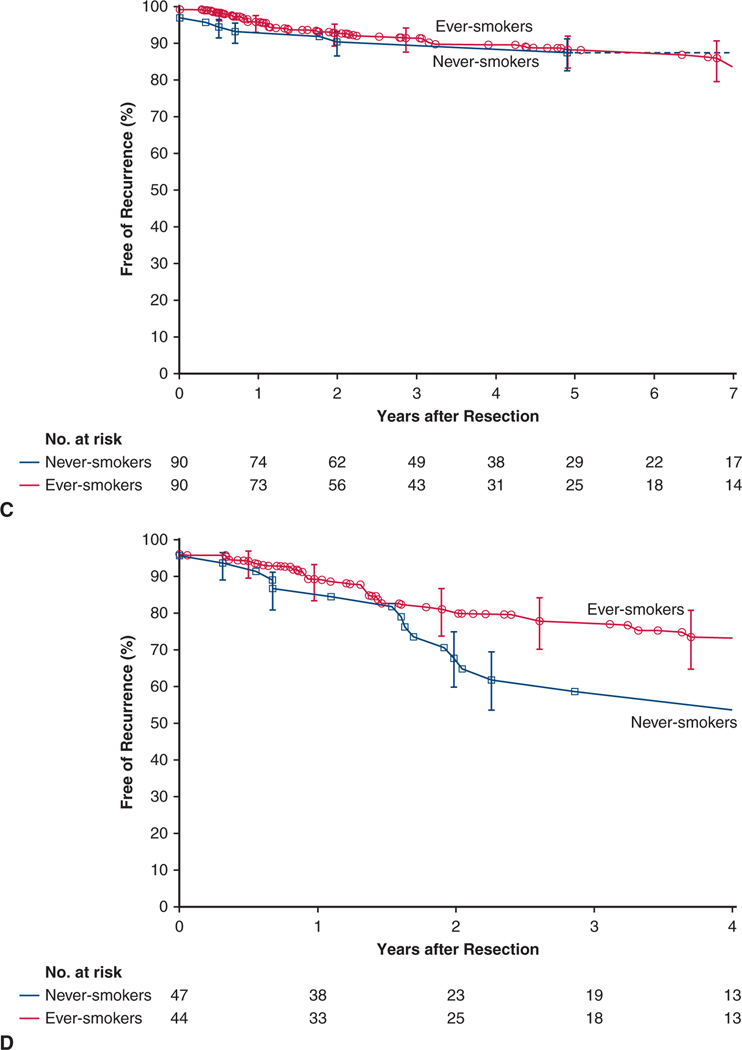
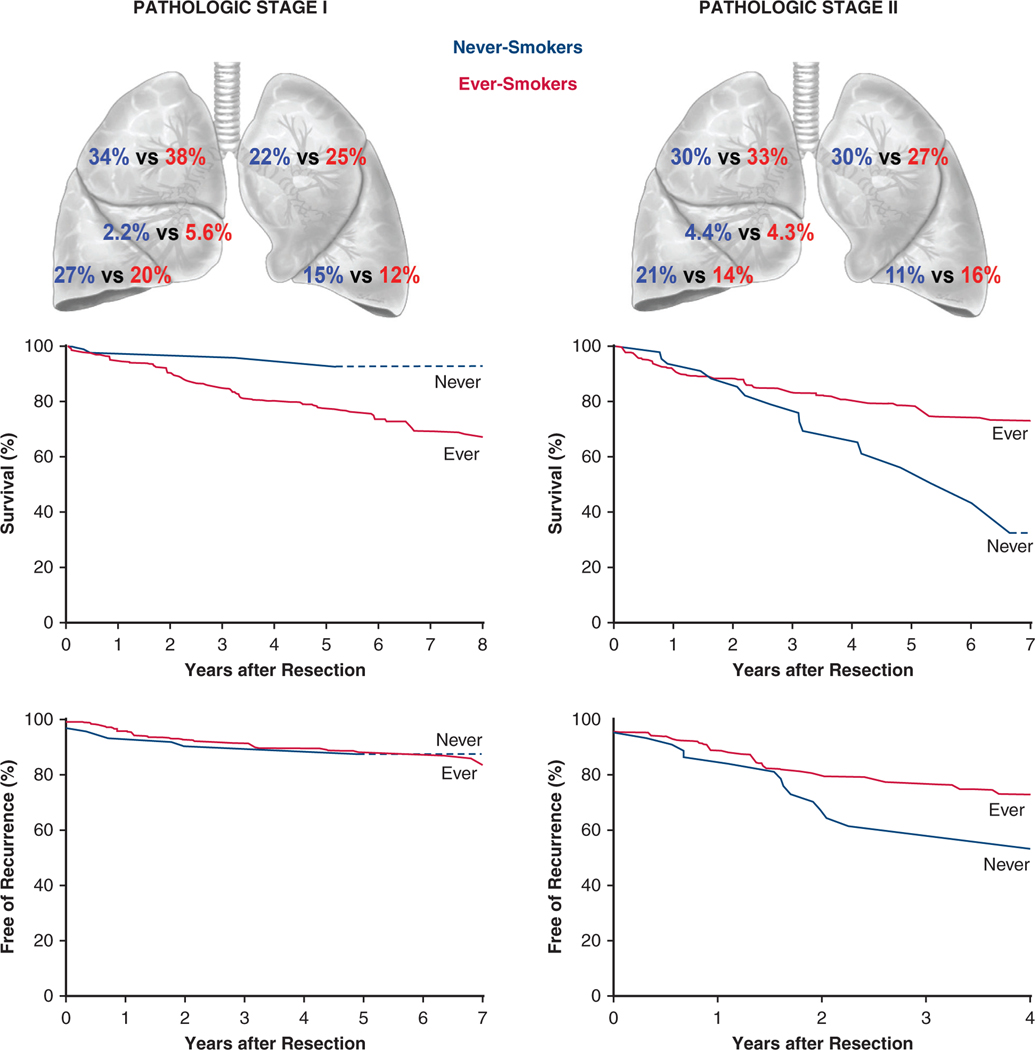
Results: In never-smokers, the prevalence of NSCLC was more frequent in women than in men (63% [n = 109] vs 45% [n = 63]). Compared with ever-smokers, never-smokers had less upper-lobe disease (53% [n = 91] vs 62% [n = 855]) and more adenocarcinoma (88% [n = 151] vs 62% [n = 845]). Postoperative complications were similar. Never-smokers had a lower prevalence of non-lung cancer deaths than ever-smokers (13% vs 23% at 5 years; P = .006). Among matched pairs, never-smokers had better overall survival at 5 years in pathological stage I (96% vs 78%), but worse survival in stage II (54% vs 78%). Tumor size, N category, and histopathological cell type were more important drivers of mortality and cancer recurrence in never-smokers than in ever-smokers.
Conclusions: NSCLC in never-smokers affects women more than men and presents with different anatomic and histopathological distributions. Matched never-smokers have better or equivalent outcomes than ever-smokers in pathological stage I cancer, but are less likely to survive and to be cured of cancer as tumor burden increases. These findings suggest that there might be unique tumor or host behaviors differentially impacting survival of never- and ever-smoking patients with NSCLC.
Keywords: cancer recurrence; pulmonary resection; risk factors; survival analysis; weighted propensity matching.
Copyright © 2020 The American Association for Thoracic Surgery. Published by Elsevier Inc. All rights reserved.
Conflict of interest statement
Conflict of Interest Statement
The authors reported no conflicts of interest.
Figures
Comment in
-
Commentary: Now I think I know the answer.J Thorac Cardiovasc Surg. 2021 Jun;161(6):1918-1919. doi: 10.1016/j.jtcvs.2020.04.033. Epub 2020 Apr 18. J Thorac Cardiovasc Surg. 2021. PMID: 32402380 No abstract available.
-
Commentary: Smoke or fire? Resected lung cancer in never-smokers.J Thorac Cardiovasc Surg. 2021 Jun;161(6):1919-1920. doi: 10.1016/j.jtcvs.2020.03.096. Epub 2020 Apr 10. J Thorac Cardiovasc Surg. 2021. PMID: 32513486 No abstract available.
-
Commentary: Where there is no smoke, but fire.J Thorac Cardiovasc Surg. 2021 Jun;161(6):1920-1921. doi: 10.1016/j.jtcvs.2020.04.083. Epub 2020 May 1. J Thorac Cardiovasc Surg. 2021. PMID: 32690418 No abstract available.
Similar articles
-
The prognostic impact of the amount of tobacco smoking in non-small cell lung cancer--differences between adenocarcinoma and squamous cell carcinoma.Lung Cancer. 2014 Aug;85(2):125-30. doi: 10.1016/j.lungcan.2014.06.006. Epub 2014 Jun 16. Lung Cancer. 2014. PMID: 24976334
-
The prognostic impact of obstructive lung disease on survival of never smokers with resected non-small-cell lung cancer: a comparison with smokers.Interact Cardiovasc Thorac Surg. 2019 May 1;28(5):735-743. doi: 10.1093/icvts/ivy329. Interact Cardiovasc Thorac Surg. 2019. PMID: 30602039
-
Long-term survival outcomes by smoking status in surgical and nonsurgical patients with non-small cell lung cancer: comparing never smokers and current smokers.Chest. 2010 Sep;138(3):500-9. doi: 10.1378/chest.08-2991. Epub 2010 May 27. Chest. 2010. PMID: 20507946 Free PMC article.
-
Non-small cell lung cancer in never smokers as a representative 'non-smoking-associated lung cancer': epidemiology and clinical features.Int J Clin Oncol. 2011 Aug;16(4):287-93. doi: 10.1007/s10147-010-0160-8. Epub 2011 May 13. Int J Clin Oncol. 2011. PMID: 21562939 Review.
-
The new face of non-small-cell lung cancer in men: Results of two French prospective epidemiological studies conducted 10 years apart.Lung Cancer. 2016 Jan;91:1-6. doi: 10.1016/j.lungcan.2015.11.001. Epub 2015 Nov 15. Lung Cancer. 2016. PMID: 26711927 Review.
Cited by
-
Non-small cell lung cancer in ever-smokers vs never-smokers.BMC Med. 2025 Jan 5;23(1):3. doi: 10.1186/s12916-024-03844-8. BMC Med. 2025. PMID: 39757150 Free PMC article.
-
A Cytoplasm-Enriched circRNA circ-MYBL2 is Downregulated in Non-Small Cell Lung Cancer and Sponges Oncogenic miR-28 to Regulate Cancer Cell Proliferation and Apoptosis.Cancer Manag Res. 2021 Aug 16;13:6499-6506. doi: 10.2147/CMAR.S309924. eCollection 2021. Cancer Manag Res. 2021. Retraction in: Cancer Manag Res. 2021 Nov 15;13:8551-8552. doi: 10.2147/CMAR.S348920. PMID: 34429656 Free PMC article. Retracted.
-
Metagenomic and Transcriptomic Analysis Reveals Crosstalk Between Intratumor Mycobiome and Hosts in Early-Stage Nonsmoking Lung Adenocarcinoma Patients.Thorac Cancer. 2025 Jan;16(2):e15527. doi: 10.1111/1759-7714.15527. Thorac Cancer. 2025. PMID: 39853685 Free PMC article.
-
Sociodemographic and clinical characteristics associated with never-smoking status in patients with lung cancer: findings from a large integrated health system.Transl Cancer Res. 2022 Oct;11(10):3522-3534. doi: 10.21037/tcr-22-1438. Transl Cancer Res. 2022. PMID: 36388017 Free PMC article.
-
Dual Oncological Challenges: Management of Simultaneous Lung Adenocarcinoma and Primary Cardiac Lymphoma.Cureus. 2024 Jun 28;16(6):e63396. doi: 10.7759/cureus.63396. eCollection 2024 Jun. Cureus. 2024. PMID: 39070460 Free PMC article.
References
-
- Yano T, Haro A, Shikada Y, Maruyama R, Maehara Y. Non–small-cell lung cancer in never smokers as a representative “non-smoking-associated lung cancer”: epidemiology and clinical features. Int J Clin Oncol. 2011;16:287–93. - PubMed
-
- Noronha V, Dikshit R, Raut N, Joshi A, Pramesh CS, George K, et al. Epidemiology of lung cancer in India: focus on the differences between non-smokers and smokers: a single-centre experience. Indian J Cancer. 2012;49:74–81. - PubMed
-
- Gandhi L, Rodríguez-Abreu D, Gadgeel S, Esteban E, Felip E, De Angelis F, et al. Pembrolizumab plus chemotherapy in metastatic non–small-cell lung cancer. N Engl J Med. 2018;378:2078–92. - PubMed
E-References
-
- Rajeswaran J, Blackstone EH Identifying risk factors: challenges of separating signal from noise. J Thorac Cardiovasc Surg. 2017;153:1136–8. - PubMed
-
- Breiman L. Bagging predictors. Mach Learn. 1996;24:123–40.
-
- Rubin DB Multiple Imputation for Non-Response in Surveys. New York: Wiley; 1987.
-
- Rosenbaum PR, Rubin DB The central role of the propensity score in observational studies for causal effects. Biometrika. 1983;70:41–55.
-
- Li L, Greene T. A weighting analogue to pair matching in propensity score analysis. Int J Biostat. 2013;9:215–34. - PubMed
Publication types
MeSH terms
Grants and funding
LinkOut - more resources
Full Text Sources
Other Literature Sources
Medical
