Review
. 2020 Aug:74:100894.
doi: 10.1016/j.mam.2020.100894. Epub 2020 Sep 3.

The Atlas of Inflammation Resolution (AIR)

Affiliations
Review

The Atlas of Inflammation Resolution (AIR)

Charles N Serhan et al. Mol Aspects Med. 2020 Aug.

Abstract

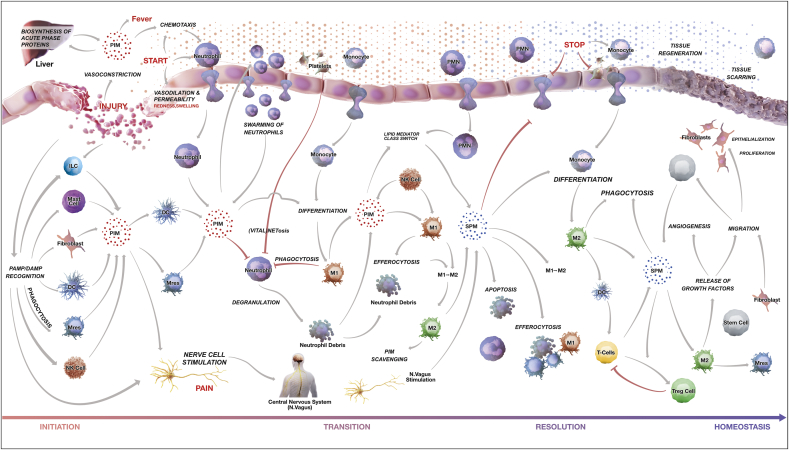
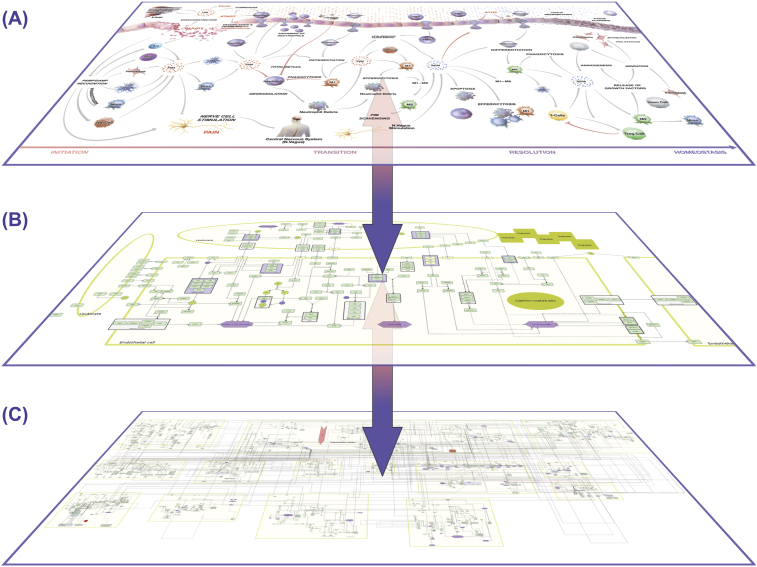
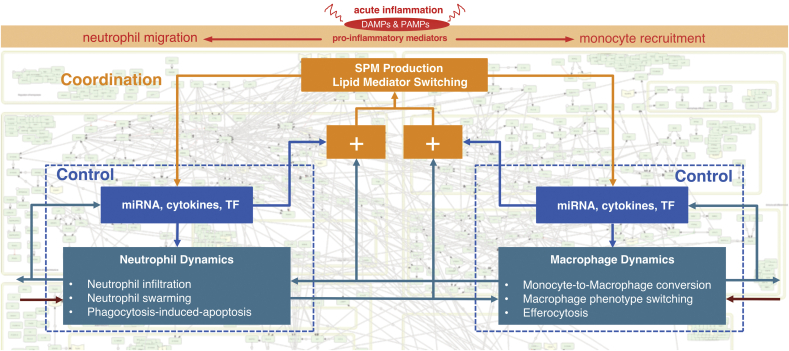
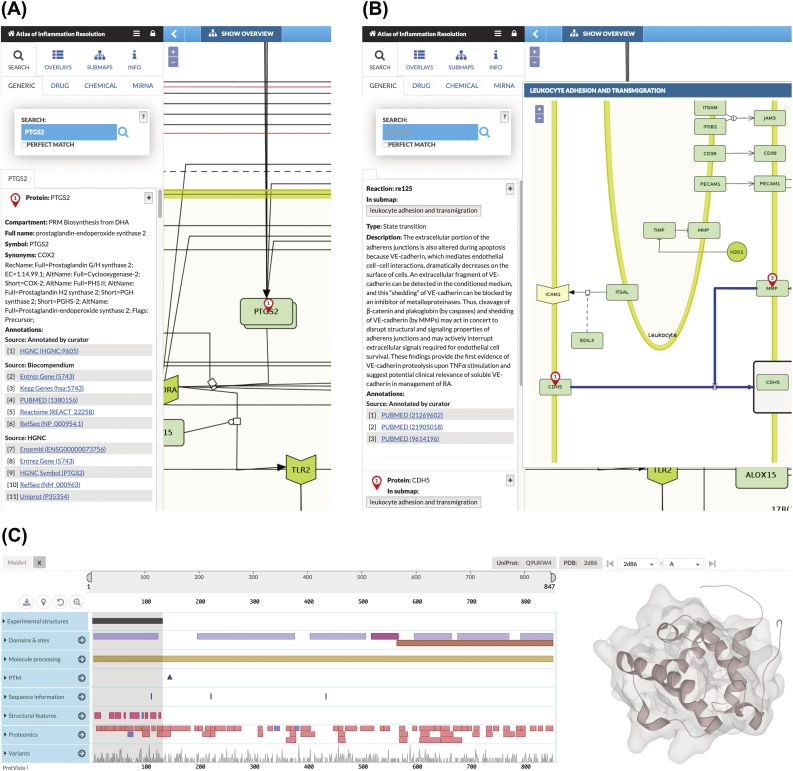
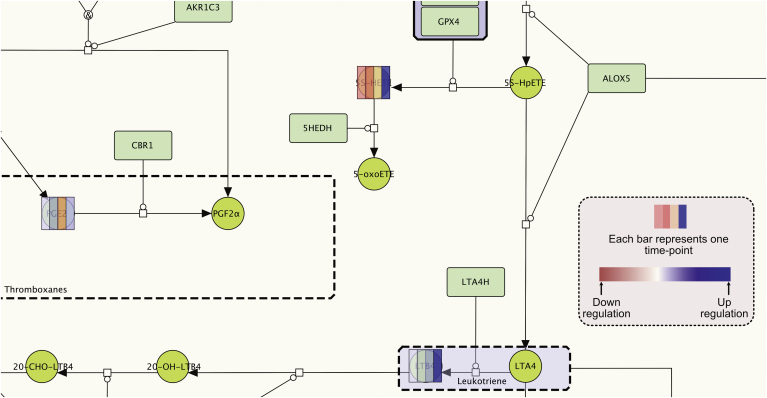
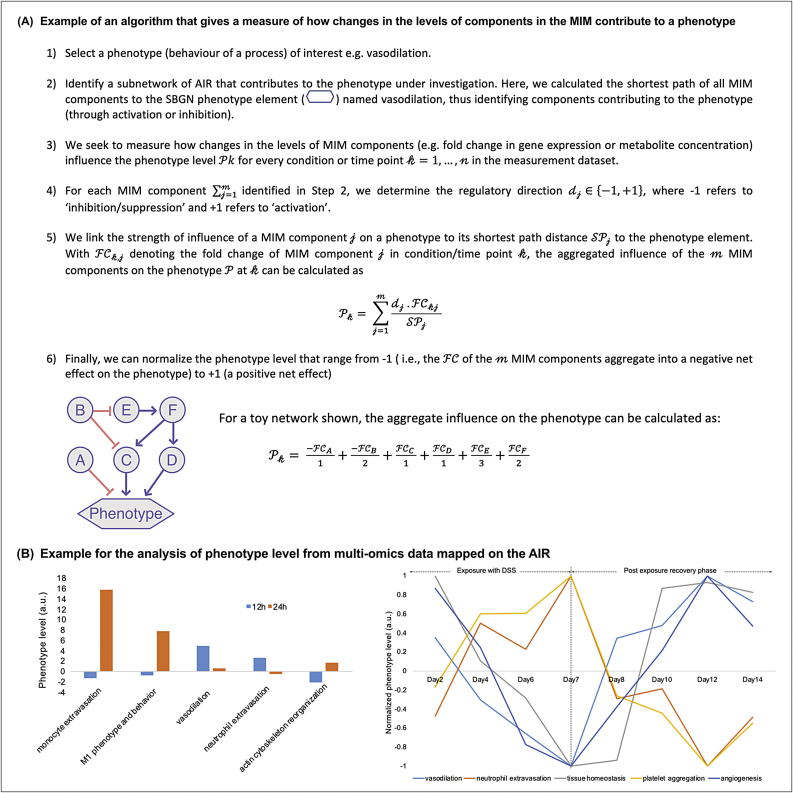
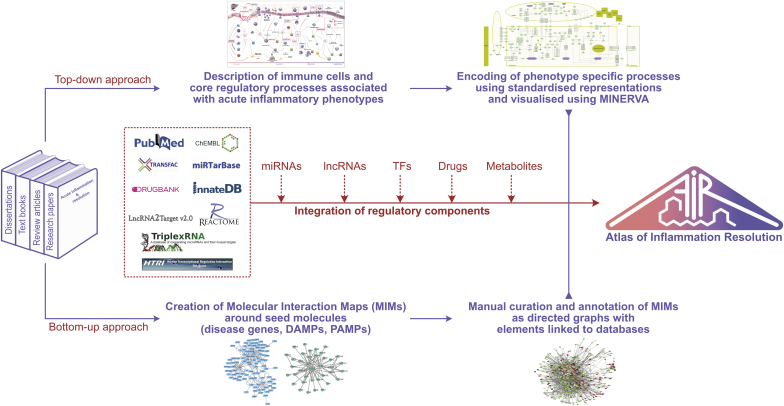
Acute inflammation is a protective reaction by the immune system in response to invading pathogens or tissue damage. Ideally, the response should be localized, self-limited, and returning to homeostasis. If not resolved, acute inflammation can result in organ pathologies leading to chronic inflammatory phenotypes. Acute inflammation and inflammation resolution are complex coordinated processes, involving a number of cell types, interacting in space and time. The biomolecular complexity and the fact that several biomedical fields are involved, make a multi- and interdisciplinary approach necessary. The Atlas of Inflammation Resolution (AIR) is a web-based resource capturing an essential part of the state-of-the-art in acute inflammation and inflammation resolution research. The AIR provides an interface for users to search thousands of interactions, arranged in inter-connected multi-layers of process diagrams, covering a wide range of clinically relevant phenotypes. By mapping experimental data onto the AIR, it can be used to elucidate drug action as well as molecular mechanisms underlying different disease phenotypes. For the visualization and exploration of information, the AIR uses the Minerva platform, which is a well-established tool for the presentation of disease maps. The molecular details of the AIR are encoded using international standards. The AIR was created as a freely accessible resource, supporting research and education in the fields of acute inflammation and inflammation resolution. The AIR connects research communities, facilitates clinical decision making, and supports research scientists in the formulation and validation of hypotheses. The AIR is accessible through https://air.bio.informatik.uni-rostock.de.

Keywords: Acute inflammation; Disease map; Inflammation resolution; Inflammatory mediators; Molecular interaction map; Molecular switches; Pro-resolving mediators; Systems biology.


Conflict of interest statement

The AIR is built from experimentally validated information from the literature, with no information related to products of pharma companies being referred to. All authors declare that there are no competing financial interests that could undermine the objectivity, integrity and value of a publication.

Figures

Fig. 1
Fig. 1
Phenotype level representation of the AIR. The landscape of acute inflammatory response is divided into four overlapping phases: Initiation, transition, resolution and return to tissue homeostasis. Interactions between immune cell types, vascular endothelial cells, mucosal epithelial cells as well as the associated processes and phenotypes are depicted. Arrows indicate information flow. The color of arrows indicates regulation type; gray for activation and red for inhibition. Each process is connected with underlying manually curated and annotated molecular interaction maps. (For interpretation of the references to color in this figure legend, the reader is referred to the Web version of this article.)
Fig. 2
Fig. 2
Hierarchical organization of AIR. (A) The top phenotype layer contains immune cell types, cellular processes/phenotypes and tissue level organization. Clinicians are generally interested in connecting their patient data to this layer. (B) Each process in the top layer is connected to a respective signal flow diagram. The process layer describes key molecules/pathways regulating processes in the top layer. This layer is suitable for research scientists to generate new hypotheses on the mechanistic insights of disease phenotype regulation. (C) The lower layer contains a comprehensive Molecular Interaction Map (MIM) where all the processes are merged together at the molecular level. The layer is also enriched with currently available experimentally validated regulatory information. Each layer provides an opportunity to map and analyze specific data (e.g. Top layer: FACS analysis; middle layer: immune signaling; bottom layer: multi-omics data). Due to the communication across multiple layers, the AIR provides a platform to initiate integrative data analysis.
Fig. 3
Fig. 3
Acute inflammation and inflammation resolution follows the concept of Mesarovic's Interaction Balance Coordination Principle. Two subprocesses (neutrophil dynamics and macrophage dynamics) are controlled by their respective miRNA, cytokines and transcription factors (TF). These subprocesses communicate together in the regulation of phenotype. If there is any imbalance in the desired and actual outputs by these processes (shown by ‘+’ sign, higher level coordination layer (shown here by ‘SPM Production’, ‘Lipid Mediator Switching’) provide signals and make the balance between subprocesses to return to homeostasis. The AIR provides molecular level details of these coordination layers and offers an opportunity to harness these layers for therapeutic purposes.
Fig. 4
Fig. 4
The AIR as a portal to connect public databases. (a) A node ‘PTGS2’ is selected. All the links to various state-of-the-art databases (HGNC, Entrez gene, KEGG gene, PubMed, Reactome, RefSeq, UniProt etc.) along with compartment (AIR submap) information, full name, synonyms are directly available on the left panel. (b) A reaction is selected and the literature from where the reaction is derived is provided as PubMed IDs. Wherever possible, we also summarize the reaction in the context of acute inflammation and inflammation resolution in the description section. (c) Snapshot of MolArt plugin integrated with MINERVA interface. The 3D structure of the CH domain of VAV-3 protein is shown as an example.
Fig. 5
Fig. 5
Mapping of time-series data onto the AIR. Nodes are overlaid with colored bars where each bar indicates the data at a given time point. In this example, log2 concentration fold change values of selected SPM were calculated at 4 time points (0 h, 12 h, 24 h and 48 h) and mapped onto the AIR when mice were challenged with higher titre E. coli (107 c.f.u.) compared to self-resolving E. coli infection (105 c.f.u.) (Chiang et al., 2012). The color gradient from red to blue indicates downregulation and upregulation. The color bars demonstrate that all the pro-inflammatory lipid mediators (PGE2, 5 S-HETE and LTB4) are mostly upregulated from time point 0 h–48 h in response to the stimulus. (For interpretation of the references to color in this figure legend, the reader is referred to the Web version of this article.)
Fig. 6
Fig. 6
Examples using the AIR for bioinformatic analyses. (A) Algorithm to determine the aggregated influence of change in the MIM components on phenotype level. A toy network in the bottom highlights the aggregate influence on the phenotype due to the expression or concentration fold change in the network components A to F. (B) Examples for the analysis of phenotype level from multi-omics data mapped on the AIR. Left: An example where we measure the influence on the phenotype level (a.u.) from MIM components after mapping of miRNA log fold change data from the zymosan-induced peritonitis mouse model treated with/without resolvin D1 (RvD1) at time point 12 h and 24 h (Recchiuti et al., 2011). The bar in the plot indicates influence on the phenotype levels when RvD1 was co-administered. The graph indicates that vasodilation was quickly downregulated which is also supported by the low level of neutrophil extravasation. Other phenotypes (monocyte extravasation; M1 phenotype and behavior; acting cytoskeleton reorganization) were upregulated, suggesting that RvD1 brought the whole systems quickly towards the inflammation resolution phase in comparison to the exposure with zymosan alone. Right: In another example, we highlight the influence of MIM components on various processes associated with the acute inflammation onset and resolution after mapping of time-series transcriptomics profile from mouse colitis model (Czarnewski et al., 2019). The graph indicates normalized phenotype levels (‘vasodilation’, ‘neutrophil extravasation’, ‘tissue homeostasis’, ‘platelet aggregation’, and ‘angiogenesis’) from mouse model exposed with dextran sodium sulfate (DSS) for 7 days to induce acute colitis followed by 7 days of recovery phase. In this study transcriptomics profiling of colon samples were carried out for 9 different timepoints (Day 0, Day 2, Day 4, Day 6, Day 7, Day 8, Day 10, Day 12 and Day 14). Results suggest that the ‘neutrophil extravasation’ and ‘platelet aggregation’ increases until the DSS exposure (i.e. 7days, inflammation initiation phase) followed by sharp decline during the post exposure recovery phase. On the other hand, ‘vasodilation’ increases from day 7–12 (inflammation transition phase) and then a sharp decline in the phenotype was observed suggesting that the system is in inflammation resolution phase.
Fig. 7
Fig. 7
Workflow for the construction of the Atlas of Inflammation Resolution (AIR). The AIR is constructed both bottom-up and top-down. In case of the top-down approach, higher level processes, phenotypes and interplay between immune cells were identified in various stages of acute inflammation. These processes and phenotypes were extended in the form of information flow diagrams in standard SBML notations. In the bottom-up approach, first seed molecules were identified from damage-associated molecular patterns (DAMPs), Pathogen-associated molecular patterns (PAMPs) and key disease genes associated with selected clinical phenotypes of acute inflammation. Each seed molecule is then extended with the experimentally validated interacting partners. Models generated using bottom-up and top-down approaches were later merged and integrated with experimentally validated regulatory layers including transcription factors, miRNAs, lncRNAs, drugs and metabolites to prepare the AIR.

References

    1. Anthony P. Robbins' pathologic basis of disease. Journal of Clinical Pathology. W.B. Saunders, Philadelphia. 1990 doi: 10.1136/jcp.43.2.176-a. fifth ed. - DOI
    1. Bara O., Day J., Djouadi S.M. Proceedings of the IEEE Conference on Decision and Control. 2013. Nonlinear state estimation for complex immune responses; pp. 3373–3378. - DOI
    1. Butcher E.C., Berg E.L., Kunkel E.J. Systems biology in drug discovery. Nat. Biotechnol. 2004;22(10):1253–1259. doi: 10.1038/nbt1017. - DOI - PubMed
    1. Calzone L., Gelay A., Zinovyev A., Radvanyi F., Barillot E. A comprehensive modular map of molecular interactions in RB/E2F pathway. Mol. Syst. Biol. 2008;4:173. doi: 10.1038/msb.2008.7. - DOI - PMC - PubMed
    1. Chiang N., Fredman G., Bäckhed F., Oh S.F., Vickery T., Schmidt B.A., Serhan C.N. Infection regulates pro-resolving mediators that lower antibiotic requirements. Nature. 2012;484(7395):524–528. doi: 10.1038/nature11042. - DOI - PMC - PubMed

Publication types

Substances