Review
. 2021 Feb;20(2):e12698.
doi: 10.1111/gbb.12698. Epub 2020 Oct 19.

A long non-coding RNA (Lrap) modulates brain gene expression and levels of alcohol consumption in rats

Affiliations
Review

A long non-coding RNA (Lrap) modulates brain gene expression and levels of alcohol consumption in rats

Laura M Saba et al. Genes Brain Behav. 2021 Feb.

Abstract

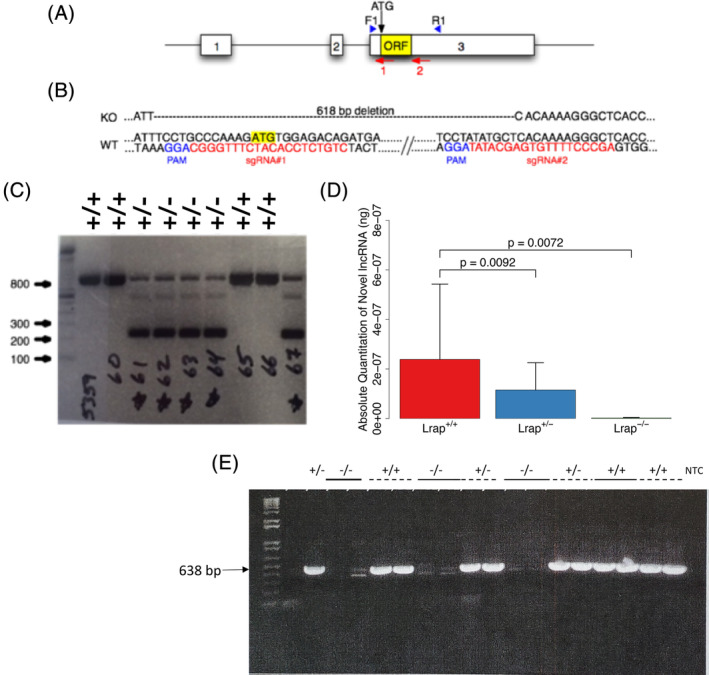
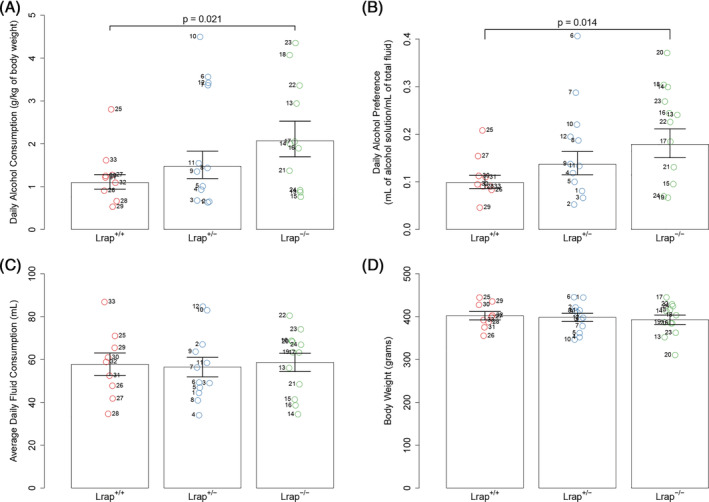
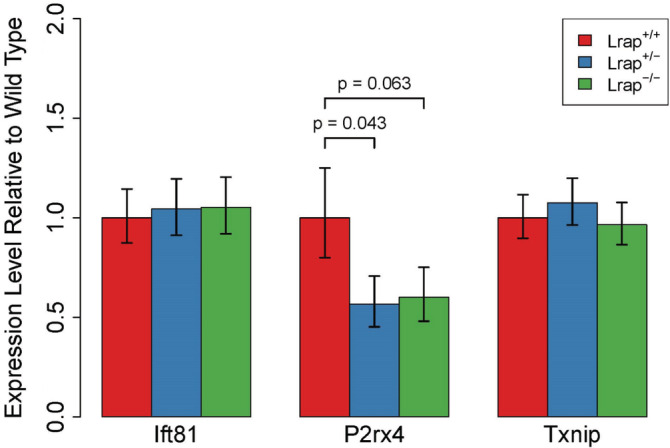
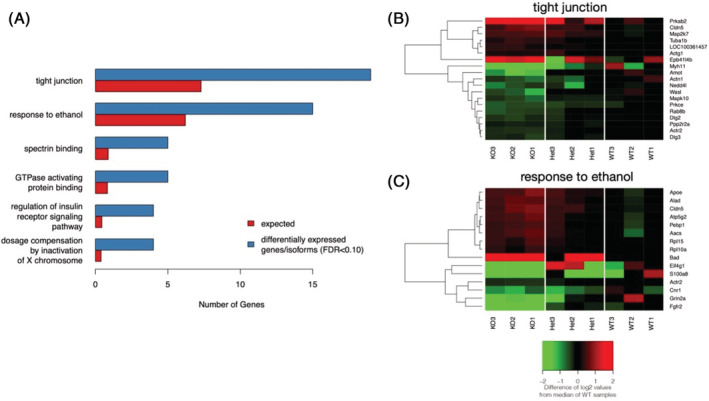
LncRNAs are important regulators of quantitative and qualitative features of the transcriptome. We have used QTL and other statistical analyses to identify a gene coexpression module associated with alcohol consumption. The "hub gene" of this module, Lrap (Long non-coding RNA for alcohol preference), was an unannotated transcript resembling a lncRNA. We used partial correlation analyses to establish that Lrap is a major contributor to the integrity of the coexpression module. Using CRISPR/Cas9 technology, we disrupted an exon of Lrap in Wistar rats. Measures of alcohol consumption in wild type, heterozygous and knockout rats showed that disruption of Lrap produced increases in alcohol consumption/alcohol preference. The disruption of Lrap also produced changes in expression of over 700 other transcripts. Furthermore, it became apparent that Lrap may have a function in alternative splicing of the affected transcripts. The GO category of "Response to Ethanol" emerged as one of the top candidates in an enrichment analysis of the differentially expressed transcripts. We validate the role of Lrap as a mediator of alcohol consumption by rats, and also implicate Lrap as a modifier of the expression and splicing of a large number of brain transcripts. A defined subset of these transcripts significantly impacts alcohol consumption by rats (and possibly humans). Our work shows the pleiotropic nature of non-coding elements of the genome, the power of network analysis in identifying the critical elements influencing phenotypes, and the fact that not all changes produced by genetic editing are critical for the concomitant changes in phenotype.

Keywords: CRISPR/Cas; brain RNA expression networks; genetic modification; long non-coding RNA; predisposing factors; quantitative genetics; recombinant inbred rat strains; systems genetics; transcriptome; voluntary alcohol consumption.


Figures

FIGURE 1
FIGURE 1
Lrap−/− rat strategy and characterization. (A) Diagram of Lrap locus illustrating exons (numbered white boxes), the potential open reading frame (yellow ORF box), the putative start codon (ATG), sgRNA target sites (numbered red arrows) and the location of the forward and reverse PCR genotyping primers (blue arrowheads). (B) Partial Lrap wild type (Lrap+/+) and knockout (Lrap−/−) rat genomic DNA sequence. In red are the sgRNA target sequences used for CRISPR/Cas9 gene targeting. The CRISPR protospacer adjacent motifs (PAM) are shown in blue. The yellow highlighted ATG is the putative start codon. Note that the Lrap−/− sequence harbors a 618 bp deletion. (C) Lrap PCR genotype analysis. Ethidium bromide stained agarose gel of Lrap PCR products from Lrap wild type (Lrap+/+) and Lrap+/− rats. Ladder is in bp. (D) Validation of differences in Lrap RNA expression using qRT‐PCR. RNA expression levels of exons 1–3 in rat brains are reported as absolute quantity (n = 3/genotype). This PCR product is undetectable in the Lrap−/− rats, since the exon 3 primer (Exon 3 R1) targets the excised region of exon 3. 14 All statistical analyses were done on the log transformed data and results are reported based on the back transformation of mean values and mean values plus one standard error. All p values were calculated using a one‐way ANOVA with post hoc pairwise comparisons. (E) qRT‐PCR products from Lrap+/+, Lrap+/− and Lrap−/− rats. Ethidium bromide stained agarose gel of products from qRT‐PCR of naïve Lrap+/+, Lrap+/− and Lrap−/− rats, using primers for exons 1 and 3: Exon 1 F2‐Exon 3 R1. 14 With the exception of the first lane (+/−), all other samples are run as duplicates
FIGURE 2
FIGURE 2
Effect of Lrap on alcohol consumption in genetically modified rats. Alcohol consumption by male rats (n = 9–12 rats/genotype) from the three genotypes (Lrap+/+, Lrap+/−, and Lrap−/−) was determined using the two‐bottle choice paradigm with 10% ethanol solution. Circles represent values for individual rats. Each point is labeled with a number to facilitate access to raw data if needed. For alcohol consumption and alcohol preference, means ±1 standard error from the linear mixed model on log transformed values were transformed back to the original scale and reported in the graphic. For all four outcomes, post hoc pairwise comparisons were made between all three groups and only comparisons with a p value less than 0.05 are reported. (A) Alcohol consumption in grams per kilogram of body weight. (B) Alcohol preference measured as the volume of alcohol solution divided by the total volume of fluids consumed. (C) Average daily fluid consumption in milliliters. No significant (p < 0.05) differences among genotypes were found. (D) Body weight in grams. There were no significant differences in body weight (p < 0.05) among genotypes
FIGURE 3
FIGURE 3
qRT‐PCR validation of difference in mRNA expression of genes from the alcohol consumption candidate module. The expression levels of three of the transcripts most highly connected to the hub transcript (Lrap) were assessed in brains of alcohol naive male Lrap wild type (+/+), Lrap heterozygous (+/−) and Lrap knockout (−/−) rats (n = 3) by qRT‐PCR. All statistical analyses were done on the delta Ct data and results are reported based on the transformation of mean values and mean values plus one standard error. All p values were calculated using a linear model (Ift81, P2rx4, Txnip) with post hoc pairwise comparisons
FIGURE 4
FIGURE 4
Functional enrichment of KEGG pathways and Gene Ontology (GO) terms in transcripts differentially expressed between Lrap knockout and wild type rat brains. Genes associated with isoforms and/or SOI that were differentially expressed (FDR < 0.10) were included. The background data set for enrichment include genes with at least one isoform and/or SOI that was expressed in brain and tested for differential expression. (A) Terms and pathways enriched for isoforms/SOI whose expression levels were altered by the genetic manipulation of Lrap. All pathways/terms included in the figure: (1) contained 3 or more differentially expressed isoform/SOI, (2) meet a significance threshold of an FDR <0.10, and (3) had a fold enrichment (observed number of differentially expressed genes divided by the number of differentially expressed genes expected by chance) of at least 2. Fifteen GO terms met all three criteria but only the top 5 (by p value) are included in the graphic for simplicity. Differentially expressed isoforms/SOI associated with the (B) Tight Junction KEGG pathway or associated with the (C) Response to Ethanol GO term. Expression values are represented in this heatmap as the difference in log2 transformed and library size adjusted read counts for a sample and the median of this transformed read count in the wild type rats
FIGURE 5
FIGURE 5
Regions of the mouse and human genome homologous to the region of the rat genome that contains Lrap. The entire genomic sequence of Lrap, that is, including introns, from the rat was compared with the mouse genome and the human genome. (A) Alignment of the Lrap genomic sequence to the human genome. The green blocks in the first track denote areas of homology in the human DNA sequence. The numeric label on each box corresponds to a row in (F). The intensity of the green color is related to the percent identity of the two sequences. The area highlighted in gray designates the homologous region of the human genome that was deleted in the rat. The second track 'GENCODE v29 Comprehensive Transcript Set (+ only)' contains an annotated human transcript, AC145422.1, produced from the same strand that is homologous to the Lrap sequence in this region. (B) Alignment of the Lrap genomic sequence to the mouse genome. The green blocks in the first track denote areas of homology in the mouse DNA sequence. The numeric label on each box corresponds to a row in (G). The intensity of the green color is related to the percent identity of the two sequences. The area highlighted in gray designates the homologous region of the mouse genome that was deleted in the rat. The second track 'GENCODE VM20 Comprehensive Transcript Set (+ only)' contains an annotated mouse transcript, A930024E05Rik, produced from the same strand that is homologous to the Lrap sequence in this region. (C) Human and mouse homologous sequences mapped onto the rat genome. The first track, 'Human Alignment', highlights the regions of the rat genome that are homologous to the human genome using the same coloring and labeling as in (A). The second track, 'Mouse Alignment', highlights the regions of the rat genome that are homologous to the mouse genome using the same coloring and labeling as in (B). The third track, 'Lrap', contains the original structure of Lrap derived from the transcriptome reconstruction in the SHR and BN‐Lx brain RNASeq data in blue and the region of Lrap that was eliminated in the knockout rats in red. Please note that the homologous regions have been superimposed and intervening regions are not to the same scale. In addition, since Lrap was transcribed from the negative strand in rat but is homologous to regions on the positive strand in both human and mouse, the orientation of (C) has been flipped so that the first exon of Lrap is on the left and the last exon of Lrap is on the right. (D) Genetic variants within the genomic area of Lrap. This panel provides information on polymorphisms (SNPs and indels) distinguishing the Wistar Kyoto rat strain and the related SHR rat strain from the BN rat strain (reference strain). This illustration also indicates the indels and SNPs that disrupt the possible ORF in the BN sequence. (E) RNA expression in human of Lrap locus. The genomic area depicted in this panel covers chr12:121,579,800–121,593,949 bp of the human genome (hg38). The first track 'GENCODE v29 Comprehensive Transcript Set (+ only)' contains an annotated human transcript, AC145422.1, produced from the plus strand. The second track 'LRAP (WKY rn6) alignment to Human' includes regions of human genome that are homologous to the region of the rat genome that produces the Lrap transcript. The intensity of the green color is related to the percent identity of the two sequences. The area highlighted in gray designates the homologous region of the human genome that was deleted in the rat. The third and final track 'GM12878 ENCODE/CSHL PolyA‐ (+ strand)' indicates the number of RNASeq reads that align to the region. RNASeq reads generated by the ENCODE/Cold Spring Harbor Lab were derived from long polyA‐ sequence of the GM12878 cell line and are publicly available through the UCSC Genome Browser and through the Gene Omnibus Database (GEO Accession: GSM758572). (F) Summary of Lrap alignment to the human genome contains additional detail, including percent homology, about the alignment of Lrap to the human genome. The numeric labels on the rows correspond to the green blocks in (A) with the same label. (G) Summary of Lrap alignment to the mouse genome contains additional detail, including percent homology, about the alignment of Lrap to the mouse genome. The numeric labels on the rows correspond to the green blocks in (B) with the same label

References

    1. Ernst C, Morton CC. Identification and function of long non‐coding RNA. Front Cell Neurosci. 2013;7:168. - PMC - PubMed
    1. Sun Q, Hao Q, Prasanth KV. Nuclear Long noncoding RNAs: key regulators of gene expression. Trends Genet. 2018;34(2):142‐157. - PMC - PubMed
    1. Vance KW, Ponting CP. Transcriptional regulatory functions of nuclear long noncoding RNAs. Trends Genet. 2014;30(8):348‐355. - PMC - PubMed
    1. Romero‐Barrios N, Legascue MF, Benhamed M, Ariel F, Crespi M. Splicing regulation by long noncoding RNAs. Nucleic Acids Res. 2018;46(5):2169‐2184. - PMC - PubMed
    1. Long Y, Wang X, Youmans DT, Cech TR. How do IncRNAs regulate transcription? Sci Adv. 2017;3:eaao2110. - PMC - PubMed

Publication types

Substances