Fxr1 regulates sleep and synaptic homeostasis
- PMID: 32893934
- PMCID: PMC7604579
- DOI: 10.15252/embj.2019103864
Fxr1 regulates sleep and synaptic homeostasis
Abstract
The fragile X autosomal homolog 1 (Fxr1) is regulated by lithium and has been GWAS-associated with schizophrenia and insomnia. Homeostatic regulation of synaptic strength is essential for the maintenance of brain functions and involves both cell-autonomous and system-level processes such as sleep. We examined the contribution of Fxr1 to cell-autonomous homeostatic synaptic scaling and neuronal responses to sleep loss, using a combination of gene overexpression and Crispr/Cas9-mediated somatic knockouts to modulate gene expression. Our findings indicate that Fxr1 is downregulated during both scaling and sleep deprivation via a glycogen synthase kinase 3 beta (GSK3β)-dependent mechanism. In both conditions, downregulation of Fxr1 is essential for the homeostatic modulation of surface AMPA receptors and synaptic strength. Preventing the downregulation of Fxr1 during sleep deprivation results in altered EEG signatures. Furthermore, sequencing of neuronal translatomes revealed the contribution of Fxr1 to changes induced by sleep deprivation. These findings uncover a role of Fxr1 as a shared signaling hub between cell-autonomous homeostatic plasticity and system-level responses to sleep loss, with potential implications for neuropsychiatric illnesses and treatments.
Keywords: Fxr1; allostatic load; scaling; sleep deprivation; synaptic homeostasis.
© 2020 The Authors. Published under the terms of the CC BY NC ND 4.0 license.
Conflict of interest statement
The authors declare that they have no conflict of interest.
Figures

- A, B
Western blot analysis of Fxr1 during (A), TTX (48 h treatment) induced upscaling (n = 6 in each condition) and (B), BIC (48 h treatment) induced downscaling (n = 8 in each condition) of primary postnatal cortical cultures. Student's t‐test *P < 0.05, ***P < 0.001.
- C, D
Western blot analysis of (C), Fxr2 (Veh n = 8, TTX n = 8) and (D), Fmrp (Veh n = 10, TTX n = 12) during upscaling, Student's t‐test *P < 0.05.
- E–G
RT–qPCR measurement of mRNA for (E), Fxr1, (F), Fxr2, (G), and Fmr1 during upscaling. n = 4 in each condition, Student's t‐test *P < 0.05.
- H
Western blot analysis for Fxr1, pGsk3α/β, Gsk3α/β, and GAPDH in neuronal cultures treated with 1 μM TTX (TTX) or 1 mM LiCI (Li) or 1 mM NaCI (Ctrl) for 48 h.
- I
Expression of Fxr1 protein in TTX (n = 5) and Li (n = 5) conditions relative to Ctrl (n = 6) condition. One‐way ANOVA with Dunnett's multiple comparison test *P < 0.05, **P < 0.01, ***P < 0.001.
- J
Expression of pGsk3β/Gsk3β or pGsk3α/Gsk3α in TTX (n = 5) and Li (n = 5) conditions relative to Ctrl (n = 6) condition. One‐way ANOVA with Dunnett's multiple comparison test *P < 0.05, **P < 0.01, ***P < 0.001.

Schematic of high‐efficiency infection of neuronal cultures by AAV1 viruses followed by detection of AMPA receptor subunits.
Western blot analysis of total GluA1 expression in Ctrl or Fxr1 overexpression (Fxr1) condition during upscaling (Ctrl/Veh n = 5, Ctrl/TTX n = 5, Fxr1/Veh n = 6, Fxr1/Veh n = 6). One‐way ANOVA with Dunnett's multiple comparison test ***P < 0.001.
Western blot analysis of total GluA1 expression in Ctrl or Fxr1 over condition during downscaling (Ctrl/Veh n = 4, Ctrl/TTX n = 4, Fxr1/Veh n = 4, Fxr1/Veh n = 4).
RT–qPCR measurement of Gria1 mRNA in Ctrl or Fxr1 over condition during upscaling (Ctrl/Veh n = 3, Ctrl/TTX n = 3, Fxr1/Veh n = 3, Fxr1/Veh n = 3). One‐way ANOVA with Bonferroni's multiple comparison test ***P < 0.001.
Schematic representation of tagging of luciferase cDNA with 5′UTR, 1–900CDS, 900–1,800CDS, 1,800–2,700CDS, and 3′UTR of GluA1 gene.
Measurement of relative luciferase signal after co‐transfection of different tagged luciferase constructs along with GFP (Ctrl) or GFP‐Fxr1 (Fxr1) plasmids. n = 5 in each condition, Student's t‐test *P < 0.05, ***P < 0.001.
Immunostaining for surface GluA1 in GFP (Ctrl) or GFP‐Fxr1 (Fxr1 over)‐infected cultures after treatment with Veh, TTX, or BIC for 48 h.
Percentage of surface GluA1 relative to the mean of Ctrl/Veh condition (Ctrl condition: Veh n = 63, TTX n = 34, BIC n = 29, Fxr1 condition: Veh n = 56, TTX n = 30, BIC n = 29). One‐way ANOVA with Bonferroni's multiple comparison test *P < 0.05, **P < 0.01, ***P < 0.001.
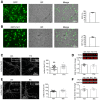
- A, B
Quantification of the % of infection by (A) AAV1 Syn GFP (n = 3) or (B) AAV1 Syn GFP‐Fxr1 (n = 3).
- C
Surface expression of GluA2 during upscaling (Veh n = 28, TTX n = 29).
- D
Expression of total GluA2 during upscaling (Veh n = 7, TTX n = 6).
- E
Surface expression of GluA2 during downscaling (Veh n = 18, BIC n = 18).
- F
Expression of total GluA2 during downscaling (Veh n = 4, BIC n = 4).
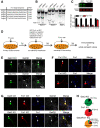
- A
Fxr1 targeting gRNA sequences and corresponding protospacer adjacent motifs (PAMs).
- B
Evaluation of Fxr1 targeting sgRNAs by SURVEYOR assay 2 days after transfection of sgRNAs and SpCas9 (asterisks indicate the presence of digested bands).
- C
Western blot analysis and quantification of Gsk3β and Fxr1 expression in Neuro2A cells 7 days after transfection of CRISPR/Cas9 constructs (Ctrl n = 6, Fxr1KO n = 7, Student's t‐test, ***P < 0.001). Bars and error bars are mean ± SEM.
- D
Schematic representation of low‐efficiency transfection of primary neuronal cultures with various plasmids.
- E–G
Evaluation of CRISPR/Cas9 KO of (E) Gsk3b, (F) Fxr1, and (G) Gsk3b/Fxr1 in primary neuronal cultures by immunostaining. Arrows indicate presence and arrowheads absence of staining.
- H
Quantification of CRISPR/Cas9 KO of Gsk3b and Fxr1.
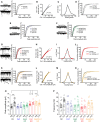
- A
Cumulative probability plots of mEPSC amplitude (500 events per cell) and representative examples of mEPSCs (left panel) recorded from cultured cortical control neurons after 48 h of 1 μM TTX or Veh exposure (Ctrl/Veh n = 16 and Ctrl/TTX n = 17).
- B
A linear fit of Ctrl/TTX and Ctrl/Veh amplitudes.
- C
The degrees of overlap between Ctrl/TTX and Ctrl/Veh data were assessed using various scaling factors. The largest nonsignificant P‐value was obtained with 1.47 scaling factor.
- D
Cumulative probability plots of the mEPSC amplitude of Ctrl/Veh, Ctrl/TTX, and Ctrl/TTX divided by scaling factor 1.47, which yielded the maximum overlap with Ctrl/Veh data.
- E–G
Cumulative probability plots of mEPSC amplitude (500 events per cell) and representative examples of mEPSCs (left panel) recorded from cultured cortical neurons after 48 h of 1 μM TTX or Veh exposure, (E) Fxr1 overexpressing neurons (Fxr1/Veh n = 10 and Fxr1/TTX n = 8), (F) Gsk3 KO neurons (Gsk3KO/Veh n = 10 and Gsk3KO/TTX n = 11), (G) Fxr1 KO neurons (Fxr1KO/Veh n = 16 and Fxr1KO/TTX n = 8).
- H
A linear fit of Fxr1 KO/Veh and Ctrl/Veh amplitudes.
- I
The degrees of overlap between Fxr1 KO/Veh and Ctrl/Veh data were assessed using various scaling factors. The largest nonsignificant P‐value was obtained with 1.27 scaling factor.
- J
Cumulative probability plots of the mEPSC amplitude of Ctrl/Veh, Fxr1 KO/Veh, and Fxr1 KO/Veh divided by scaling factor 1.27, which yielded the maximum overlap with Ctrl/Veh data.
- K
Cumulative probability plots of mEPSC amplitude (500 events per cell) and representative examples of mEPSCs (left panel) recorded from cultured cortical Gsk3 and Fxr1 KO neurons after 48 h of 1 μM TTX or Veh exposure (Gsk3/Fxr1KO/Veh n = 8 and Gsk3/Fxr1KO/TTX n = 11).
- M
A linear fit of Gsk3/Fxr1 KO/Veh and Ctrl/Veh amplitudes.
- N
The degrees of overlap between Gsk3/Fxr1 KO/Veh and Ctrl/Veh data were assessed using various scaling factors. The largest nonsignificant P‐value was obtained with 1.68 scaling factor.
- O
Cumulative probability plots of the mEPSC amplitude of Ctrl/Veh, Gsk3/Fxr1 KO/Veh, and Gsk3/Fxr1 KO/Veh divided by scaling factor 1.68, which yielded the maximum overlap with Ctrl/Veh data.
- P
mEPSC mean amplitude of cultured cortical neurons after 48 h of 1 μM TTX or Veh exposure. One‐way ANOVA with Bonferroni's multiple comparison test *P < 0.05, **P < 0.01, ***P < 0.001.
- Q
mEPSC frequency of cultured cortical neurons after 48 h of 1 μM TTX or Veh exposure.

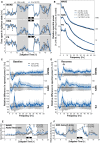
- A
Hourly distribution of wakefulness (WAKE), slow‐wave sleep (SWS), and paradoxical sleep (PS) during a 24‐h baseline (BL) recording and a second 24‐h starting with 6‐h sleep deprivation (SD) (recovery: REC) in Ctrl and Fxr1 overexpressing (Fxr1) mice. Significant group‐by-hour interactions were found for wakefulness during BL (F 23,230 = 1.67, P = 0.046) and REC (F 23,230 = 2.83, P = 0.0029), for SWS during BL (F 23,230 = 1.66, P = 0.045) and REC (F 23,230 = 2.89, P = 0.0028), and for PS during REC (F 16,160 = 2.54, P = 0.0018, two‐way ANOVA Huynh–Feldt‐corrected, *P < 0.05).
- B
Power spectra for WAKE, SWS, and PS in Ctrl and Fxr1 mice computed between 0.75 and 50 Hz per 0.25‐Hz for the full 24 h of BL and REC.
- C, D
The spectral activity of Fxr1 mice expressed relative to that of Ctrl mice for WAKE, SWS, and PS during (C) the 24‐h BL and (D) the 24‐h REC. A significant difference between groups was found for the frequency band 8–11.75 Hz during wakefulness (t = 2.30, P = 0.044 Student's t‐test *P < 0.05).
- E
Time course of wakefulness spectral activity ratio between low alpha (8.5–10.5 Hz) and low theta (4–6 Hz) during BL and REC in Ctrl and Fxr1 mice. A significant group‐by-interval interaction was found for REC (F 22,220 = 1.96, two‐way ANOVA Huynh–Feldt‐corrected; *P < 0.05) and also when using BL and REC intervals of the light periods (F 16,160 = 3.11, P < 0.01).
- F
Time course of SWS relative delta activity during BL and REC in Ctrl and Fxr1 mice. A significant group‐by-interval interaction was found during REC (F 13,130 = 1.89, two‐way ANOVA Huynh–Feldt‐corrected; *P < 0.05).

Immunostaining of GFP on coronal slices showing the infected area in one EEG/EMG-implanted control mouse (Ctrl) and one with Fxr1 overexpression (Fxr1 over). Scale bar = 500 μm.
Time spent in wakefulness (WAKE), slow‐wave sleep (SWS), and paradoxical sleep (PS) during the 12‐h light and the 12‐h dark periods of the baseline recording and of the following day starting with a 6‐h sleep deprivation (SD) (recovery) in Ctrl and Fxr1 over mice. Significant differences between groups were found for wakefulness during the 12‐h dark period for both baseline (group‐by-period interaction: F 1,10 = 6.9, P = 0.025; *planned comparison for the 12‐h dark P = 0.048) and recovery (group‐by-period interaction: F 1,10 = 7.4, P = 0.022; *planned comparison for the dark P = 0.02), and for SWS during the 12‐h dark period for both baseline (interaction: F 1,10 = 5.9, P = 0.035; *planned comparison for the 12‐h dark P = 0.043) and recovery (interaction: F 1,10 = 8.2, P = 0.017; *planned comparison for the dark P = 0.015) Statistical tests are two‐way ANOVA and Student's t‐test for planned comparisons. Error bars are SEM). Dark backgrounds indicate 12‐h dark periods.
Average duration of individual bouts of WAKE, SWS, and PS during the 12‐h light and 12‐h dark periods of the baseline and recovery recordings in Ctrl and Fxr1 over mice. Significant differences between groups were found for SWS during baseline (main group effect: F 1,10 = 5.9, *P = 0.036, two‐way ANOVA, error bars are SEM). Dark backgrounds indicate 12‐h dark periods.
Number of individual bouts of WAKE, SWS, and PS during the 12‐h light and the 12‐h dark periods of the baseline and recovery recordings in Ctrl and Fxr1 over mice. No significant difference was found. Error bars are SEM. Dark backgrounds indicate 12‐h dark periods.
Time course of wakefulness low alpha and low theta activity during baseline and recovery in Ctrl and Fxr1over mice. Error bars are SEM. Dark backgrounds indicate 12‐h dark periods.

- A
Schematic representation of sleep deprivation (SD) experiments. Zeitgeber time 0 (ZT0) corresponding to lights ON.
- B–E
Western blot analysis of (B) p845GluA1 and GluA1 expression (S n = 9, SD n = 10), (C) p880GluA2 and GluA2 expression (S n = 9, SD n = 8), (D) Fxr1 expression (S n = 11, SD n = 10), and (E) Fmrp expression (S n = 11, SD n = 10) in the prefrontal cortex of sleeping and sleep‐deprived mice. Student's t‐test *P < 0.05, **P < 0.01, ***P < 0.001.
- F–H
RNAseq measurement of mRNA for (F) Fxr1, (G) Fxr2, and (H) Fmr1 during SD. n = 3 in each condition, Student's t‐test *P < 0.05.

- A
Schematic representation of viral infection and sleep deprivation (SD) experiments. Zeitgeber time 0 (ZT0) corresponding to lights ON.
- B–D
Cumulative probability plots of mEPSC amplitude (500 events per cell) and representative examples of mEPSCs (left panel) recorded from brain slices of S and SD mice. (B) Control neurons (Ctrl/S n = 8 cells/4 mice and Ctrl/SD n = 8 cells/4 mice), (C) Fxr1 overexpressing (Fxr1/S n = 7 cells/5 mice and Fxr1 over/SD n = 9 cells/5 mice), and (D) Gsk3 sKO (Gsk3sKO/S n = 6 cells/3 mice and Gsk3sKO/SD n = 7 cells/4 mice).
- E, F
mEPSC (E) mean amplitude and (F) frequency of cortical neurons of S or SD mice. Control neurons (Ctrl/S n = 8 cells/4 mice and Ctrl/SD n = 8 cells/4 mice), Fxr1 overexpressing (Fxr1/S n = 7 cells/5 mice and Fxr1 over/SD n = 9 cells/5 mice), and Gsk3 sKO (Gsk3sKO/S n = 6 cells/3 mice and Gsk3sKO/SD n = 7 cells/4 mice). Student's t‐test *P < 0.05.
- G
Representative examples of the current–voltage relationship of evoked EPSC amplitude recorded from S (top panel) and SD (bottom panel) mice.
- H
Summary bar graphs showing rectification index of control (S n = 12 cells/5 mice and SD n = 10 cells/5 mice), Fxr1P overexpressing (S n = 9 cells/4 mice and SD n = 14 cells/4 mice), and Gsk3 sKO (S n = 9 cells/3 mice and SD n = 9 cells/3 mice) neurons. One‐way ANOVA with Bonferroni's multiple comparison *P < 0.05.
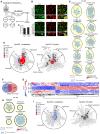
Schematic representation of the experimental design. Zeitgeber time 0 (ZT0) corresponding to lights ON.
Immunostaining for GFP and HA in Ctrl and Fxr1 mouse brain slices. Arrows indicate presence and arrowheads indicate an absence of GFP‐tagged Fxr1 granules.
Quantification of colocalization of GFP and HA‐labeled neurons (GFP+HA + 71.3% ± 3.7, n = 3, GFP‐Fxr1 + HA + 79.7% ± 2.8, n = 3).
Enrichment of differentially expressed transcripts from Ctrl/S vs. Ctrl/SD comparison in GO:BP. Top 10 clusters with the most number of enriched pathways (nodes) are shown.
SynGO enrichment for synaptic localization and function of differentially expressed transcripts from Ctrl/S vs. Ctrl/SD comparison.
Venn diagram showing overlap of differentially expressed transcripts between Ctrl/S vs. Ctrl/SD and Ctrl/SD vs. Fxr1 overexpression (Fxr1)/SD comparisons.
Heat map showing transcripts that have bidirectional expression changes between Ctrl/S, Ctrl/SD, and Fxr1/SD conditions.
Enrichment of commonly affected transcripts between Ctrl/S vs. Ctrl/SD and Ctrl/SD vs. Fxr1/SD comparisons in GO:BP.
SynGO enrichment for synaptic localization and function of commonly affected transcripts between Ctrl/S vs. Ctrl/SD and Ctrl/SD vs. Fxr1 over/SD comparisons.
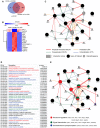
Venn diagram showing overlap of differentially expressed transcripts between Ctrl/S vs. Ctrl/SD and Ctrl/SD vs. Fxr1/SD comparisons.
Heat map showing that all transcripts have bidirectional expression changes between Ctrl/S, Ctrl/SD, and Fxr1/SD conditions.
GeneMANIA algorithm showing interaction network of the most significant 14 transcripts commonly affected by Fxr1 and SD.
Enrichment of GeneMANIA interaction network transcripts in GO:BP.
Graphical representation of the interaction network and pathway enrichment.
References
-
- Areal CC, Warby SC, Mongrain V (2017) Sleep loss and structural plasticity. Curr Opin Neurobiol 44: 1–7 - PubMed
-
- Arrubla J, Farrher E, Strippelmann J, Tse DHY, Grinberg F, Shah NJ, Neuner I (2017) Microstructural and functional correlates of glutamate concentration in the posterior cingulate cortex. J Neurosci Res 95: 1796–1808 - PubMed
-
- Beaulieu JM, Gainetdinov RR, Caron MG (2009) Akt/GSK3 signaling in the action of psychotropic drugs. Annu Rev Pharmacol Toxicol 49: 327–347 - PubMed
Publication types
MeSH terms
Substances
Associated data
- Actions
Grants and funding
LinkOut - more resources
Full Text Sources
Molecular Biology Databases

