Quantitative multiplex immunofluorescence analysis identifies infiltrating PD1+ CD8+ and CD8+ T cells as predictive of response to neoadjuvant chemotherapy in breast cancer
- PMID: 32894006
- PMCID: PMC7529566
- DOI: 10.1111/1759-7714.13639
Quantitative multiplex immunofluorescence analysis identifies infiltrating PD1+ CD8+ and CD8+ T cells as predictive of response to neoadjuvant chemotherapy in breast cancer
Abstract
Background: This study aimed to explore the potentially predictive role and dynamic changes of immune checkpoints on T cell subsets in patients with breast cancer receiving neoadjuvant chemotherapies.
Methods: Fluorescent multiplex immunohistochemistry (mIHC) was used to stain CD4, CD8, PD1, TIM3, and cytokeratins simultaneously in paired breast cancer samples before and after neoadjuvant therapies (NAT) in a prospective cohort (n = 50). Singleplex IHC was conducted to stain for CD3 in 100 cases with inclusion of extra retrospective 50 cases. Cell levels were correlated with clinicopathological parameters and pathological complete response (pCR).
Results: In pretreatment tumors, the percentages of infiltrating CD8+ , PD1+ , PD1+ CD8+ , and the ratio of PD1+ CD8+ /CD8+ cells, were higher in pCR than non-pCR patients in either the stromal or intratumoral area, but PD1+ CD4+ , TIM3+ CD4+ , TIM3+ CD8+ cells and CD4+ /CD8+ ratio was not. Multivariate analyses showed that the percentage of intratumoral CD8+ cells (OR, 1.712; 95% CI: 1.052-2.786; P = 0.030) and stromal PD1+ CD8+ /CD8+ ratio (OR, 1.109; 95% CI: 1.009-1.218; P = 0.032) were significantly associated with pCR. Dynamically, reduction in the percentages of PD1+ , CD8+ and PD1+ CD8+ cells after therapy strongly correlated with pCR. Notably, incremental percentages of PD1+ CD8+ cells, rather than TIM3+ CD8+ , were shown in tumors from non-pCR patients after NAT. CD3 staining confirmed the percentage of T cells were associated with pCR.
Conclusions: PD1+ CD8+ rather than TIM3+ CD8+ cells are main predictive components within tumor-infiltrating T cells in NAT breast cancer patients. Dynamically incremental levels of PD1+ CD8+ cells occurred in non-pCR cases after NAT, suggesting the combination of chemotherapy with PD1 inhibition might benefit these patients.
Key points: SIGNIFICANT FINDINGS OF THE STUDY: PD1+ CD8+ , rather than TIM3+ CD8+ , T cells are the main component to predict the response of neoadjuvant therapies in breast cancer.
What this study adds: Incremental levels of PD1+ CD8+ T cells in non-pCR post-NAT tumors suggest PD1 inhibition might benefit in the neoadjuvant setting.
Keywords: Breast cancer; PD1; T cell; neoadjuvant chemotherapy; tumor-infiltrating lymphocytes.
© 2020 The Authors. Thoracic Cancer published by China Lung Oncology Group and John Wiley & Sons Australia, Ltd.
Figures

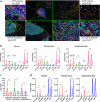
 ) PD+, (
 ) CD8+, (
 ) PD1+CD8+, (
 ) PD1+CD8+/CD8+; (d) (
 ) TIM3+CD4+, (
 ) TIM3+CD8+, (
 ) TIM3+CD8+/CD8+
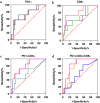
 ) AUC = 0.706, P = 0.052, (
 ) AUC = 0.750, P = 0.037, (
 ) AUC = 0.725, P = 0.067; (
 ) Intratumoral, (
 ) Stromal, (
 ) Whole tumor. (b) (
 ) AUC = 0.822, P = 0.007, (
 ) AUC = 0.629, P = 0.194, (
 ) AUC = 0.675, P = 0.096; (
 ) Intratumoral, (
 ) Stromal, (
 ) Whole tumor. (c) (
 ) AUC = 0.636, P = 0.410, (
 ) AUC = 0.779, P = 0.013, (
 ) AUC = 0.775, P = 0.014; (
 ) Intratumoral, (
 ) Stromal, (
 ) Whole tumor. (d) (
 ) AUC = 0.575, P = 0.561, (
 ) AUC = 0.839, P = 0.005, (
 ) AUC = 0.793, P = 0.014; (
 ) Intratumoral, (
 ) Stromal, (
 ) Whole tumor.
 ) PD1+ (
 ) CD8+ (
 ) PD1+CD8+ (
 ) PD1+CD8+/CD8+. (b) (
 ) PD1+ (
 ) CD8+ (
 ) PD1+CD8+ (
 ) PD1+CD8+/CD8+. (c) (
 ) PD1+ (
 ) CD8+ (
 ) PD1+CD8+ (
 ) PD1+CD8+/CD8+. (d) (
 ) TIM3+CD4+ (
 ) TIM3+CD8+ (
 ) TIM3+CD8+/CD8+.
Similar articles
-
Immune cell composition and functional marker dynamics from multiplexed immunohistochemistry to predict response to neoadjuvant chemotherapy in the WSG-ADAPT-TN trial.J Immunother Cancer. 2021 May;9(5):e002198. doi: 10.1136/jitc-2020-002198. J Immunother Cancer. 2021. PMID: 33963012 Free PMC article. Clinical Trial.
-
Association Between Expression Level of PD1 by Tumor-Infiltrating CD8+ T Cells and Features of Hepatocellular Carcinoma.Gastroenterology. 2018 Dec;155(6):1936-1950.e17. doi: 10.1053/j.gastro.2018.08.030. Epub 2018 Aug 24. Gastroenterology. 2018. PMID: 30145359
-
Tumor Immune Microenvironment and Response to Neoadjuvant Chemotherapy in Hormone Receptor/HER2+ Early Stage Breast Cancer.Clin Breast Cancer. 2022 Aug;22(6):538-546. doi: 10.1016/j.clbc.2022.04.002. Epub 2022 Apr 18. Clin Breast Cancer. 2022. PMID: 35610143 Free PMC article.
-
Tumor-infiltrating lymphocytes in patients with HER2-positive breast cancer treated with neoadjuvant chemotherapy plus trastuzumab, lapatinib or their combination: A meta-analysis of randomized controlled trials.Cancer Treat Rev. 2017 Jun;57:8-15. doi: 10.1016/j.ctrv.2017.04.005. Epub 2017 May 2. Cancer Treat Rev. 2017. PMID: 28525810 Review.
-
Breast Cancer Patients: Who Would Benefit from Neoadjuvant Chemotherapies?Curr Oncol. 2022 Jul 12;29(7):4902-4913. doi: 10.3390/curroncol29070389. Curr Oncol. 2022. PMID: 35877249 Free PMC article. Review.
Cited by
-
Neoadjuvant chemotherapy for breast cancer: an evaluation of its efficacy and research progress.Front Oncol. 2023 Oct 3;13:1169010. doi: 10.3389/fonc.2023.1169010. eCollection 2023. Front Oncol. 2023. PMID: 37854685 Free PMC article. Review.
-
The clinicopathological significance and relapse predictive role of tumor microenvironment of intrahepatic cholangiocarcinoma after radical surgery.Cancer. 2023 Feb 1;129(3):393-404. doi: 10.1002/cncr.34552. Epub 2022 Nov 26. Cancer. 2023. PMID: 36433731 Free PMC article.
-
Double-Multiplex Immunostainings for Immune Profiling of Invasive Breast Carcinoma: Emerging Novel Immune-Based Biomarkers.Int J Mol Sci. 2025 Mar 21;26(7):2838. doi: 10.3390/ijms26072838. Int J Mol Sci. 2025. PMID: 40243442 Free PMC article. Review.
-
Components of the tumor immune microenvironment based on m-IHC correlate with prognosis and subtype of triple-negative breast cancer.Cancer Med. 2023 Dec;12(24):21639-21650. doi: 10.1002/cam4.6718. Epub 2023 Dec 7. Cancer Med. 2023. PMID: 38059408 Free PMC article.
-
SPCS: a spatial and pattern combined smoothing method for spatial transcriptomic expression.Brief Bioinform. 2022 May 13;23(3):bbac116. doi: 10.1093/bib/bbac116. Brief Bioinform. 2022. PMID: 35380614 Free PMC article.
References
-
- Berruti A, Amoroso V, Gallo F et al Pathologic complete response as a potential surrogate for the clinical outcome in patients with breast cancer after neoadjuvant therapy: A meta‐regression of 29 randomized prospective studies. J Clin Oncol 2014; 32 (34): 3883–91. 10.1200/JCO.2014.55.2836. - DOI - PubMed
Publication types
MeSH terms
LinkOut - more resources
Full Text Sources
Medical
Research Materials

