

Sequence diversity of cytotoxic T cell antigens and satellite marker analysis of Theileria parva informs the immunization against East Coast fever in Rwanda
- PMID: 32894166
- PMCID: PMC7487574
- DOI: 10.1186/s13071-020-04322-9
Sequence diversity of cytotoxic T cell antigens and satellite marker analysis of Theileria parva informs the immunization against East Coast fever in Rwanda
Abstract
Background: East Coast fever (ECF) caused by Theileria parva is endemic in Rwanda. In this study, the antigenic and genetic diversity of T. parva coupled with immunization and field challenge were undertaken to provide evidence for the introduction of ECF immunization in Rwanda.
Methods: Blood collected from cattle in the field was screened for T. parva using ELISA and PCR targeting the p104 gene. Tp1 and Tp2 gene sequences were generated from field samples and from Gikongoro and Nyakizu isolates. Furthermore, multilocus genotype data was generated using 5 satellite markers and an immunization challenge trial under field conditions using Muguga cocktail vaccine undertaken.
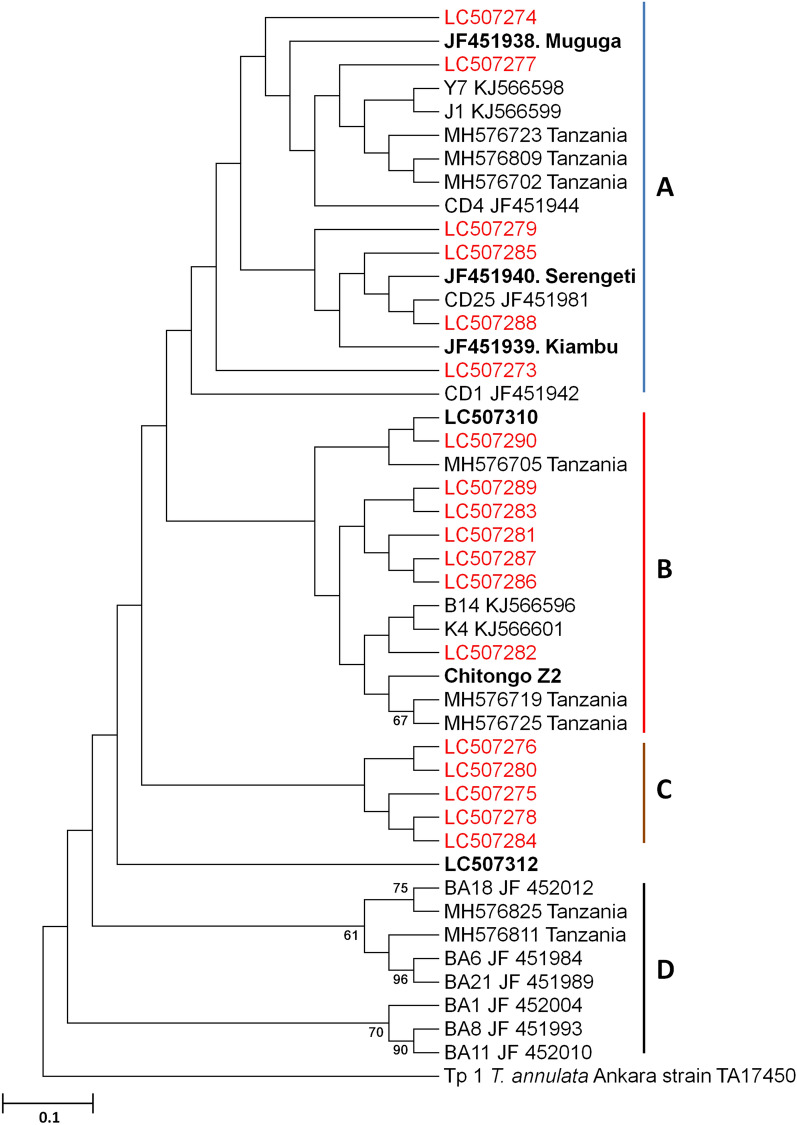
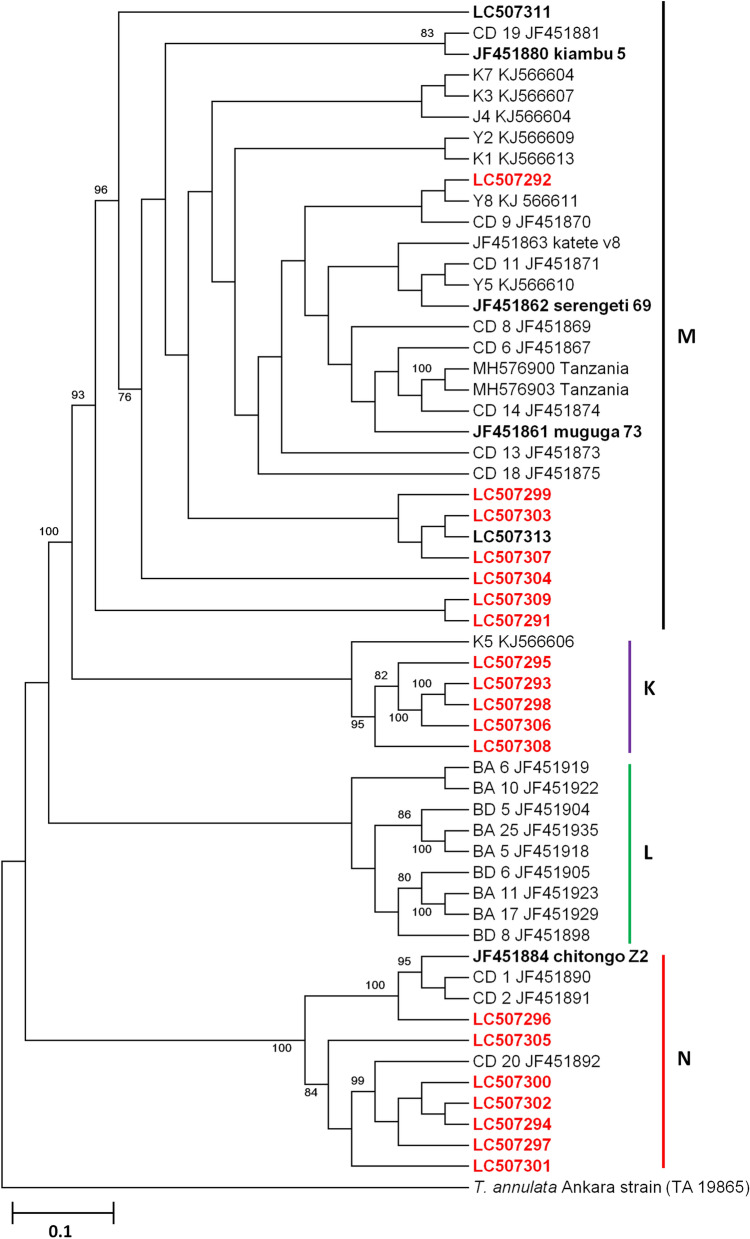
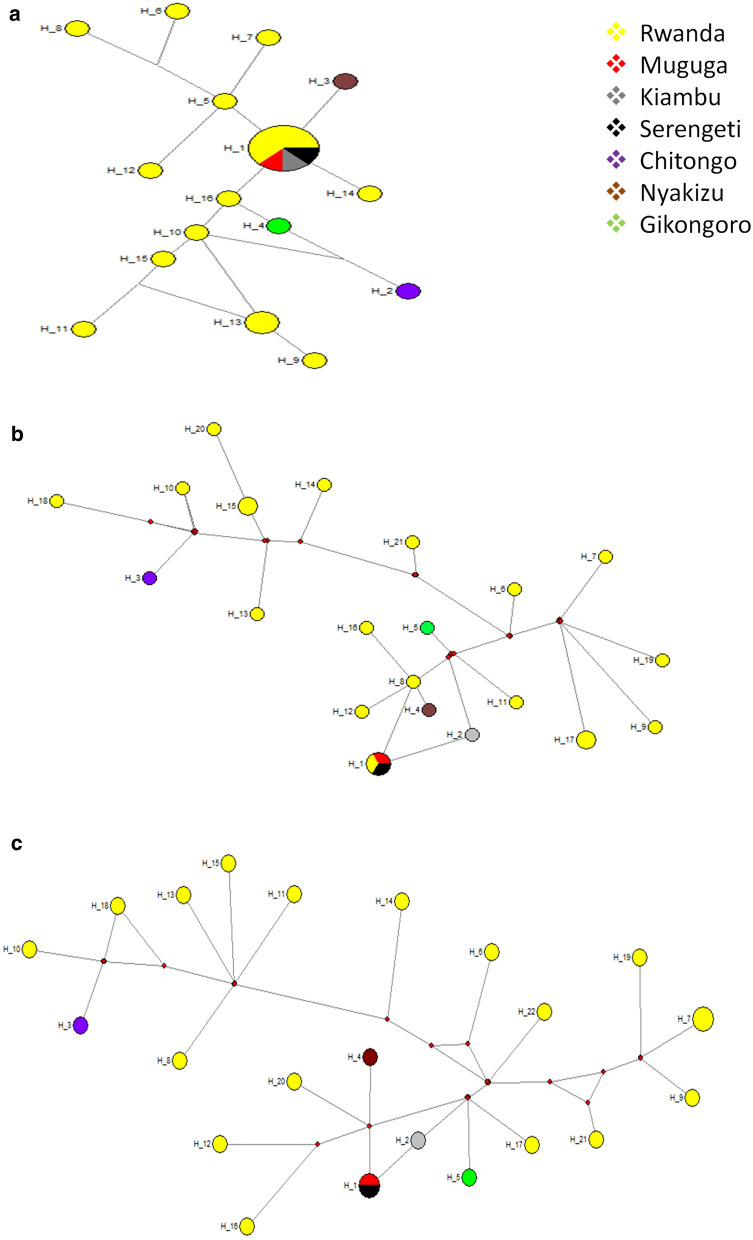
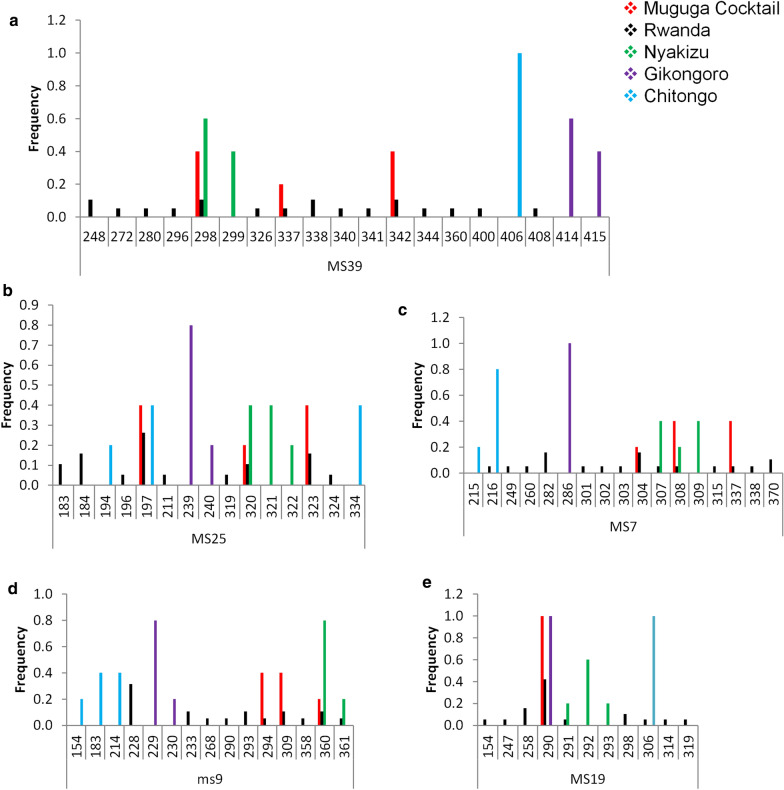
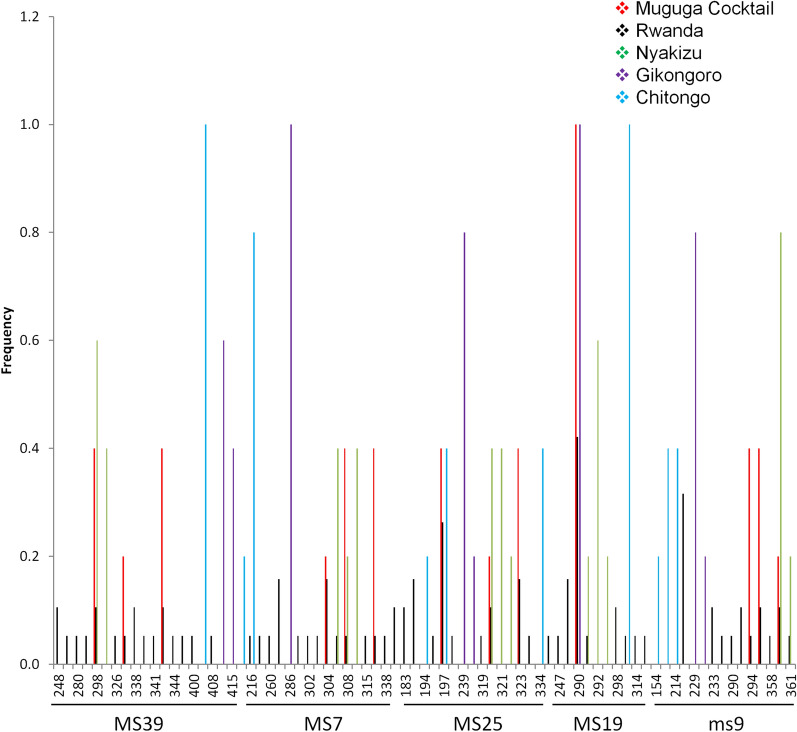
Results: Out of 120 samples, 44 and 20 were positive on ELISA and PCR, respectively. Antigenic diversity of the Tp1 and Tp2 gene sequences revealed an abundance of Muguga, Kiambu and Serengeti epitopes in the samples. A further three clusters were observed on both Tp1 and Tp2 phylogenetic trees; two clusters comprising of field samples and vaccine isolates and the third cluster comprising exclusively of Rwanda samples. Both antigens exhibited purifying selection with no positive selection sites. In addition, satellite marker analysis revealed that field samples possessed both shared alleles with Muguga cocktail on all loci and also a higher proportion of unique alleles. The Muguga cocktail (Muguga, Kiambu and Serengeti) genotype compared to other vaccine isolates, was the most represented in the field samples. Further low genetic sub-structuring (FST = 0.037) coupled with linkage disequilibrium between Muguga cocktail and the field samples was observed. Using the above data to guide a field immunization challenge trial comprising 41 immunized and 40 control animals resulted in 85% seroconversion in the immunized animals and an efficacy of vaccination of 81.7%, implying high protection against ECF.
Conclusions: Antigenic and genetic diversity analysis of T. parva facilitated the use of Muguga cocktail vaccine in field conditions. A protection level of 81.7% was achieved, demonstrating the importance of combining molecular tools with field trials to establish the suitability of implementation of immunization campaigns. Based on the information in this study, Muguga cocktail immunization in Rwanda has a potential to produce desirable results.
Keywords: ECF; Immunization; Muguga cocktail; Sub-structuring; Theileria parva; Tp1; Tp2.
Conflict of interest statement
The authors declare that they have no competing interests.
Figures

References
-
- Norval RAI, Perry BD, Young AS. The epidemiology of theileriosis in Africa. London: Academic Press; 1992.
-
- Minjauw B, McLeod BA. Tick-borne diseases and poverty. The impact of ticks and tick-borne diseases on thelivelihoods of small-scale and marginal livestock owners in India and eastern and southern Africa. UK: Research Report, DFID Animal Health Programme, Centre for Tropical Veterinary Medicine, University of Edinburgh; 2003. pp 124
-
- GALVmed. GALVmed & East Coast Fever. The CTTBD ECF vaccine: greater opportunity to control East Coast fever and other tick-borne diseases in Africa. Pentlands Science Park, Bush Loan, Edinburgh; 2010.
-
- Gettinby G. The epidemiology of theileriosis in Africa. Parasitol Today. 1993;9:272. doi: 10.1016/0169-4758(93)90075-Q. - DOI
-
- National Institute of Statistics of Rwanda (NISR). 2017. http://www.statistics.gov.rw/publication/statistical-yearbook-2017. Accessed 27 Aug 2019
MeSH terms
Substances
Grants and funding
LinkOut - more resources
Full Text Sources
Medical
Miscellaneous
