

Alterations of peripheral nerve excitability in an experimental autoimmune encephalomyelitis mouse model for multiple sclerosis
- PMID: 32894170
- PMCID: PMC7487851
- DOI: 10.1186/s12974-020-01936-9
Alterations of peripheral nerve excitability in an experimental autoimmune encephalomyelitis mouse model for multiple sclerosis
Abstract
Background: Experimental autoimmune encephalomyelitis (EAE) is the most commonly used and clinically relevant murine model for human multiple sclerosis (MS), a demyelinating autoimmune disease characterized by mononuclear cell infiltration into the central nervous system (CNS). The aim of the present study was to appraise the alterations, poorly documented in the literature, which may occur at the peripheral nervous system (PNS) level.
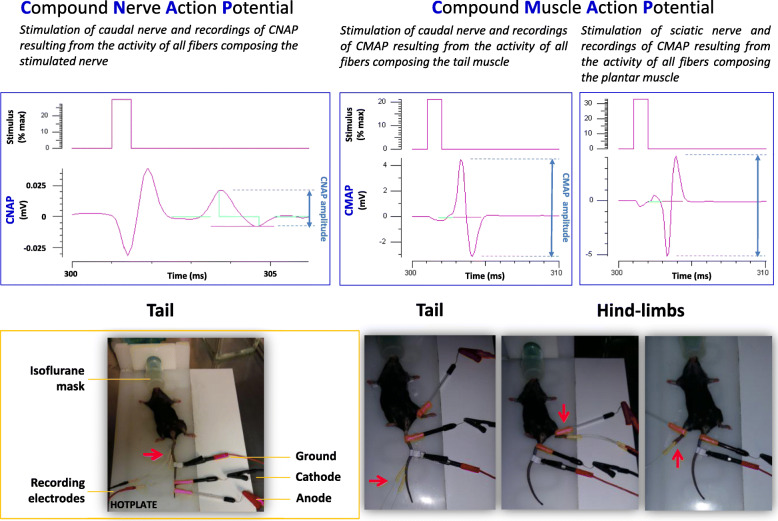
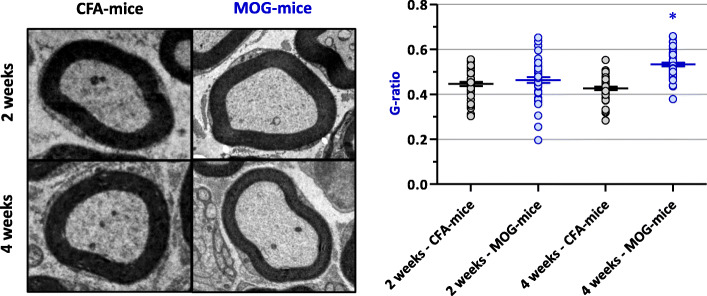
Methods: To this purpose, a multiple evaluation of peripheral nerve excitability was undertaken, by means of a minimally invasive electrophysiological method, in EAE mice immunized with the myelin oligodendrocyte glycoprotein (MOG) 35-55 peptide, an experimental model for MS that reproduces, in animals, the anatomical and behavioral alterations observed in humans with MS, including CNS inflammation, demyelination of neurons, and motor abnormalities. Additionally, the myelin sheath thickness of mouse sciatic nerves was evaluated using transmission electronic microscopy.
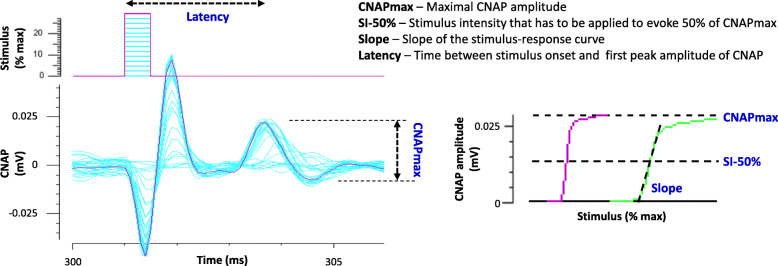
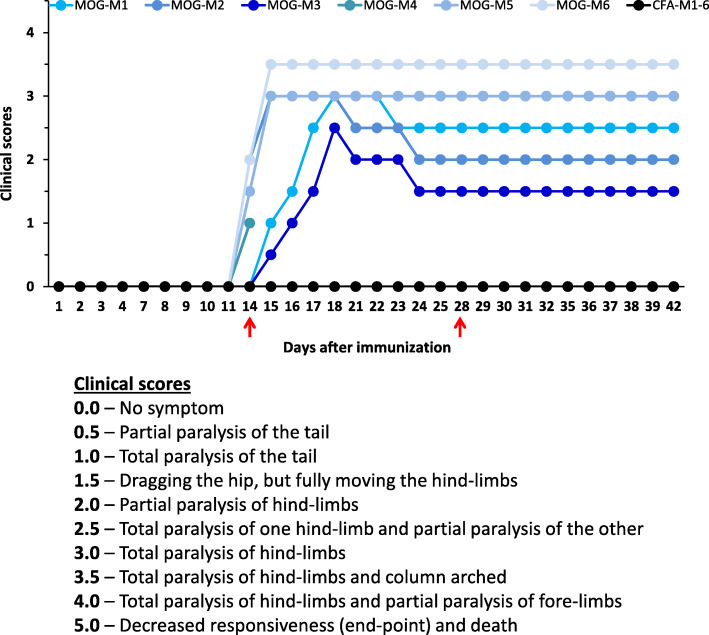
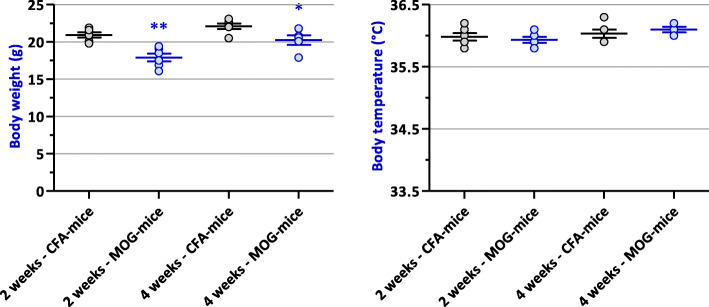
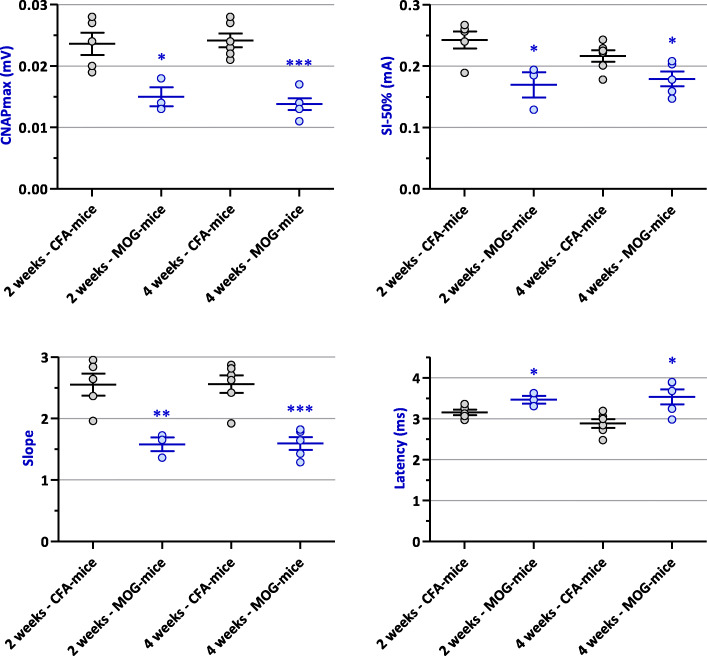
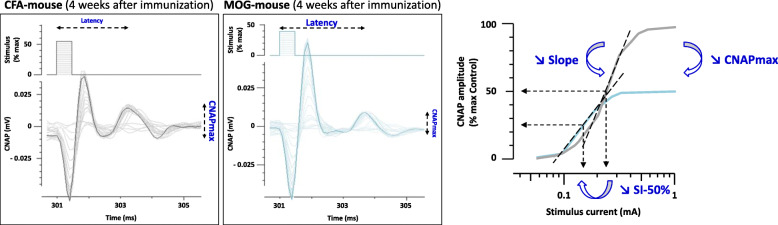
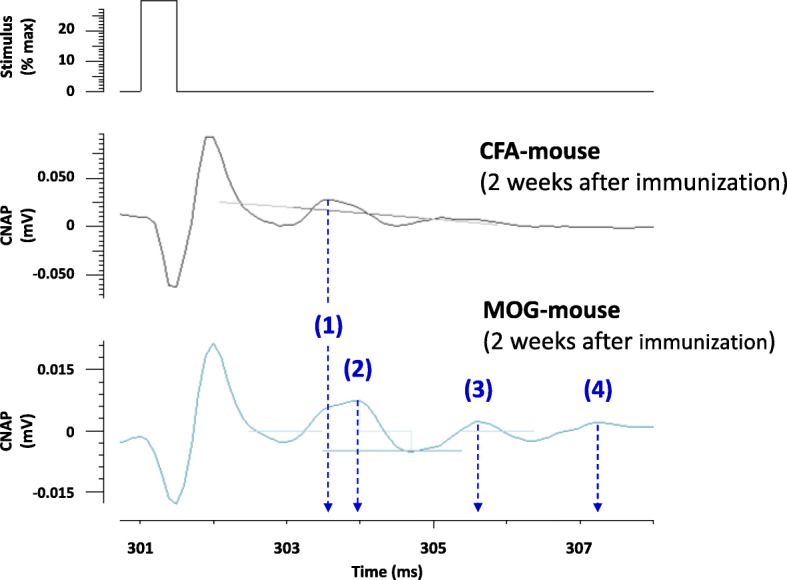
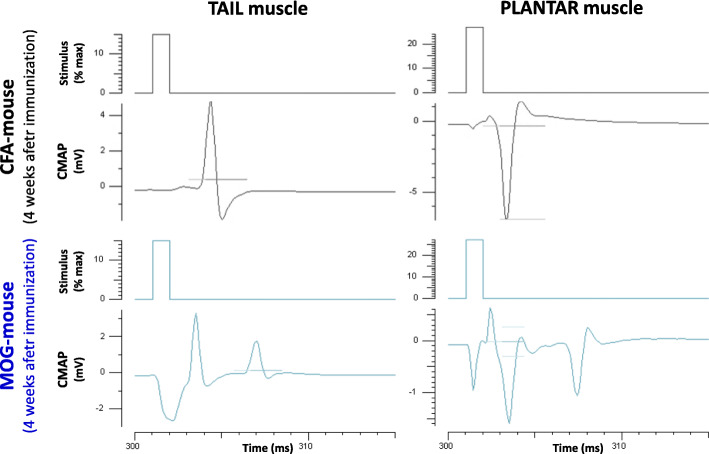
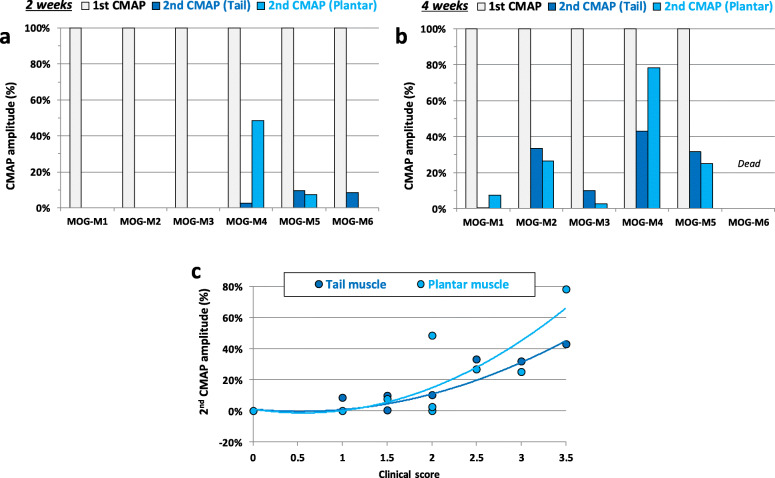
Results: As expected, the mean clinical score of mice, daily determined to describe the symptoms associated to the EAE progression, increased within about 18 days after immunization for EAE mice while it remained null for all control animals. The multiple evaluation of peripheral nerve excitability, performed in vivo 2 and 4 weeks after immunization, reveals that the main modifications of EAE mice, compared to control animals, are a decrease of the maximal compound action potential (CAP) amplitude and of the stimulation intensity necessary to generate a CAP with a 50% maximum amplitude. In addition, and in contrast to control mice, at least 2 CAPs were recorded following a single stimulation in EAE animals, reflecting various populations of sensory and motor nerve fibers having different CAP conduction speeds, as expected if a demyelinating process occurred in the PNS of these animals. In contrast, single CAPs were always recorded from the sensory and motor nerve fibers of control mice having more homogeneous CAP conduction speeds. Finally, the myelin sheath thickness of sciatic nerves of EAE mice was decreased 4 weeks after immunization when compared to control animals.
Conclusions: In conclusion, the loss of immunological self-tolerance to MOG in EAE mice or in MS patients may not be only attributed to the restricted expression of this antigen in the immunologically privileged environment of the CNS but also of the PNS.
Keywords: Electrophysiology; Experimental autoimmune encephalomyelitis; Mouse; Multiple sclerosis; Myelin oligodendrocyte glycoprotein; Neuromuscular junction; Peripheral nervous system.
Conflict of interest statement
The authors declare that they have no competing interests.
Figures
Similar articles
-
Time-Dependent Progression of Demyelination and Axonal Pathology in MP4-Induced Experimental Autoimmune Encephalomyelitis.PLoS One. 2015 Dec 11;10(12):e0144847. doi: 10.1371/journal.pone.0144847. eCollection 2015. PLoS One. 2015. PMID: 26658811 Free PMC article.
-
Non-invasive visual evoked potentials to assess optic nerve involvement in the dark agouti rat model of experimental autoimmune encephalomyelitis induced by myelin oligodendrocyte glycoprotein.Brain Pathol. 2020 Jan;30(1):137-150. doi: 10.1111/bpa.12762. Epub 2019 Jul 28. Brain Pathol. 2020. PMID: 31267597 Free PMC article.
-
Cathepsin C modulates myelin oligodendrocyte glycoprotein-induced experimental autoimmune encephalomyelitis.J Neurochem. 2019 Feb;148(3):413-425. doi: 10.1111/jnc.14581. Epub 2018 Dec 3. J Neurochem. 2019. PMID: 30152001
-
T- and B-cell responses to myelin oligodendrocyte glycoprotein in experimental autoimmune encephalomyelitis and multiple sclerosis.Glia. 2001 Nov;36(2):220-34. doi: 10.1002/glia.1111. Glia. 2001. PMID: 11596130 Review.
-
The role of myelin oligodendrocyte glycoprotein in autoimmune demyelination: a target for multiple sclerosis therapy?Expert Opin Ther Targets. 2012 May;16(5):451-62. doi: 10.1517/14728222.2012.677438. Epub 2012 Apr 12. Expert Opin Ther Targets. 2012. PMID: 22494461 Review.
Cited by
-
Crotalphine Attenuates Pain and Neuroinflammation Induced by Experimental Autoimmune Encephalomyelitis in Mice.Toxins (Basel). 2021 Nov 22;13(11):827. doi: 10.3390/toxins13110827. Toxins (Basel). 2021. PMID: 34822611 Free PMC article.
-
Naringenin: A Promising Immunomodulator for Anti-inflammatory, Neuroprotective and Anti-cancer Applications.Antiinflamm Antiallergy Agents Med Chem. 2025;24(1):1-25. doi: 10.2174/0118715230320007240708074939. Antiinflamm Antiallergy Agents Med Chem. 2025. PMID: 39076091 Review.
-
Anti-contact protein-associated protein 2 antibody encephalitis in children: A case report.World J Clin Cases. 2024 Jul 16;12(20):4365-4371. doi: 10.12998/wjcc.v12.i20.4365. World J Clin Cases. 2024. PMID: 39015900 Free PMC article.
-
Translocator Protein Ligand PIGA1138 Reduces Disease Symptoms and Severity in Experimental Autoimmune Encephalomyelitis Model of Primary Progressive Multiple Sclerosis.Mol Neurobiol. 2022 Mar;59(3):1744-1765. doi: 10.1007/s12035-022-02737-2. Epub 2022 Jan 11. Mol Neurobiol. 2022. PMID: 35018577
-
Optic Neuritis Leading to Vision Loss: A Case of MOG-Associated Disease with Successful Immunotherapy.Am J Case Rep. 2024 Jul 15;25:e943112. doi: 10.12659/AJCR.943112. Am J Case Rep. 2024. PMID: 39054886 Free PMC article.
References
-
- Sloane E, Ledeboer A, Seibert W, Coats B, van Strien M, Maier SF, et al. Anti-inflammatory cytokine gene therapy decreases sensory and motor dysfunction in experimental multiple sclerosis: MOG-EAE behavioral and anatomical symptom treatment with cytokine gene therapy. Brain Behav Immun. 2009;23:92–100. doi: 10.1016/j.bbi.2008.09.004. - DOI - PMC - PubMed
-
- Peine KJ, Guerau-de-Arellano M, Lee P, Kanthamneni N, Severin M, Probst GD, et al. Treatment of experimental autoimmune encephalomyelitis by codelivery of disease associated peptide and dexamethasone in acetalated dextran microparticles. Mol Pharm. 2014;11:828–835. doi: 10.1021/mp4005172. - DOI - PMC - PubMed
MeSH terms
Substances
Grants and funding
LinkOut - more resources
Full Text Sources
Other Literature Sources
Research Materials
Miscellaneous
