Meta-Analysis
. 2020 Sep 7:9:e60122.
doi: 10.7554/eLife.60122.

Quantifying antibody kinetics and RNA detection during early-phase SARS-CoV-2 infection by time since symptom onset

Affiliations
Meta-Analysis

Quantifying antibody kinetics and RNA detection during early-phase SARS-CoV-2 infection by time since symptom onset

Benny Borremans et al. Elife. .

Abstract

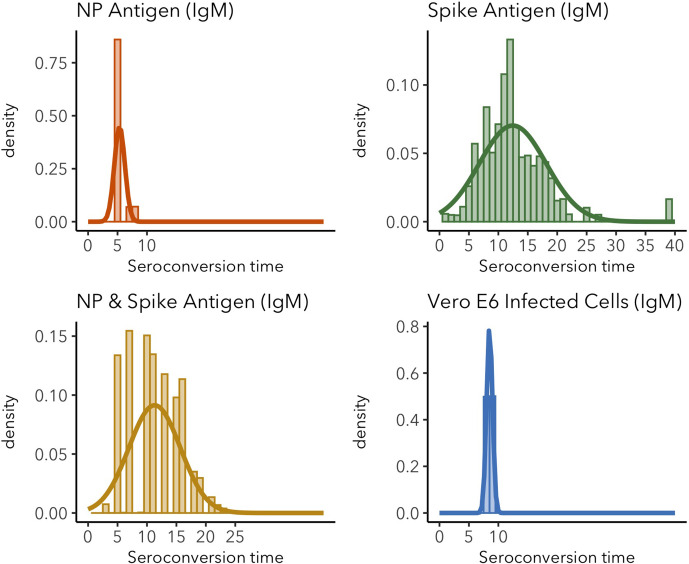
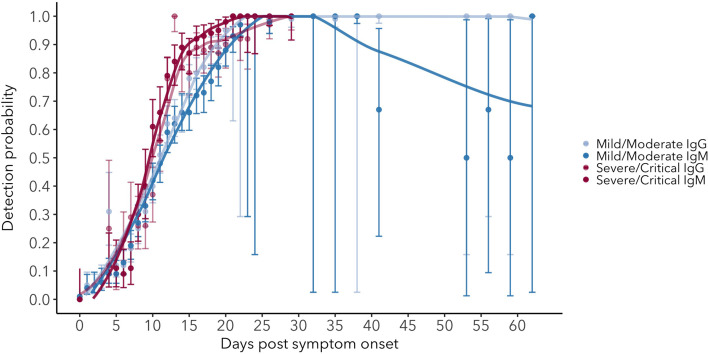
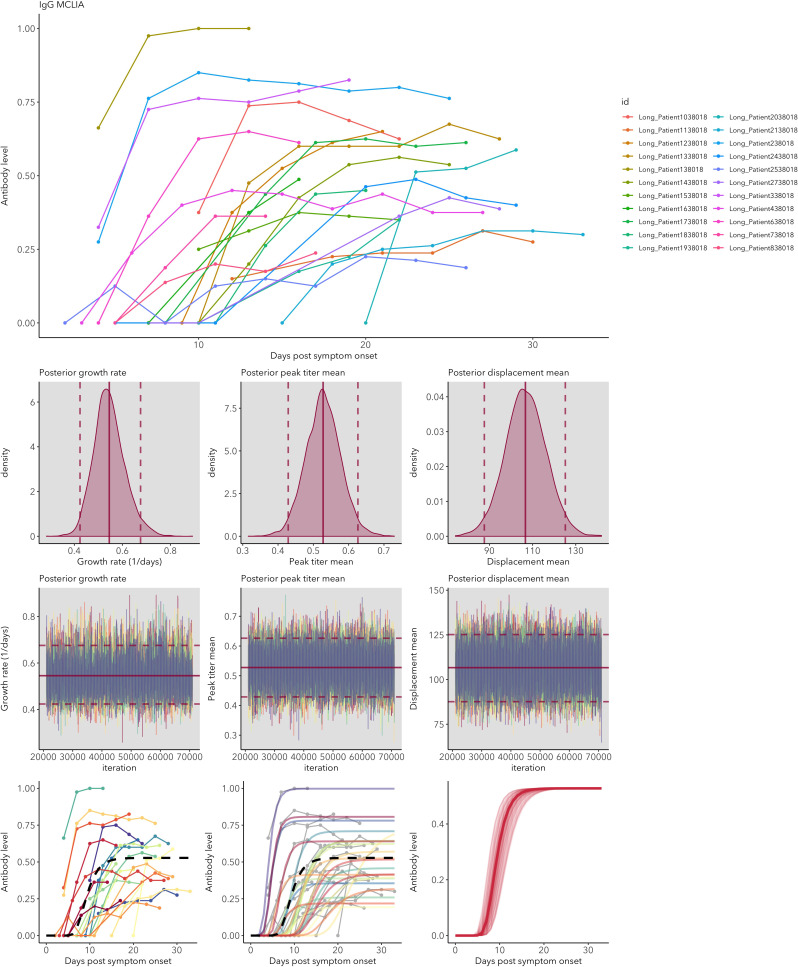
Understanding and mitigating SARS-CoV-2 transmission hinges on antibody and viral RNA data that inform exposure and shedding, but extensive variation in assays, study group demographics and laboratory protocols across published studies confounds inference of true biological patterns. Our meta-analysis leverages 3214 datapoints from 516 individuals in 21 studies to reveal that seroconversion of both IgG and IgM occurs around 12 days post-symptom onset (range 1-40), with extensive individual variation that is not significantly associated with disease severity. IgG and IgM detection probabilities increase from roughly 10% at symptom onset to 98-100% by day 22, after which IgM wanes while IgG remains reliably detectable. RNA detection probability decreases from roughly 90% to zero by day 30, and is highest in feces and lower respiratory tract samples. Our findings provide a coherent evidence base for interpreting clinical diagnostics, and for the mathematical models and serological surveys that underpin public health policies.

Keywords: COVID-19; RNA; SARS-CoV-2; antibody kinetics; detection probability; epidemiology; global health; human; meta-analysis.


Conflict of interest statement

BB, AG, KP, SH, AM, CC, VS, JL No competing interests declared

Figures

Figure 1.
Figure 1.. Seroconversion time distributions for IgG and IgM.
(A) IgG and IgM detected using ELISA. (B) IgG and IgM detected using MCLIA. (C) IgM and (D) IgG seroconversion related to disease severity. IgG and IgM ELISA results are shown for the NP and Spike antigens, respectively, because these had the largest sample sizes. Lines indicate fitted normal distributions.
Figure 1—figure supplement 1.
Figure 1—figure supplement 1.. Distributions of IgG and IgM seroconversion times (including all assays) for increasing levels of data inclusion, from exact time data only (time period = 0) to the inclusion of the longest reported time periods (all).
Figure 1—figure supplement 2.
Figure 1—figure supplement 2.. IgG seroconversion time distributions for different assays.
Sparse distributions are the result of low sample sizes in the study. These sparse results are included for informative reasons and should not be interpreted as representative of the real distribution.
Figure 1—figure supplement 3.
Figure 1—figure supplement 3.. IgG seroconversion time distributions for different target antigens.
Sparse distributions are the result of low sample sizes in the study. These sparse results are included for informative reasons and should not be interpreted as representative of the real distribution.
Figure 1—figure supplement 4.
Figure 1—figure supplement 4.. IgM seroconversion time distributions for different assays.
Sparse distributions are the result of low sample sizes in the study. These sparse results are included for informative reasons and should not be interpreted as representative of the real distribution.
Figure 1—figure supplement 5.
Figure 1—figure supplement 5.. IgM seroconversion time distributions for different target antigens.
Sparse distributions are the result of low sample sizes in the study. These sparse results are included for informative reasons and should not be interpreted as representative of the real distribution.
Figure 2.
Figure 2.. Detection probability of IgG, IgM and NT (neutralizing) antibody (A) and RNA in different sample types (B) over time since symptom onset.
Points are mean values for each day. Bold lines are flexible smoothed splines fit to the data. Error bars indicate binomial exact 95% confidence intervals of the mean, based on daily sample size. Note that error bars after day 30 tend to be large, due to the limited available data. IgG and IgM values are those detected using any assay/antigen. After day 25, results are pooled into 3-day periods in order to improve estimates.
Figure 2—figure supplement 1.
Figure 2—figure supplement 1.. IgG detection probability for different assays/antigens.
Figure 2—figure supplement 2.
Figure 2—figure supplement 2.. IgM detection probability for different assays/antigens.
Figure 2—figure supplement 3.
Figure 2—figure supplement 3.. Detection probability for serum IgG (ELISA-NP) and IgM (ELISA-Spike), and for viral RNA in upper respiratory tract samples.
Figure 2—figure supplement 4.
Figure 2—figure supplement 4.. Detection probability for serum IgG and IgM in mild/moderate and severe/critical cases.
Figure 3.
Figure 3.. IgG and IgM antibody level kinetics for ELISA NP and Spike assays (A) and disease severity for IgM (B) and IgG (C).
Measured using ELISA Spike and ELISA NP, respectively. Fitted functions use the posterior mean values for increase rate and start of the increase phase (displacement). Dotted lines show upper and lower 95% credible intervals. Note that the upper CI of IgM ELISA severe overlaps with the lower CI of mild cases, as do the upper CIs of IgG ELISA mild and severe. In order to allow the comparison of increase rate patterns, normalized peak antibody levels were set to one for all functions.
Figure 4.
Figure 4.. Antibody and RNA detection patterns during the early phase of SARS-CoV-2 infection.
(Top) Fitted splines for the detection probabilities of serum IgG and IgM (measured using any assay/antigen), and of RNA in upper respiratory tract samples. (Middle) Modeled IgG and IgM level kinetics with 95% credible intervals, with normalized peak antibody levels set at one to allow direct comparison of growth rates. (Bottom) Estimated distribution of observed IgG and IgM seroconversion times.
Figure 5.
Figure 5.. Flowchart illustrating the article selection process for the meta-analysis.
Appendix 1—figure 1.
Appendix 1—figure 1.. IgG ELISA-NP fitted antibody kinetics.
Appendix 1—figure 2.
Appendix 1—figure 2.. IgG ELISA-Spike fitted antibody kinetics.
Appendix 1—figure 3.
Appendix 1—figure 3.. IgG MCLIA fitted antibody kinetics.
Appendix 1—figure 4.
Appendix 1—figure 4.. IgG mild/moderate cases fitted antibody kinetics.
Appendix 1—figure 5.
Appendix 1—figure 5.. IgG severe/critical cases fitted antibody kinetics.
Appendix 1—figure 6.
Appendix 1—figure 6.. IgM ELISA-Spike fitted antibody kinetics.
Appendix 1—figure 7.
Appendix 1—figure 7.. IgM ELISA-NP fitted antibody kinetics.
Appendix 1—figure 8.
Appendix 1—figure 8.. IgM MCLIA fitted antibody kinetics.
Appendix 1—figure 9.
Appendix 1—figure 9.. IgM mild/moderate cases fitted antibody kinetics.
Appendix 1—figure 10.
Appendix 1—figure 10.. IgM severe/critical cases fitted antibody kinetics.

Similar articles

Cited by

References

    1. Adams E, Ainsworth M, Anand R, Andersson M, Auckland K, Jk B. Antibody testing for COVID-19: a report from the national COVID scientific advisory panel. medRxiv. 2020 doi: 10.1101/2020.04.15.20066407. - DOI - PMC - PubMed
    1. Altmann DM, Douek DC, Boyton RJ. What policy makers need to know about COVID-19 protective immunity. Lancet. 2020;6736:19–21. doi: 10.1016/S0140-6736(20)30985-5. - DOI - PMC - PubMed
    1. Angulo FJ, Finelli L, Swerdlow DL. Reopening society and the need for Real-Time assessment of COVID-19 at the community level. Jama. 2020;323:2247. doi: 10.1001/jama.2020.7872. - DOI - PubMed
    1. Azkur AK, Akdis M, Azkur D, Sokolowska M, Veen W, Brüggen M‐C, O’Mahony L, Gao Y, Nadeau K, Akdis CA. Immune response to sars‐cov‐2 and mechanisms of immunopathological changes in covid‐19. Allergy. 2020;75:1564–1581. doi: 10.1111/all.14364. - DOI - PMC - PubMed
    1. Borremans B, Hens N, Beutels P, Leirs H, Reijniers J. Estimating time of infection using prior serological and individual information can greatly improve incidence estimation of human and wildlife infections. PLOS Computational Biology. 2016;12:e1004882. doi: 10.1371/journal.pcbi.1004882. - DOI - PMC - PubMed

Publication types

MeSH terms