. 2020 Oct 9;48(18):10211-10225.
doi: 10.1093/nar/gkaa732.

Histone chaperone FACT represses retrotransposon MERVL and MERVL-derived cryptic promoters

Affiliations

Histone chaperone FACT represses retrotransposon MERVL and MERVL-derived cryptic promoters

Fuquan Chen et al. Nucleic Acids Res. .

Abstract

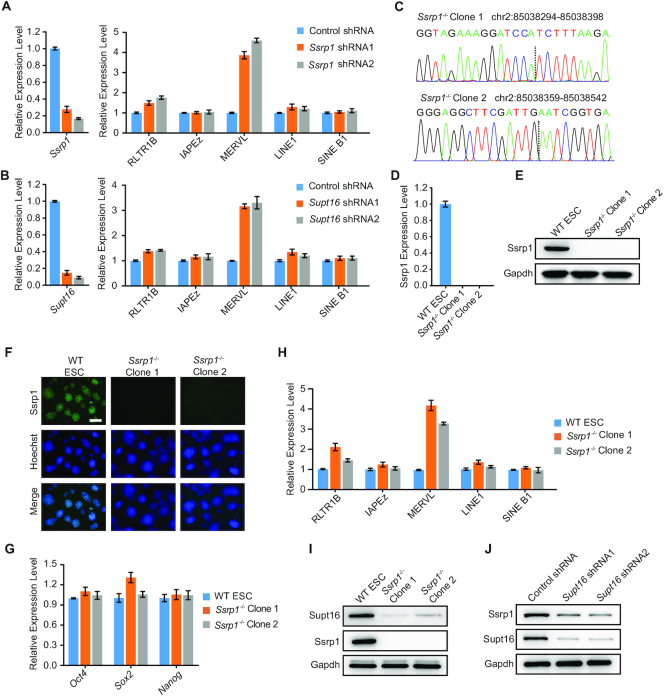
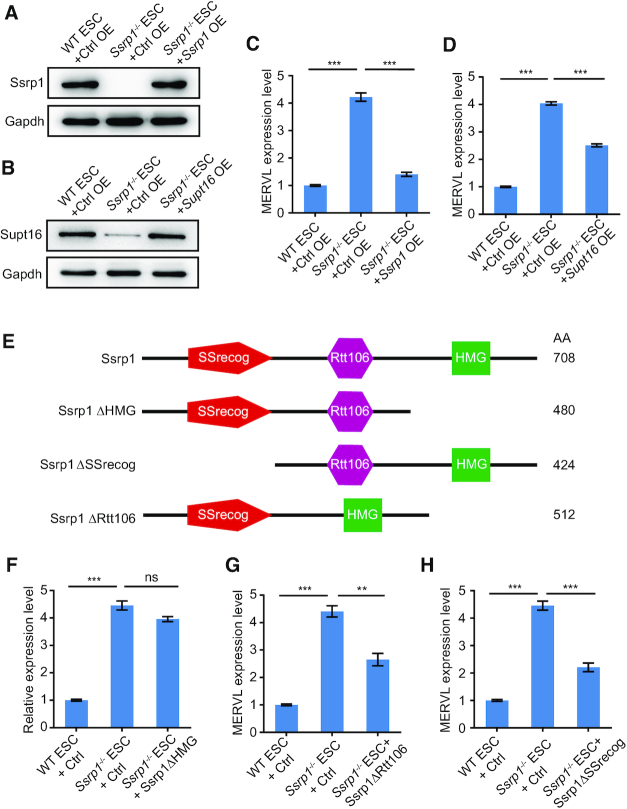
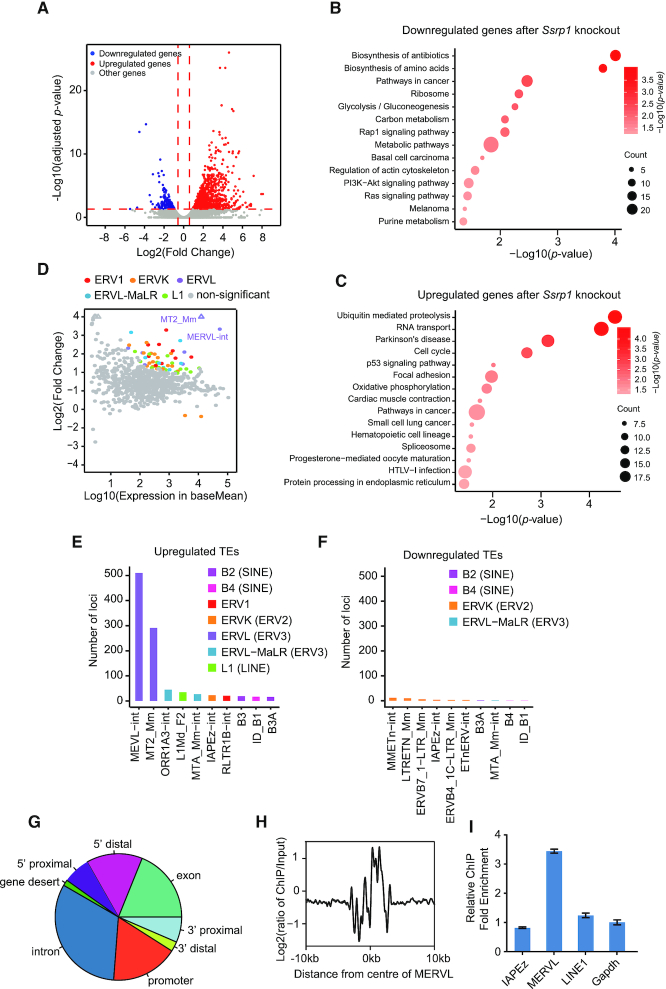
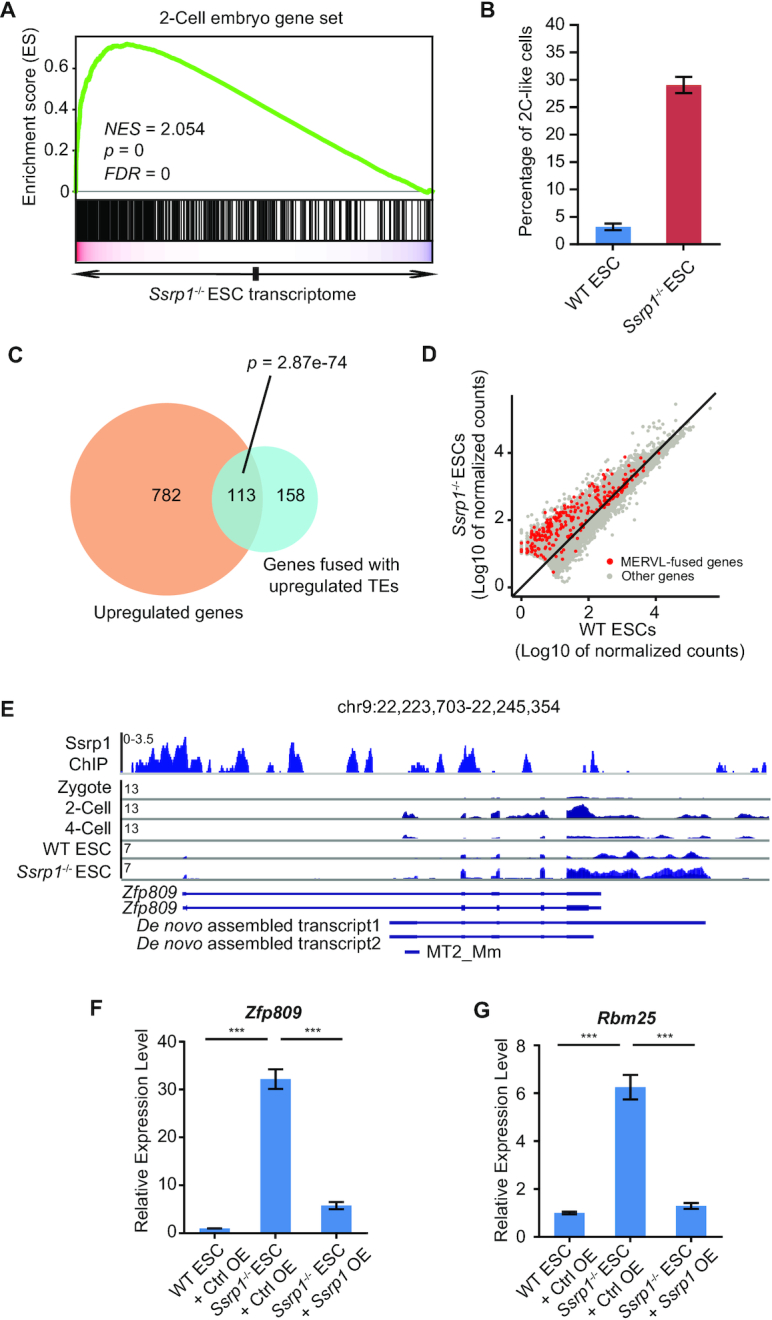
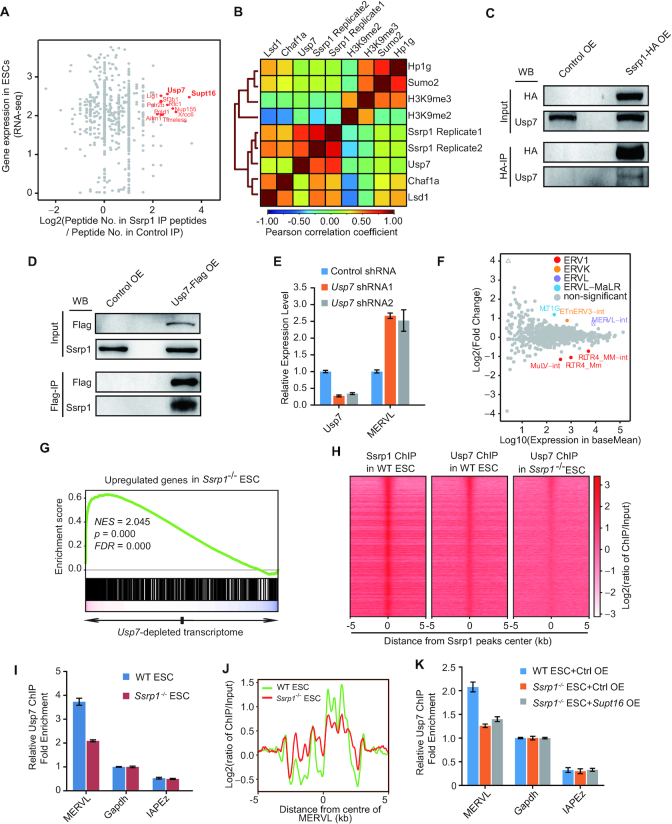
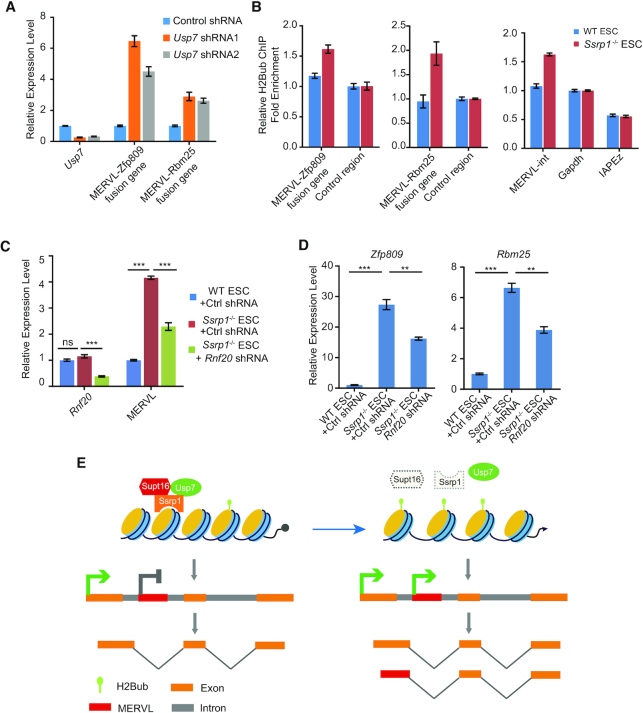
Endogenous retroviruses (ERVs) were usually silenced by various histone modifications on histone H3 variants and respective histone chaperones in embryonic stem cells (ESCs). However, it is still unknown whether chaperones of other histones could repress ERVs. Here, we show that H2A/H2B histone chaperone FACT plays a critical role in silencing ERVs and ERV-derived cryptic promoters in ESCs. Loss of FACT component Ssrp1 activated MERVL whereas the re-introduction of Ssrp1 rescued the phenotype. Additionally, Ssrp1 interacted with MERVL and suppressed cryptic transcription of MERVL-fused genes. Remarkably, Ssrp1 interacted with and recruited H2B deubiquitinase Usp7 to Ssrp1 target genes. Suppression of Usp7 caused similar phenotypes as loss of Ssrp1. Furthermore, Usp7 acted by deubiquitinating H2Bub and thereby repressed the expression of MERVL-fused genes. Taken together, our study uncovers a unique mechanism by which FACT complex silences ERVs and ERV-derived cryptic promoters in ESCs.


Figures

Figure 1.
Figure 1.
FACT complex represses ERVs. (A) qPCR analysis of the expression of Ssrp1 and retrotransposons after Ssrp1 depletion in E14 ESCs. Data represent mean ± s.e.m., n = 3 biological replicates. (B) The expression levels of Supt16 and retrotransposons after Supt16 depletion in E14 ESCs, as measured by qPCR and normalized to Gapdh levels. Biological triplicate data (n = 3 dishes) are presented as mean ± s.e.m. (C) DNA sequencing results of mutation sites in two Ssrp1−/− ESC lines. (D) RT–qPCR analysis of the expression of Ssrp1 using specific primers located near the sgRNA sites in WT and Ssrp1−/− ESCs. Biological triplicate data (n = 3 dishes) are presented as mean ± s.e.m. (E) Western blot analysis of Ssrp1 protein in WT and Ssrp1−/− ESCs. Gapdh was used as a loading control. (F) Immunofluorescence staining of Ssrp1 protein in WT ESC and Ssrp1−/− ESCs. Ssrp1 was stained in green. DNA was stained by Hoechst 33342. Scale bar, 50 μm. (G) qPCR analysis of pluripotent genes (Oct4, Sox2 and Nanog) expression in WT ESCs and Ssrp1−/− ESCs. (H) qPCR analysis of expression of Ssrp1 and retrotransposons in WT ESCs and Ssrp1−/− ESCs. The results were presented as mean ± s.e.m from three biological replicates. (I) Western blot analysis of Ssrp1, Supt16 and Gapdh protein levels in WT ESCs and Ssrp1−/− ESCs. (J) Western blot analysis of Supt16 and Ssrp1 protein levels in ESCs expressing Supt16 shRNA or control shRNA. Gapdh was included as a loading control.
Figure 2.
Figure 2.
Restoration of MERVL expression by the introduction of Ssrp1 or Supt16. (A andB) Immunoblot analysis of the expression of Ssrp1 (A) or Supt16 (B) after overexpression of Ssrp1 or Supt16 in Ssrp1−/− ESCs. Gapdh was included as a loading control. OE, overexpression. Ctrl, control vector. (C) qPCR analysis of MERVL expression in Ssrp1−/− ESC after overexpression of Ssrp1. Biological triplicate data (n = 3 dishes) are presented as mean ± s.e.m. Significant differences were determined by Student's t-test and defined as ***P < 0.001. (D) qPCR analysis of MERVL expression in Ssrp1−/− ESC after overexpression of Supt16. Ctrl, control vector overexpression. Biological triplicate data (n = 3 dishes) are presented as mean ± s.e.m. Significant differences were determined by Student's t-test and defined as ***P < 0.001. ns, non-significant. (E) A schematic summary of Ssrp1 mutants used for functional rescue. The length of each mutant form is indicated at the right in amino acids (AA). Δ, deletion. (FH) qPCR analysis of MERVL expression after overexpression of Ssrp1 ΔHMG (F), Ssrp1 ΔRtt106 (G), or Ssrp1ΔSSrecog (H) in Ssrp1−/− ESCs. qPCR results are normalized to Gapdh. Biological triplicate data (n = 3 dishes) are presented as mean ± s.e.m. Ctrl, control vector overexpression. Significant differences were determined by Student's t-test and defined as **P < 0.01 or *** P < 0.001.
Figure 3.
Figure 3.
FACT complex genome-wide regulates TE transcription. (A) The volcano plot of gene expression in Ssrp1−/− ESCs versus WT ESCs. Significantly upregulated genes were labeled in red and significantly downregulated genes were labeled in blue. Horizontal red dash line marked adjusted P-value (Wald test) 0.05 and vertical lines marked expression fold change 1.5. (B andC) KEGG analysis of pathways related to downregulated genes (B) and upregulated genes (C) after Ssrp1 knockout in ESCs. The analysis was done in DAVID. Color gradient indicated significance in −log10 (P-value) and dot size indicated the number of genes in the corresponding pathway. (D) A scatter diagram shows a transcriptome analysis of TE expression after Ssrp1 knockout. The result from Squire was used to plot the diagram. Colored dots indicate TE with significant expression change (P < 0.05, Wald test). Triangles represent TEs with log2 (fold change) > 4. (E andF) The top 10 TEs with the highest number of loci upregulated (E) or downregulated (F) after Ssrp1 loss. The subfamily type of each TE was labeled in brackets. (G) Locations of Ssrp1 peaks relative to the nearest transcription units (Promoter, 2 kb around transcriptional start sites; 5’ proximal, 2–10 kb upstream of the gene; 5’ distal, 10–100 kb upstream of the gene; 3’ proximal, 0–10 kb downstream of the gene; 3’ distal, 10–100 kb downstream of the gene; Gene desert, >100 kb away from the nearest gene). (H) Ssrp1 binding profile around the center of MERVL locus. The ChIP-seq signal was calculated as the log2 ratio of the normalized number of reads relative to the input. (I) ChIP-qPCR analysis of Ssrp1 binding on different retrotransposons. ChIP-qPCR data were normalized to input and Gapdh. Biological triplicate data (n = 3 extracts) are presented as mean ± s.e.m.
Figure 4.
Figure 4.
FACT represses MERVL-driven fusion transcripts. (A) GSEA analysis of upregulated genes after Ssrp1 knockout for the enrichment of 2C genes. Red, upregulated genes; blue, downregulated genes; NES, normalized enrichment scores; FDR, false discovery rate. The Kolmogorov–Smirnov statistic was used for calculation of P-value. (B) Flow cytometry analysis of the MERVL-gag+ population within WT ESCs or Ssrp1−/− ESCs. Biological triplicate data (n = 3 dishes) are presented as mean ± s.e.m. (C) The overlap between genes whose TSS are overlapped with upregulated TEs and upregulated genes in Ssrp1−/− ESCs. The P-value was calculated by Fisher's exact test. (D) Dot plot of all expressed genes in WT and Ssrp1−/− ESCs. Genes with alternative transcript(s) overlapped with MERVL were labeled in red. (E) ChIP-seq signal of Ssrp1 binding on Zfp809 in WT ESC and RNA-seq signal across embryo of the zygote, 2-cell and 4-cell, WT and Ssrp1−/− ESCs. The signal of multiple samples was merged. Genes and MERVL tracks were indicated below. (F andG) RT-qPCR analysis of expression of representative genes Zfp809 (F) and Rbm25 (G) in WT ESCs, Ssrp1−/− ESCs and Ssrp1−/− ESCs overexpressing Ssrp1 or ctrl vector. Biological triplicate data (n = 3 extracts) are presented as mean ± s.e.m. Significant differences were determined by Student's t-test and defined as *** P < 0.001.
Figure 5.
Figure 5.
Ssrp1 recruits Usp7 to repress MERVL expression. (A) Mass spectrometry analysis of Ssrp1-associated proteins after Ssrp1 co-IP. Y-axis indicates the transcriptional level of corresponding proteins and the X-axis indicates the binding strength of proteins to Ssrp1. (B) Correlation heatmap of Ssrp1 duplicate binding profile and Usp7 binding profile together with known histone marks/regulators of ERVs. Pearson's correlation coefficient was used to estimate the strength of the correlation. The ChIP-seq signal was calculated as the log2 ratio of normalized reads relative to the input. (C) Western blot analysis of Ssrp1-HA/Usp7 co-immunoprecipitation in ESCs overexpressing control empty vector or HA-tagged Ssrp1. IP was done with anti-HA magnetic beads. 1.25% input was loaded as control. (D) Western blot analysis of Usp7-Flag/Ssrp1 co-immunoprecipitation in ESCs overexpressing control empty vector or Flag-tagged Usp7. IP was done with anti-Flag magnetic beads. 1.25% input was loaded as control. IP: immunoprecipitation; OE: overexpression. (E) RT-qPCR analysis of the expression of Usp7 and MERVL after Usp7 depletion in ESCs. Data are shown as mean ± s.e.m. (n = 3). (F) Scatter plot of TE expression after Usp7 depletion. Squire results were used to plot the diagram. Colored dots indicate TEs with significant expression change (P < 0.05, Wald test). Triangles represent TEs with log2 (fold change) > 4. (G) GSEA analysis of enrichment of genes repressed by Ssrp1 in the upregulated transcriptome of ESCs with Usp7 depleted. Red, upregulated genes; blue, downregulated genes. NES: normalized enrichment scores; FDR: false discovery rate. The Kolmogorov–Smirnov statistic was used for calculation of P-value. (H) Enrichment heatmap of Ssrp1 binding in WT ESCs, Usp7 binding in WT ESCs and Usp7 binding in Ssrp1−/− ESCs around binding regions of Ssrp1. The regions are sorted by the Ssrp1 binding strength. The ChIP-seq signal was calculated as the log2 ratio of normalized reads relative to the input. (I) ChIP-qPCR analysis of Usp7 enrichment on MERVL in WT ESCs and Ssrp1−/− ESCs. ChIP-qPCR data were normalized to input and Gapdh locus. Biological triplicate data (n = 3 extracts) are presented as mean ± s.e.m. (J) Usp7 binding profile around the center of MERVL locus in WT ESCs and Ssrp1−/− ESCs. The ChIP-seq signal was calculated as the log2 ratio of the normalized number of reads relative to the input. (K) ChIP-qPCR analysis of Usp7 enrichment on MERVL in Ssrp1−/− ESCs after overexpression of Supt16. Biological triplicate data (n = 3 dishes) are presented as mean ± s.e.m. Ctrl: control vector; OE: overexpression.
Figure 6.
Figure 6.
Ssrp1 and Usp7 suppress transcription of MERVL-fused transcripts by removing H2Bub. (A) qPCR analysis of expression of MERVL-fused transcripts after Usp7 depletion. The data are represented as mean ±s.e.m. from three biological replicates. (B) ChIP-qPCR analysis of H2Bub enrichment on the specific loci of MERVL and MERVL consensus in WT ESCs and Ssrp1−/− ESCs. ChIP-qPCR data were normalized to input and that of the control region. Biological triplicate data (n = 3 extracts) are presented as mean ± s.e.m. (C) qPCR analysis of MERVL expression after Rnf20 depletion in Ssrp1−/− ESCs. The data are represented as mean ± s.e.m. from three biological replicates. Ctrl: control. Significant differences were determined by Student's t-test and defined as *** P < 0.001. ns: non-significant. (D) qPCR analysis of expression of MERVL-fused transcripts after Rnf20 depletion in WT and Ssrp1−/− ESCs. The data are represented as mean ± s.e.m. from three biological replicates. Significant differences were determined by Student's t-test and defined as *** P < 0.001 or ** P < 0.01. (E) Schematic of FACT complex function in the coordinated repression of MERVL and 2-cell cleavage genes in ESCs. In WT ESCs, Ssrp1 binds to MERVL, interacts with Supt16 and Usp7 and decreases H2Bub deposition on MERVL, thus represses the expression of MERVL and MERVL-derived cryptic promoters. In the absence of Ssrp1, Usp7 is dissociated from chromatin, and H2Bub is gained to activate the expression of MERVL and MERVL-driven cryptic transcription. Box with dotted lines, the genes with depleted expression.

Similar articles

Cited by

References

    1. Cordaux R., Batzer M.A.. The impact of retrotransposons on human genome evolution. Nat. Rev. Genet. 2009; 10:691–703. - PMC - PubMed
    1. Stocking C., Kozak C.A.. Murine endogenous retroviruses. Cell. Mol. Life Sci. 2008; 65:3383–3398. - PMC - PubMed
    1. Zhang W., Chen F., Chen R., Xie D., Yang J., Zhao X., Guo R., Zhang Y., Shen Y., Goke J. et al. .. Zscan4c activates endogenous retrovirus MERVL and cleavage embryo genes. Nucleic Acids Res. 2019; 47:8485–8501. - PMC - PubMed
    1. Macfarlan T.S., Gifford W.D., Driscoll S., Lettieri K., Rowe H.M., Bonanomi D., Firth A., Singer O., Trono D., Pfaff S.L.. Embryonic stem cell potency fluctuates with endogenous retrovirus activity. Nature. 2012; 487:57–63. - PMC - PubMed
    1. Goke J., Lu X., Chan Y.S., Ng H.H., Ly L.H., Sachs F., Szczerbinska I.. Dynamic transcription of distinct classes of endogenous retroviral elements marks specific populations of early human embryonic cells. Cell Stem Cell. 2015; 16:135–141. - PubMed

Publication types

MeSH terms