Review
. 2020:1267:15-43.
doi: 10.1007/978-3-030-46886-6_2.

Complex Diffusion in Bacteria

Affiliations
Review

Complex Diffusion in Bacteria

Christopher H Bohrer et al. Adv Exp Med Biol. 2020.

Abstract

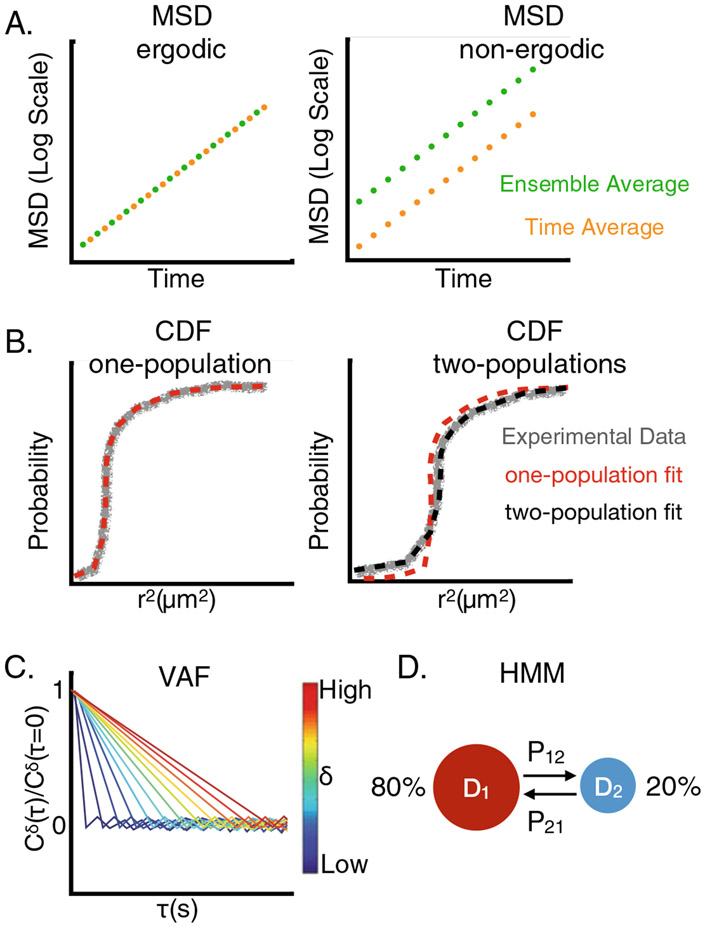
Diffusion within bacteria is often thought of as a "simple" random process by which molecules collide and interact with each other. New research however shows that this is far from the truth. Here we shed light on the complexity and importance of diffusion in bacteria, illustrating the similarities and differences of diffusive behaviors of molecules within different compartments of bacterial cells. We first describe common methodologies used to probe diffusion and the associated models and analyses. We then discuss distinct diffusive behaviors of molecules within different bacterial cellular compartments, highlighting the influence of metabolism, size, crowding, charge, binding, and more. We also explicitly discuss where further research and a united understanding of what dictates diffusive behaviors across the different compartments of the cell are required, pointing out new research avenues to pursue.

Keywords: Anomalous Diffusion; Bacteria; Cell envelope; Charge; Confinement; Crowding; Diffusion; Glass; Inner membrane; Mean squared displacement; Metabolism; Outer membrane; Periplasm.; Single particle tracking; Velocity autocorrelation function; Viscoelastic.


Figures

Fig. 2.1
Fig. 2.1
Three most common methodologies used to quantify diffusion. (a) Fluorescence Recovery after Photobleaching (FRAP): the recovery of fluorescence signal (shown as green color) in a region of interest (ROI, shown as gray dashed circle) is monitored after bleaching (bleached region shown as black circle). The “rate” at which the signal recovers is related to the mobility of the particle of interest, shown as red and blue curves. (b) Fluorescence Correlation Spectroscopy (FCS): fluctuations within a small diffraction-limited excitation volume are monitored throughout time, illustrated as counts vs time. The fluctuations of slower diffusing particles are shown in red and the higher frequency fluctuations of the faster diffusing particles are shown in blue. The autocorrelation functions of each system can be calculated, providing information about the diffusion of the particles. (c) Single Molecule Tracking (SMT): The location of individual molecules or particles within a cell are monitored through time (arrows indicate direction of time). The displacements along the trajectories can then be analyzed with different methodologies, which are further illustrated in Fig. 2.2 and explained in detail in text
Fig. 2.2
Fig. 2.2
Data analyses of SMT. (a) An example of an MSD for an ergodic system and for a non-ergodic system. (b) An example a CDF fit for a one state system and a two state system. (c) An example VAF for Brownian diffusion. (d) A two state Markov model with its corresponding diffusion coefficients, transition probabilities and percentages of each state
Fig. 2.3
Fig. 2.3
Cartoons showing different modes of diffusion, with each row showing a different mode of diffusion through time (light gray circles illustrate the medium), the mean squared displacement (MSD, shown on a linear scale (except for K), green ensemble average, yellow time average), and the corresponding velocity autocorrelation function (VAF, color indicates δ as in Fig. 2.2). [Specifics] (d) Super Diffusion: dark gray Line is track on which a particle travels in a directed manner (For example actin). (g) Confined: dark gray line indicates a barrier where the diffusion of a particle is restricted (For example the membrane). (k) MSD is shown on a log scale. (l) Viscoelastic: the springs between the particles of the medium represent the elastic property of the medium. (o) Continuous Time Random Walk (CTRW): the overlap between the particle of interest with a particle of the medium indicates a binding event. For all rows arrows show direction of time as well as previous locations
Fig. 2.4
Fig. 2.4
A “simplistic” overview of diffusion within the different compartments of the cell. The three different regions of the cell are shown in yellow with their specific label. Below a characteristic diffusion coefficient is shown that has been observed for that compartment (Note: the characteristic diffusion coefficient for the nucleoid is for the DNA itself (DNA) and for a protein non-specifically binding DNA (DNA-Binder))
Fig. 2.5
Fig. 2.5
(a) Dynamic Heterogeneity of individual molecules: the probability density function of the diffusion coefficient of individual mRNA molecules normalized by their mean. (Adapted from Lampo et al. 2017a). (b) The VAF of the mRNA resembles that of diffusion within a viscoelastic medium. (Adapted from Lampo et al. 2017a)
Fig. 2.6
Fig. 2.6
The cytoplasm of E. coli has glass-like properties. (a) The radiation of gyration (Rg) of individual trajectories vs. the particle size for individual GFP-fused avian reovirus protein μNS particles, without (green) and with (black) ATP-depletion (DNP). (Figure from Parry et al. 2014) (The dashed line indicates the separation between the “caged” population (small Rg) and the freely diffusive population (large Rg)). (b) The anti-persistent behavior of adjacent displacements for the same data in (a). Here the directionality was assigned a negative value if the second displacement was in the opposite direction of the first. (Figure from Parry et al. 2014)
Fig. 2.7
Fig. 2.7
The relation between the charge of GFP and their diffusion coefficients: the filled histogram shows the distribution for the charged particle referenced in the individual subplots and the empty histogram shows the diffusion coefficients of the −30 GFP in each subplot for reference Schavemaker et al. (2017)
Fig. 2.8
Fig. 2.8
(a) The behavior of the DNA’s sub-diffusive diffusion (exemplified by the exponent of MSD curve α) remains the same when exposed to different perturbations. (Figure from Weber et al. 2010a). (b) The VAF of the DNA resembles that of diffusion within a viscoelastic medium. (Figure from Weber et al. 2012a)
Fig. 2.9
Fig. 2.9
(a) The confined diffusion of the OMP λ receptor with the filled circles calculated using the fast particles and the open circles the slow. (Figure from Gibbs et al. 2004). (b) Top shows an illustration of the colors representing the diffusive states of the individual molecules. Bottom shows how the diffusion of individual BtuB (OMP) was affected by the addition of different amounts of more BtuB or non-interacting OmpF. The addition of an engineered maltose binding protein with a single transmembrane helix (TM-MBP) was also used as a control. (Figure from Rassam et al. 2015)
Fig. 2.10
Fig. 2.10
Diffusion coefficients of IMPs vs. the radius of the IMP (R). (Figure from Oswald et al. 2016)

References

    1. Ando R, Hama H, Yamamoto-Hino M, Mizuno H, Miyawaki A (2002) An optical marker based on the UV-induced green-to-red photoconversion of a fluorescent protein. Proc Natl Acad Sci 99:12651–12656 - PMC - PubMed
    1. Bakshi S, Siryaporn A, Goulian M, Weisshaar JC (2012) Superresolution imaging of ribosomes and RNA polymerase in live Escherichia coli cells. Mol Microbiol 85:21–38 - PMC - PubMed
    1. Bakshi S, Dalrymple RM, Li W, Choi H, Weisshaar JC (2013) Partitioning of RNA polymerase activity in live Escherichia coli from analysis of single-molecule diffusive trajectories. Biophys J 105:2676–2686 - PMC - PubMed
    1. Balakrishnan V (1985) Anomalous diffusionin one dimension. Phys A Stat Mech Appl 132:569–580
    1. Balzarotti F, Eilers Y, Gwosch KC, Gynnå AH, Westphal V, Stefani FD, Elf J, Hell SW (2017) Nanometer resolution imaging and tracking of fluorescent molecules with minimal photon fluxes. Science 355:606–612 - PubMed

LinkOut - more resources