. 2020 Sep 7;11(1):4448.
doi: 10.1038/s41467-020-18200-6.

Cocaine-mediated circadian reprogramming in the striatum through dopamine D2R and PPARγ activation

Affiliations

Cocaine-mediated circadian reprogramming in the striatum through dopamine D2R and PPARγ activation

Karen Brami-Cherrier et al. Nat Commun. .

Abstract

Substance abuse disorders are linked to alteration of circadian rhythms, although the molecular and neuronal pathways implicated have not been fully elucidated. Addictive drugs, such as cocaine, induce a rapid increase of dopamine levels in the brain. Here, we show that acute administration of cocaine triggers reprogramming in circadian gene expression in the striatum, an area involved in psychomotor and rewarding effects of drugs. This process involves the activation of peroxisome protein activator receptor gamma (PPARγ), a nuclear receptor involved in inflammatory responses. PPARγ reprogramming is altered in mice with cell-specific ablation of the dopamine D2 receptor (D2R) in the striatal medium spiny neurons (MSNs) (iMSN-D2RKO). Administration of a specific PPARγ agonist in iMSN-D2RKO mice elicits substantial rescue of cocaine-dependent control of circadian genes. These findings have potential implications for development of strategies to treat substance abuse disorders.


Conflict of interest statement

The authors declare no competing interests.

Figures

Fig. 1
Fig. 1. Effects of acute cocaine on circadian clock genes.
a Schematic of the experimental design in b. b Actograms of 24 h locomotor activity in 12h-Light/12h-Dark cycles in WT (n = 5) and iMSN-D2RKO mice (n = 4) during the 4 days preceding and following cocaine administration. Cocaine (20 mg kg-1, i.p.) was given once at ZT3 on day 4 (red arrowheads in 1a and 1b). c Locomotor activity analyses from b in WT (circles) and iMSN-D2RKO (squares) mice. Graphical representation of the number of beam breaks/min/circadian time (ZT) during the days preceding (Pre-Cocaine; left) or following cocaine injection (Post-Cocaine; right). d Total beam breaks per phase in WT (circles) (n = 5) and iMSN-D2RKO (squares) (n = 4); inactive phase (Light), active phase (Dark), Pre-cocaine (two-way ANOVA, Genotype: F(1, 14) = 27.31, p = 0.0001; Time: F(1, 14) = 52.41, p < 0.0001; Interaction: F(1, 14) = 15.20, p = 0.0016) and Post-cocaine (two-way ANOVA, Genotype: F(1, 14) = 18.15, p = 0.0008; Time: F(1, 14) = 31.86, p < 0.0001; Interaction: F(1, 14) = 12.01, p = 0.0038). Tukey’s multiple comparison test p-values as indicated. e Left: The mean change in counts/min at each time point in pre-cocaine vs post-cocaine time in WT (circles) and iMSN-D2RKO (squares). Right: same as e) left, but represented as percent change during the light (ZT0-11) and dark (ZT12-23) phases. f Schematic of the circadian experimental design in g. Mice were injected with cocaine (20 mg kg−1, i.p) at ZT3 and NAcc samples were collected every 4 h following cocaine injection at ZT 3, 7, 11, 15, 19 and 23 (arrows). g Expression of core clock and clock-controlled genes: Bmal1, Cry1, Dbp, and Per1 in WT saline (Sal; red circles) or cocaine (Coc; blue squares) and iMSN-D2RKO (Sal; yellow upward triangles) or (Coc; green downward triangles) analyzed by quantitative real-time PCR (n = 3/genotype) (three-way ANOVA; For statistics see Supplementary Table 1). Data are presented as mean values ± SEM.
Fig. 2
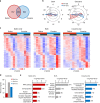
Fig. 2. Cocaine rewires the striatal circadian transcriptome in WT mice.
a Venn diagram representing the striatal rhythmic genes in saline and cocaine treated WT mice (n = 3, JTK_Cycle, cutoff p < 0.01). b Radar plots representing the phase analysis of genes whose expression is circadian in both saline (Sal) and cocaine (Coc) treated mice (left) and genes exclusively circadian in saline or cocaine conditions (right). c, Heat maps representing genes significantly circadian (n = 3, JTK_cycle, cutoff p < 0.01) in saline- (left), in cocaine-treated mice (right) and commonly circadian in saline and cocaine treated mice (middle). White and black bars indicate the light (ZT3, 7, 11) and dark (ZT15, 19, 23) timepoints respectively. d Amplitude analysis of striatal transcripts rhythmic in both saline (Sal) and cocaine (Coc) injected mice. The percentage of genes with amplitude higher, lower or equal to saline condition is reported. e DAVID Gene Ontology Biological Process analysis of circadian genes oscillating in saline only (left), both (middle) and cocaine only (right). Bar charts represent the -Log10(p-value) of each enriched term. The number of genes identified in each pathway is shown in parenthesis.
Fig. 3
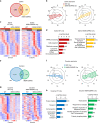
Fig. 3. D2R ablation from iMSN reorganizes the striatal circadian transcriptome.
a Venn diagram of striatal oscillating genes in saline treated WT and iMSN-D2RKO mice (n = 3, JTK_Cycle, cutoff p < 0.01). b Radar plots displaying the phase analysis of genes whose expression is exclusively circadian in WT mice (left) or in iMSN-D2RKO saline-treated (Sal) mice (right). c Heat maps of genes significantly circadian (n = 3, JTK_Cycle, cutoff p < 0.01) only in WT (left) or in iMSN-D2RKO (right) saline-treated mice. White and black bars indicate the light (ZT3, 7, 11) and dark (ZT15, 19, 23) timepoints respectively. d DAVID Gene Ontology Biological Process analysis of circadian genes oscillating in saline WT only (left) and in saline iMSN-D2RKO only (right). Bar charts represent the -Log10(p-value) of each enriched term. The number of genes identified in each pathway is shown in parenthesis. e Venn diagram of striatal oscillating genes in cocaine treated WT and iMSN-D2RKO mice (n = 3, JTK_Cycle, cutoff p < 0.01). f Radar plots displaying the phase analysis of genes whose expression is exclusively circadian in WT (left) or in iMSN-D2RKO cocaine-treated (Coc) mice (right). g Heat maps of genes significantly circadian (n = 3, JTK_Cycle, cutoff p < 0.01) only in WT (left) or in iMSN-D2RKO (right) cocaine-treated mice. White and black bars indicate the light (ZT3, 7, 11) and dark (ZT15, 19, 23) timepoints respectively. h DAVID Gene Ontology Biological Process analysis of circadian genes oscillating in cocaine WT only or in cocaine iMSN-D2RKO only. Bar charts represent the -Log10(p-value) of each enriched term. The number of genes identified in each pathway is shown in parenthesis.
Fig. 4
Fig. 4. Cocaine-driven de novo oscillation of PPARγ target genes.
a Comparison of transcription factor binding site (TFBS) analysis between WT saline (Sal), WT cocaine (Coc), iMSN-D2RKO saline, and iMSN-D2RKO cocaine. The charts report the -Log10(p-value). b Venn diagram representing the rhythmic PPARγ target transcripts after cocaine treatment in WT and iIMSN-D2RKO mice (n = 3, JTK_Cycle, cutoff p < 0.01). c Heat map displaying PPARγ target genes oscillating only in WT cocaine-treated mice compared to iMSN-D2RKO cocaine-treated mice (n = 3, JTK_Cycle, cutoff p < 0.01). White and black bars indicate the light (ZT3, 7, 11) and dark (ZT15, 19, 23) timepoints respectively. d Radar plots displaying the phase analysis of PPARγ target genes whose expression is exclusively circadian in WT cocaine-treated (Coc) mice. e DAVID Gene Ontology Biological Process analysis of oscillatory PPARγ target genes in cocaine-treated WT mice (n = 3, JTK_Cycle, cutoff p < 0.01). Bar charts represent the -Log10(p-value) of each enriched term. The number of genes identified in each pathway is shown in parenthesis.
Fig. 5
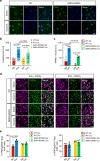
Fig. 5. Cocaine-induced nuclear PPARγ is impaired in iMSN-D2RKO mice.
a Immunolabeling of PPARγ and nuclei on striatal sections of saline and cocaine treated WT and iMSN-D2RKO mice. Scale bar: 25 µm. b Quantification of the fluorescent intensity of PPARγ immunolabeling in WT and iMSN-D2RKO mice treated with saline (Sal; WT: red circles; iMSN-D2RKO: yellow upward triangles) or cocaine (Coc; WT: blue squares; iMSN-D2RKO: green downward triangles). Data were analyzed by two-way ANOVA using the mean ± SD of intensity/cell for each biological replicate (n = 4/group) (Genotype: F(1, 12) = 8.458, p = 0.0131; Treatment: F(1, 12) = 91.23, p < 0.0001; Interaction: F(1, 12) = 12.81, p = 0.0038), Tukey’s multiple comparison test. c Quantification of PPARγ positive neurons with the indicated treatment (n = 3/group). Significance was calculated using two-way ANOVA (Genotype: F(1, 8) = 16.87, p = 0.0034; Treatment: F(1, 8) = 54.77, p < 0.0001; Interaction: F(1, 8) = 3.474, p = 0.0993) Tukey’s multiple comparison test. d Double in-situ/immunofluorescence for Enkephalin (Enk) or D1R mRNA and PPARγ protein in cocaine treated WT and iMSN-D2RKO mice. Scale bar: 50 µm. e Percentage of PPARγ- and Enk- or D1R-positive cells in cocaine and saline treated WT and iMSN-D2RKO mice (Enk: n = 3/group; D1R: n = 3 WT Sal, n = 3 WT Coc, n = 3 iMSN-D2RKO Sal, n = 4 iMSN-D2RKO Coc). Two-way ANOVA (Enk: Genotype: F(1, 8) = 0.1782, p = 0.6841; Treatment: F(1, 8) = 18.69, p = 0.0025; Interaction: F(1, 8) = 10.53, p = 0.0118; D1R: Genotype: F(1, 9) = 7.117, p = 0.0257; Treatment: F(1, 9) = 0.06215, p = 0.8087; Interaction: F(1, 9) = 0.1943, p = 0.6697). Tukey’s multiple comparison test. Data in c and e are presented as mean values ± SEM.
Fig. 6
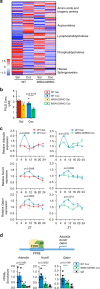
Fig. 6. PPARγ signaling is altered in iMSN-D2RKO mice.
a Heatmap of the 180 metabolites analyzed in WT and iMSN-D2RKO mice, either saline or cocaine-treated (n = 5/group). Metabolites were measured at ZT7 after saline or cocaine was injected at ZT3. Classes of metabolites measured are indicated on the right. b Prostaglandin PGJ2-type (15-deoxy-Δ,-PGJ2) concentration assessed by enzyme-linked immunosorbent assay (ELISA) at ZT7 in WT and iMSN-D2RKO mice treated with saline (Sal: WT, red circles; iMSN-D2RKO, yellow upward triangles) or cocaine (Coc: WT, blue squares; iMSN-D2RKO, green downward triangles) (n = 5/group/genotype). Two-way ANOVA (Genotype: F(1, 16) = 0.1696, p = 0.0008; Treatment: F(1, 16) = 7.719, p = 0.0134; Interaction: F(1, 16) = 0.6034, p = 0.4486). Tukey’s multiple comparison test p-values as indicated. c Circadian expression of selected PPARγ target genes Adora2a, Kcnd1, Gabrδ as determined by quantitative real time PCR (n = 3/group). WT Sal (red circles), WT Coc (blue squares), iMSN-D2RKO Coc (green downward triangles). Two-way ANOVA Adora2a WT Sal vs WT Coc: Treatment: F(1, 24) = 4.372, p = 0.0473; Time: F(5, 24) = 4.253, p = 0.0065; Interaction: F(5, 24) = 3.983, p = 0.0090; Adora2a WT Coc vs iMSN-D2RKO Coc: Genotype: F(1, 24) = 0.4260, p = 0.5201; Time: F(5, 24) = 7.429, p = 0.0002; Interaction: F(5, 24) = 4.363, p = 0.0058; Kcnd1 WT Sal vs WT Coc: Treatment: F(1, 24) = 10.98, p = 0.0029; Time: F(5, 24) = 6.118, p = 0.0009; Interaction: F(5, 24) = 1.640, p = 0.1878; Kcnd1 WT Coc vs iMSN-D2RKO Coc: Genotype: F(1, 24) = 5.302, p = 0.0303; Time: F(5, 24) = 4.360, p = 0.0058; Interaction: F(5, 24) = 2.743, p = 0.0426; Gabrδ WT Sal vs WT Coc: Treatment: F(1, 24) = 2.940, p = 0.0993; Time: F(5, 24) = 2.690, p = 0.0456; Interaction: F(5, 24) = 2.124, p = 0.0972; Gabrδ WT Coc vs iMSN-D2RKO Coc: Genotype: F(1, 24) = 15.59, p = 0.0006; Time: F(5, 24) = 5.308, p = 0.0020; Interaction: F(5, 24) = 3.961, p = 0.0092. Bonferroni’s multiple comparison test p-values as indicated. d, Chromatin recruitment of PPARγ at PPAR response element (PPRE) binding site contained in Adora2a (p = 0.0361; WT Coc (blue squares) n = 5, iMSN-D2RKO Coc (green downward triangles) n = 5, IgG (gray X’s) n = 2), Kcnd1 (p = 0.0252; WT Coc n = 5, n = 4 iMSN-D2RKO Coc, IgG n = 2) and Gabrδ promoters (p = 0.1549; WT Coc n = 5, iMSN-D2RKO Coc n = 4, IgG n = 2. unpaired Student’s t-test. Data are presented as mean values ± SEM.
Fig. 7
Fig. 7. Pharmacological activation of PPARγ restores PPARγ signaling iMSN-D2RKO mice.
a Schematic representation of the experimental design, arrowheads indicate the time and treatment of Pioglitazone (blue) and Cocaine treatments (red). b Expression of selected PPARγ target genes Adora2a, Kcnd1, and Gabrδ as determined by quantitative real time PCR at ZT7 and ZT19 in presence or absence of Pioglitazone (60 mg kg−1) prior to saline or cocaine (20 mg kg−1) (Adora2a ZT7: Genotype: F(1, 25) = 2.003, p = 0.1693; Treatment: F(3, 25) = 4.682, p = 0.0099; Interaction: F(3, 25) = 2.479, p = 0.0845 (Vehicle and Saline: WT n = 6, iMSN-D2RKO n = 5; Vehicle and Cocaine: WT n = 5, iMSN-D2RKO n = 4; Pioglitazone and Saline: WT n = 3, iMSN-D2RKO n = 3; Pioglitazone and Cocaine: WT n = 3, iMSN-D2RKO n = 4); Kcnd1 ZT7: Genotype: F(1, 34) = 26.20, p < 0.0001; Treatment: F(3, 34) = 20.05, p < 0.0001; Interaction: F(3, 34) = 3.130, p = 0.0383 (Vehicle and Saline: WT n = 6, iMSN-D2RKO n = 7, Vehicle and Cocaine WT n = 7, iMSN-D2RKO n = 7; Pioglitazone and Saline: WT n = 3, iMSN-D2RKO n = 4, Pioglitazone and Cocaine WT n = 4, iMSN-D2RKO n = 4); Gabrδ ZT7 Genotype: F(1, 29) = 7.445, p = 0.0107; Treatment: F(3, 29) = 11.26, p < 0.0001; Interaction: F(3, 29) = 3.378, p = 0.0315 (Vehicle and Saline: WT n = 6, iMSN-D2RKO n = 5, Vehicle and Cocaine: WT n = 6, iMSN-D2RKO n = 6; Pioglitazone and Saline: WT n = 4, iMSN-D2RKO n = 4; Pioglitazone and Cocaine: WT n = 3, iMSN-D2RKO n = 3); Adora2a ZT19: Genotype: F(1,30) = 1.352, p = 0.2540; Treatment: F(3, 30) = 2.071, p = 0.1250; Interaction: F(3, 30) = 1.406, p = 0.2603 (Vehicle and Saline: WT n = 6, iMSN-D2RKO n = 6; Vehicle and Cocaine: WT n = 5, iMSN-D2RKO n = 7; Pioglitazone and Saline: WT n = 3, iMSN-D2RKO n = 3; Pioglitazone and Cocaine WT n = 4, iMSN-D2RKO n = 4); Kcnd1 ZT19: Genotype: F(1, 34) = 1.903, p = 0.1767; Treatment: F(3, 34) = 0.7013, p = 0.5578; Interaction: F(3, 34) = 0.3919, p = 0.7596 (Vehicle and Saline: WT n = 6, iMSN-D2RKO n = 7; Vehicle and Cocaine WT n = 7, iMSN-D2RKO n = 7; Pioglitazone and Saline: WT n = 4, iMSN-D2RKO n = 3; Pioglitazone and Cocaine: WT n = 4, iMSN-D2RKO n = 4); Gabrδ ZT19 Genotype: F(1, 32) = 0.09598, p = 0.7587; Treatment: F(3, 32) = 0.8134, p = 0.4959; Interaction: F(3, 32) = 0.8259, p = 0.4893 (Vehicle and Saline: WT n = 6, iMSN-D2RKO n = 7; Vehicle and Cocaine WT n = 6, iMSN-D2RKO n = 6; Pioglitazone and Saline WT n = 3, iMSN-D2RKO n = 4; Pioglitazone and Cocaine: WT n = 4, iMSN-D2RKO n = 4)). Tukey’s multiple comparison test p-values as indicated. Data are presented as mean values ± SEM. c Simplified overview depicting D2R-mediated cocaine effect on circadian transcription of PPARγ target genes through PPARγ activation by prostaglandins (PGJ2). Dopamine (DA) activation of D2R stimulates Phospholipase A2 (PLA2) converting phosphatidylcholine (PC) to lysophosphatidylcholine (Lyso PC) and arachidonic acid (AA); AA is later converted into Prostaglandin (PGJ2). PGJ2 induces PPARδ nuclear translocation and transcriptional activation.

References

    1. Green CB, Takahashi JS, Bass J. The meter of metabolism. Cell. 2008;134:728–742. - PMC - PubMed
    1. Scheiermann C, Kunisaki Y, Frenette PS. Circadian control of the immune system. Nat. Rev. Immunol. 2013;13:190–198. - PMC - PubMed
    1. Welsh DK, Takahashi JS, Kay SA. Suprachiasmatic nucleus: cell autonomy and network properties. Annu. Rev. Physiol. 2010;72:551–577. - PMC - PubMed
    1. Albrecht U. Timing to perfection: the biology of central and peripheral circadian clocks. Neuron. 2012;74:246–260. - PubMed
    1. Dyar KA, et al. Atlas of circadian metabolism reveals system-wide coordination and communication between clocks. Cell. 2018;174:1571–1585 e1511. - PMC - PubMed

Publication types

MeSH terms