. 2020 Sep 7;11(1):4458.
doi: 10.1038/s41467-020-17720-5.

Transcriptomic analysis links diverse hypothalamic cell types to fibroblast growth factor 1-induced sustained diabetes remission

Affiliations

Transcriptomic analysis links diverse hypothalamic cell types to fibroblast growth factor 1-induced sustained diabetes remission

Marie A Bentsen et al. Nat Commun. .

Abstract

In rodent models of type 2 diabetes (T2D), sustained remission of hyperglycemia can be induced by a single intracerebroventricular (icv) injection of fibroblast growth factor 1 (FGF1), and the mediobasal hypothalamus (MBH) was recently implicated as the brain area responsible for this effect. To better understand the cellular response to FGF1 in the MBH, we sequenced >79,000 single-cell transcriptomes from the hypothalamus of diabetic Lepob/ob mice obtained on Days 1 and 5 after icv injection of either FGF1 or vehicle. A wide range of transcriptional responses to FGF1 was observed across diverse hypothalamic cell types, with glial cell types responding much more robustly than neurons at both time points. Tanycytes and ependymal cells were the most FGF1-responsive cell type at Day 1, but astrocytes and oligodendrocyte lineage cells subsequently became more responsive. Based on histochemical and ultrastructural evidence of enhanced cell-cell interactions between astrocytes and Agrp neurons (key components of the melanocortin system), we performed a series of studies showing that intact melanocortin signaling is required for the sustained antidiabetic action of FGF1. These data collectively suggest that hypothalamic glial cells are leading targets for the effects of FGF1 and that sustained diabetes remission is dependent on intact melanocortin signaling.


Conflict of interest statement

The authors M.A.B., D.M.R., Z.M., K.M., J.K.S., J.M.B., V.H.-P., J.T., K.M.A., C.L.F., K.J.K., C.R., K.L.E., B.H., G.J.M., B.R.K., J.-M.G.-V., M.W.S., and T.H.P. declare no competing interests. This work was partly funded by Novo Nordisk. The authors A.F.B., C.F., T.H.M., B.K., Y.Z., T.S., K.L.G., and A.S. are employed by Novo Nordisk.

Figures

Fig. 1
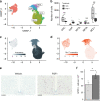
Fig. 1. Study design and icv FGF1-induced temporal glia responses.
a Diabetic Lepob/ob mice received a single intracerebroventricular (icv) injection of FGF1 (3 µg) or vehicle at Day 0. Hypothalami were harvested on Days 1, 5, and 42 after icv injection. Vehicle-injected mice were pair-fed (PF) to the amount of food consumed by icv FGF1-injected Lepob/ob mice and morning blood glucose levels were monitored. Plots are represented as mean ± SEM, and source data are provided as a Source data file; FGF1 (n = 17), vehicle (n = 15). b Uniform manifold approximation and projection (UMAP) clustering of hypothalamic nuclei from Day 1 and Day 5 snRNA-seq datasets. Source data are available through the NCBI Gene Expression Omnibus (GEO; GSE153551). c UMAP clustering from b colored according to treatment group and time of euthanasia. d UMAP clustering of hypothalamic non-neuronal cells from Day 1 and Day 5 snRNA-seq datasets. e Number of differentially expressed genes (DEGs) for non-neuronal subclusters at Day 1 identified through repeated downsampling (10 cells/group/cell type/iteration; 100 iterations), n = 3 mice/group. Data are presented as median with interquartile range (IQR) and summary statistics are provided as a Source data file. f Each bar represents the number of unique DEGs for one or a certain combination of cell types (pseudobulk approach, see “Methods”) from Day 1 snRNA-seq dataset, n = 3 mice/group. g Associated Gene Ontology terms (biological process category; red), KEGG (blue) and REACTOME (green) pathways associated with DEGs in the indicated cell types. Point size indicates −log10(p value) (Bonferroni adjusted). h Weighted gene co-expression network analysis (WGCNA) of tanycytes, ependymal cells, and astrocytes from Days 1 and 5 snRNA-seq datasets. Significantly changed gene modules (linear mixed-effects model; FDR < 0.05) are indicated with color and cell-specific expression is indicated by shape. Modules are plotted according to their β-values; Day 1 (n = 3/group), Day 5 (n = 2/group). i Module plots of top 15 genes of sn-glia-M1sn-glia-M3, which are upregulated on Day 1. Genes in red denote genes mentioned in the text. Astro astrocytes, Tany tanycytes, Epend ependymal cells, Olig oligodendrocytes, OPC oligodendrocyte precursor cell, COP committed to differentiate oligodendrocyte, VLMC vascular leptomeningeal cell.
Fig. 2
Fig. 2. Tanycyte module expression maps to the spatial distribution lining the third ventricle.
a UMAP clustering of tanycytes (β2-, β1-, α1-, α2-Tanycytes) from the Day 5 single-cell RNA-sequencing (scRNA-seq) dataset. Cell type annotations were inferred from a published dataset. b Tanycyte lineage cells plotted on principal components 1 and 2 revealed a trajectory (left). The colors represent the subtype of each cell from a. A principal curve fit across the trajectory was used to assign a pseudoventricle score to each cell corresponding to the spatial location of that cell type along third ventricular (3V) wall. Density plot of each tanycyte subpopulation plotted along the pseudoventricle revealed a continuum of gene expression and non-distinct shifts in the expression of marker genes along the pseudoventricle. c Scaled module expression of sc-tany-M1 in FGF1-treated (black) and vehicle (gray) tanycytes (linear mixed-effects model; bin size of 1; mean ± SEM; *p < 0.05) (Bonferroni adjusted) from the Day 5 scRNA-seq dataset (n = 6 mice/group). Exact adjusted p values are provided in Supplementary Data 5. ME module eigengene. d Gene–gene network plot of the correlation of top 15 genes in module sc-tany-M1 (left) and associated pathways (right). Genes mentioned in the text are labeled in red. e Representative images of immunolabeling of vimentin in diabetic Lepob/ob mice 1 week after vehicle or icv FGF1 injection. Pixel dimensions: 0.27 × 0.27 × 2.00 microns. Quantification: dots represent volume of vimentin-positive voxels assessed by iMARIS for individual animals (mean from 2 sections per animal, n = 4/group), mean ± SEM. Unpaired t test, two tailed, *p = 0.022 (not adjusted). Source data are provided as a Source data file. f Scaled module expression of sc-tany-M2, sc-tany-M3, sc-tany-M5, sc-tany-M6, and sc-tany-M23 with 5 consecutive points of difference in expression along the pseudoventricle between FGF1-treated (black) and vehicle (gray) tanycytes (linear mixed-effects models; bin size of 1; mean ± SEM; *p < 0.05) (Bonferroni adjusted) from the Day 5 scRNA-seq dataset (n = 6 mice/group). Exact adjusted p values are provided in Supplementary Data 5.
Fig. 3
Fig. 3. Evolution of the astrocyte response to icv FGF1.
a Identification of sn-astro-M1sn-astro-M3 upregulated at Day 1 and sn-astro-M4 upregulated at Day 5 in FGF1-treated mice (linear mixed-effects model, FDR < 0.05) using WGCNA on astrocytes from the snRNA-seq datasets. Enrichment of DEGs in astrocytes in response to lipopolysaccharide (neurotoxic, A1), middle cerebral artery occlusion (neuroprotective, A2), or overlapping genes (PAN) or enrichment of genes induced by neuron interaction (NeurI) or neuron activity (NeurA). Point size is scaled by −log10(p value) (Bonferroni adjusted). b Correlation of top 15 genes of sn-astro-M1sn-astro-M4. Node size; correlation of the given gene with the module eigengene (kME). c Number of DEGs for non-neuronal subclusters identified in the Day 5 scRNA-seq dataset with repeated downsampling (10 cells/group/cell type/iteration, 100 iterations; n = 6 mice/group), median (IQR). Summary statistics provided as a Source data file. Macro macrophages, Peri pericytes, ABC arachnoid barrier cells, SMC smooth muscle cells, VLMC vascular leptomeningeal cells. d Volcano plot of pseudobulk DEGs in astrocytes Day 5, scRNA-seq dataset between FGF1 and vehicle. Blue, genes with FDR < 0.05; red, genes with FDR < 0.05 and |log2 fold change| > 0.25; green, genes with |log2 fold change| > 0.25; gray, genes below both thresholds. e Astrocytes WGCNA (Day 5; scRNA-seq) identified three significant upregulated (sc-astro-M1sc-astro-M3; linear mixed-effects model; FDR < 0.05) and three downregulated (sc-astro-M5, sc-astro-M6, sc-astro-M9) modules in FGF1-treated mice, median (IQR). Lower panel: hypergeometric enrichment analysis of single-nucleus RNA-sequencing (snRNA-seq) and scRNA-seq astrocyte modules. Point size is scaled by −log10(p value) (Bonferroni adjusted; n = 6 mice/group). f Correlation of top 15 genes in modules sc-astro-M1 and sc-astro-M3. g Representative images of immunoreactivity of aquaporin 4 (Aqp4; red) and glial fibrillary acid protein (GFAP; green) from coronal sections of hypothalamus from diabetic Lepob/ob mice 1 week after either vehicle or FGF1 icv injection. Lower panels: higher magnification of white inset. Scale bar 100 μm (top), 50 μm (lower). Pixel dimensions: 0.27 × 0.27 × 2.00 microns. Quantification: dots represent volume of Aqp4- or GFAP-positive voxels for individual animals (mean from 2 sections per animal, n = 4/group), mean ± SEM. Unpaired t test, two tailed, *p = 0.037, **p = 0.003 (not adjusted). Source data are provided as a Source data file. Genes mentioned in the text are labeled in red.
Fig. 4
Fig. 4. Icv FGF1 induces a population of differentiating oligodendrocytes.
a UMAP clustering of cells in the oligodendrocyte lineage from the Day 5 scRNA-seq dataset. Cell type annotations were inferred from a published dataset. b Dots represent mean number of cells per animal and lines represent mean ± SEM. Unpaired t test, two tailed, *p < 0.022, **p < 0.0074 (Bonferroni adjusted; n = 6 mice/group); ns not significant. Source data for each subcluster are provided as a Source data file. c UMAP of cells in the oligodendrocyte lineage labeled according to maturation in Monocle-derived pseudotime. d UMAP of cells expressing Gpr17, a maturing oligodendrocyte marker. e RNAScope detection of Gpr17 expression in the hypothalamus of Lepob/ob mice 5 days after icv FGF1 or vehicle. f Quantification of Gpr17+ cells from the ARC area (2 sections per animal, icv vehicle (n = 4) and icv FGF1 (n = 5)), mean ± SEM. Unpaired t test, two tailed, *p = 0.005 (not adjusted). Source data are provided as a Source data file. NFOL newly formed oligodendrocyte, MFOL myelin-forming oligodendrocyte, MOL1 myelinating oligodendrocyte.
Fig. 5
Fig. 5. Effects of icv FGF1 on Agrp neurons.
a UMAP clustering of neurons from the snRNA-seq dataset that confidently mapped to published datasets. Original cell type annotations from the published datasets are indicated in brackets. b Numbers of DEGs for neuron subclusters identified using repeated downsampling (10 cells/group/cell type/iteration, 100 iterations; n = 3 mice/group), median (IQR). c Volcano plot of pseudobulk DEGs in Agrp neurons from the Day 1 snRNA-seq dataset between FGF1 and vehicle. Red, genes with FDR < 0.05 and |log2 fold change| > 0.25; green, genes with an |log2 fold change| > 0.25; gray, genes below both thresholds. d Gene Ontology (biological process; red) and REACTOME (blue) terms enriched for DEGs in Agrp neurons at Day 1. Circle size denotes gene overlap with the identified geneset. e Principal component analysis of Agrp neurons sampled at Days 1 and 5 (vehicle and FGF1) revealed strong separation from other groups at PC4 and PC5, respectively (n = 3 mice/group Day 1, n = 2 mice/group Day 5), median (IQR). f Gene Ontology term (biological processes) of highly loading genes on PC5. g Normalized expression of Agrp and Npy in Agrp neurons across the 4 groups (FGF1, Days 1 and 5; vehicle, Days 1 and 5; n = 3 mice/group Day 1, n = 2 mice/group Day 5). h Top panel: representative electron microscopic images of coverage of synapses between axonal boutons (B) and dendritic spines (S) by peri-synaptic astrocytic in the ARC area of Lepob/ob mice. Bottom panel: immunostaining for Npy. Scale bar 500 nm. Quantification: dots represent percentage of astrocytic coverage for individual animals (mean of 30 synapses per animal, n = 4/group), mean ± SEM. Unpaired t test, two tailed, ***p < 0.0001 (not adjusted). i Contacts between GFAP(+) astrocytes (green) and Agrp(+) neurons in the ARC area (equivalent to outline in g) 1 week following icv FGF1 or vehicle injection of Lepob/ob. Yellow represents co-labeled GFAP-positive and Agrp-positive voxels. Scale bar 8 μm. Pixel dimensions: 0.057 × 0.057 × 0.500 microns. Quantification: dots represent mean contact volume over high power field (hpf: 116.5 × 116.5 microns) for individual animals (2 sections per animal, n = 4/group), mean ± SEM. Unpaired t test, two tailed, **p = 0.0093 (not adjusted). Source data and summary statistics are provided as a Source data file.
Fig. 6
Fig. 6. FGF1-induced sustained diabetes remission is melanocortin dependent.
a Blood glucose levels and food intake in diabetic Mc4r−/− (Mc4r knockout) mice injected with icv FGF1 (3 µg) or vehicle (n = 8/group). b Blood glucose levels and food intake in agouti (KK-Ay) mice icv injected with FGF1 (3 µg) (n = 12) or vehicle (n = 9). Vehicle-injected mice were not pair-fed to the intake of mice receiving FGF1. c Blood glucose levels and food intake of diabetic Lepob/ob mice treated with either a single icv injection of FGF1 (3 µg) or vehicle, followed immediately by continuous icv infusion of either vehicle or the Mc4r antagonist SHU9119 (5 nmol/day) for 28 days. Veh+Veh (n = 8), FGF1+Veh (n = 9), Veh+SHU (n = 6), FGF1+SHU (n = 8). Data are represented as mean ± SEM, source data are provided as a Source data file.
Fig. 7
Fig. 7. FGF1-induced long-term changes in the hypothalamus.
a Number of DEGs (|log2 fold change| > 0.5; FDR < 0.05) from bulk RNA-sequencing (bRNA-seq) of hypothalami from Lepob/ob mice injected with icv FGF1 or vehicle and harvested Days 1 (FGF1 n = 10, vehicle n = 4), 5 (FGF1 n = 9, vehicle n = 7), and 42 (n = 5 mice/group) after injection. Control vehicle mice were pair-fed to FGF1-injected mice. b Rank–rank hypergeometric overlap maps of the degree of overlapping genes between Day 1 and Day 5 (top) and between Day 5 and Day 42 (bottom). Venn diagrams and top overlapping genes (middle panel). Enrichment of Gene Ontology biological process terms of overlapping genes (right panel). c Normalized counts (mean ± SEM, n = 5 mice/group) of the selected glial genes from the bRNA-seq datasets Days 1, 5, and 42 after icv FGF1 or vehicle injection. d Normalized counts (mean ± SEM, n = 5 mice/group) of Agrp, Npy, Mef2c, and Pomc expression Days 1, 5, and 42 after icv FGF1 or vehicle injection. e Targeted relative gene expression of Agrp, Npy, and Pomc. Unpaired t test, two tailed, *p = 0.04 (not adjusted, n = 5 mice/group); ns not significant. Source data are provided as a Source data file. f Threshold-free geneset enrichment analysis (Gene Ontology biological processes terms) of DEGs identified in bRNA-seq data at Days 1, 5, and 42. Point size is scaled by −log10(p value) (Bonferroni adjusted) and is colored based on the normalized enrichment score (NES). g Representative electron microscopic images of synapses of Lepob/ob mice 5 days after icv injection of either vehicle or FGF1. syn synaptic active zone, DCV dense-core vesicle, SV small light-core vesicle. Scale bar 500 nm. Quantification: dots represent mean %DCV/synapse per mouse (25 synapses per animal, n = 4/group). Unpaired t test, two tailed, *p = 0.01 (not adjusted); ns not significant. Source data are provided as a Source data file. Data are presented as mean ± SEM.

References

    1. Kalyani RR, Golden SH, Cefalu WT. Diabetes and aging: unique considerations and goals of care. Diabetes Care. 2017;40:440–443. - PMC - PubMed
    1. Edelman SV, Polonsky WH. Type 2 diabetes in the real world: the elusive nature of glycemic control. Diabetes Care. 2017;40:1425–1432. - PubMed
    1. Deem JD, Muta K, Scarlett JM, Morton GJ, Schwartz MW. How should we think about the role of the brain in glucose homeostasis and diabetes? Diabetes. 2017;66:1748–1765. - PMC - PubMed
    1. Scarlett JM, et al. Central injection of fibroblast growth factor 1 induces sustained remission of diabetic hyperglycemia in rodents. Nat. Med. 2016;22:800–806. - PMC - PubMed
    1. Brown JM, et al. The hypothalamic arcuate nucleus-median eminence is a target for sustained diabetes remission induced by fibroblast growth factor 1. Diabetes. 2019;68:1054–1061. - PMC - PubMed

Publication types

MeSH terms