. 2020 Sep 7;11(1):4433.
doi: 10.1038/s41467-020-18278-y.

Mutual modulation between surface chemistry and bulk microstructure within secondary particles of nickel-rich layered oxides

Affiliations

Mutual modulation between surface chemistry and bulk microstructure within secondary particles of nickel-rich layered oxides

Shaofeng Li et al. Nat Commun. .

Abstract

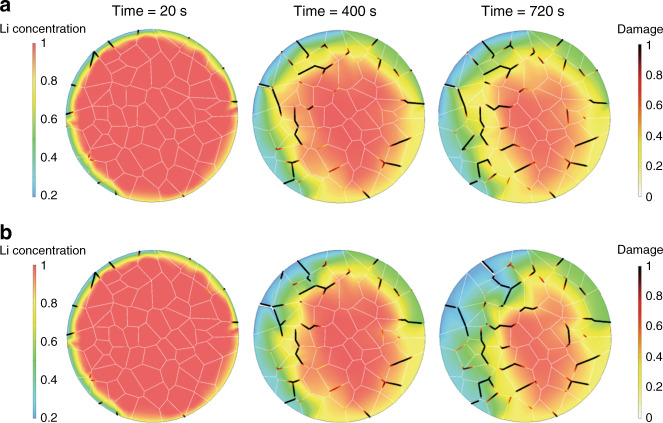
Surface lattice reconstruction is commonly observed in nickel-rich layered oxide battery cathode materials, causing unsatisfactory high-voltage cycling performance. However, the interplay of the surface chemistry and the bulk microstructure remains largely unexplored due to the intrinsic structural complexity and the lack of integrated diagnostic tools for a thorough investigation at complementary length scales. Herein, by combining nano-resolution X-ray probes in both soft and hard X-ray regimes, we demonstrate correlative surface chemical mapping and bulk microstructure imaging over a single charged LiNi0.8Mn0.1Co0.1O2 (NMC811) secondary particle. We reveal that the sub-particle regions with more micro cracks are associated with more severe surface degradation. A mechanism of mutual modulation between the surface chemistry and the bulk microstructure is formulated based on our experimental observations and finite element modeling. Such a surface-to-bulk reaction coupling effect is fundamentally important for the design of the next generation battery cathode materials.


Conflict of interest statement

The authors declare no competing interests.

Figures

Fig. 1
Fig. 1. Schematic illustration of the correlative imaging for an NMC811 secondary particle.
In the full-field TXM measurement (a, light blue color), the transmission images of the particle were acquired as the sample is rotated in a tomographic scan. In the soft X-ray nanoprobe measurement (b, dark green color), the total electron yield (TEY) signal is recorded by measuring the drain current. Through raster scanning the particle with respect to the focal point, the surface chemical inhomogeneity (c) is revealed based on the energy-dependent local TEY signal (d) over different surface regions.
Fig. 2
Fig. 2. Structural complexity within a charged NMC811 secondary particle.
a 3D rendering of the tomographic data over the particle with the perspective views of a few virtual slices through different depths displayed in the center. b The three cone-shape cutout regions from the nano-tomography data. c Schematic of the local porosity, which is defined by the volume ratio of the void within the respective cone regions. d The calculated porosity map, which shows the porosity value assigned to the surface of particle. The angle θ can be tuned to balance the signal-to-noise and the lateral resolution. The presented maps are based on the calculation with θ set to be 3o. The scale bar in a is 5 μm.
Fig. 3
Fig. 3. The correlation between the local surface reconstruction and the bulk porosity.
a The particle morphology and the surface (~5 nm depth) Ni valence state distribution. b The bulk porosity map. c The line profile from points A to B as illustrated in a, b. The ξ is the ratio between the TEY intensity at 856.2 eV and the sum of that at 854.0 eV and 856.2 eV pixel by pixel, which represents relative Ni valence state. d The correlation plot for all the data points in a, b. The plot is color coded to the density of the data point (see colormap in the inset). A weak but clear negative correlation (see regression line in d) is observed between the surface Ni valence state and the bulk porosity. The scale bar in b is 5 μm.
Fig. 4
Fig. 4. FEM of charge distribution and intergranular fracture in an NMC secondary particle.
The evolution of Li concentration and the damage along the grain boundaries without (a) and with (b) considering the liquid electrolyte penetration.
Fig. 5
Fig. 5. FEM of surface passivation and structural decohesion in an NMC secondary particle.
The Li concentration and intergranular damage at two charging times t = 20 s (a) and t = 720 s (b). The enlarged inset in b shows an overall compressive hoop stress in the passivation layer and an intergranular crack passing through the passivation layer.
Fig. 6
Fig. 6. Schematic illustration of the surface-to-bulk mutual modulation.
The interplay between the surface chemistry and the bulk microstructure within an individual NMC particle is presented by the arrows (not to scale).

References

    1. Nitta N, Wu F, Lee JT, Yushin G. Li-ion battery materials: present and future. Mater. Today. 2015;18:252–264. doi: 10.1016/j.mattod.2014.10.040. - DOI
    1. Zhao W, et al. High voltage operation of Ni-rich NMC cathodes enabled by stable electrode/electrolyte interphases. Adv. Energy Mater. 2018;8:1800297. doi: 10.1002/aenm.201800297. - DOI
    1. Tian C, et al. Depth-dependent redox behavior of LiNi0.6Mn0.2Co0.2O2. J. Electrochem. Soc. 2018;165:A696–A704. doi: 10.1149/2.1021803jes. - DOI
    1. Gent WE, et al. Persistent state-of-charge heterogeneity in relaxed, partially charged Li1-xNi1/3Co1/3Mn1/3O2 secondary particles. Adv. Mater. 2016;28:6631–6638. doi: 10.1002/adma.201601273. - DOI - PubMed
    1. Yang Y, et al. Quantification of heterogeneous degradation in Li-ion batteries. Adv. Energy Mater. 2019;9:1900674. doi: 10.1002/aenm.201900674. - DOI