

Phenome-wide Mendelian randomization mapping the influence of the plasma proteome on complex diseases
- PMID: 32895551
- PMCID: PMC7610464
- DOI: 10.1038/s41588-020-0682-6
Phenome-wide Mendelian randomization mapping the influence of the plasma proteome on complex diseases
Abstract
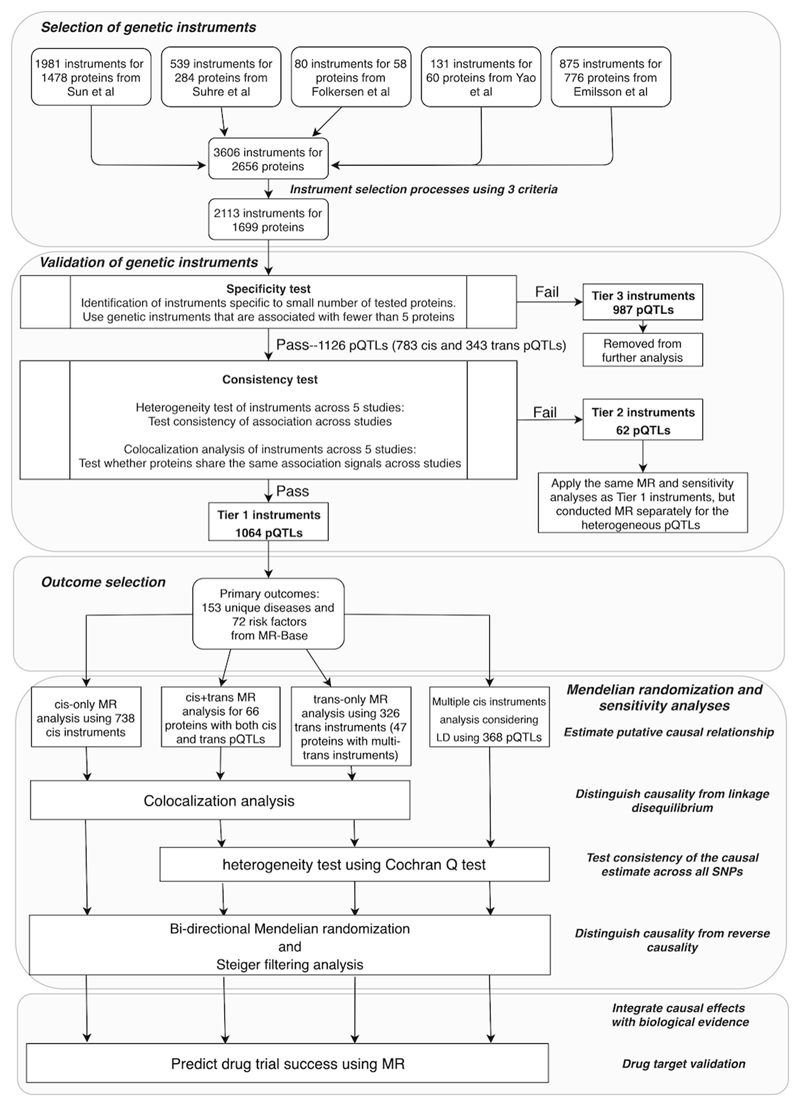
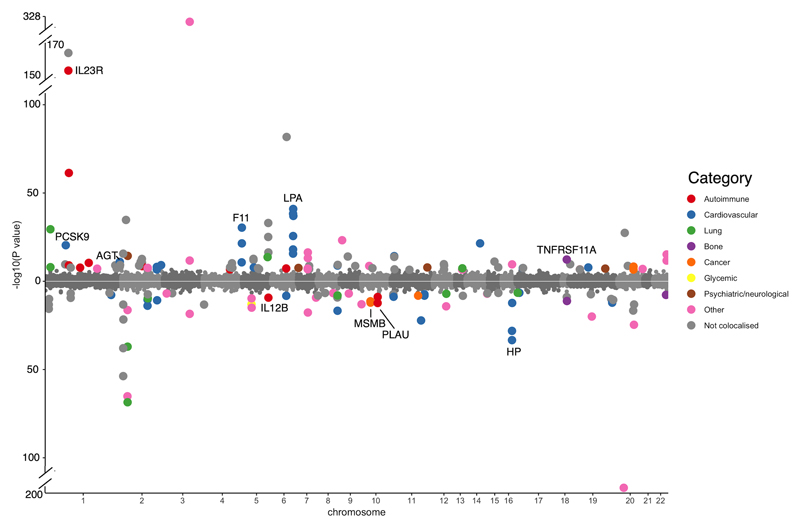
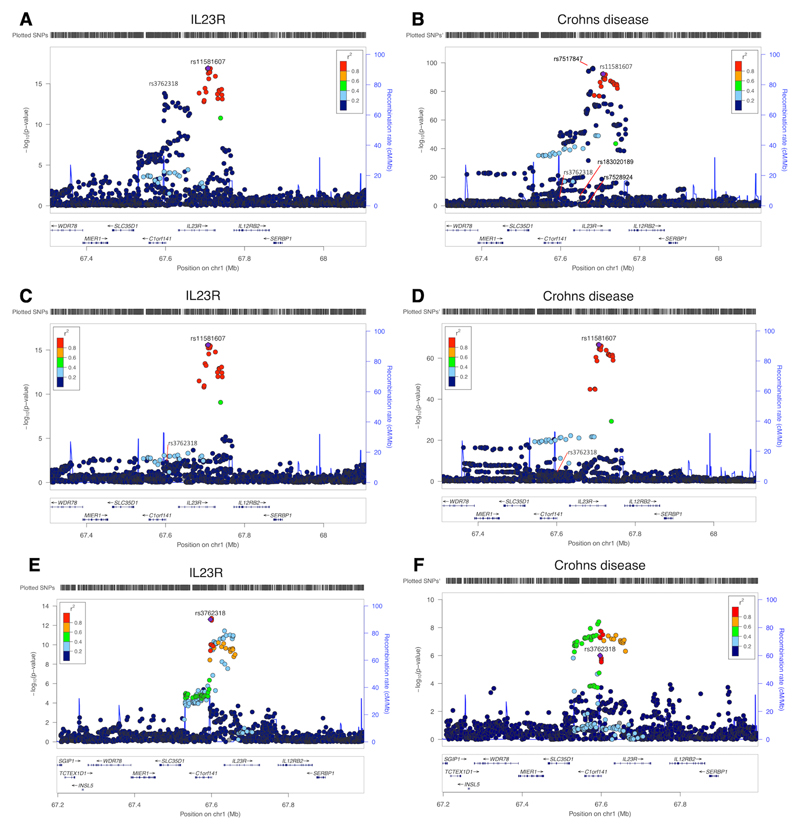
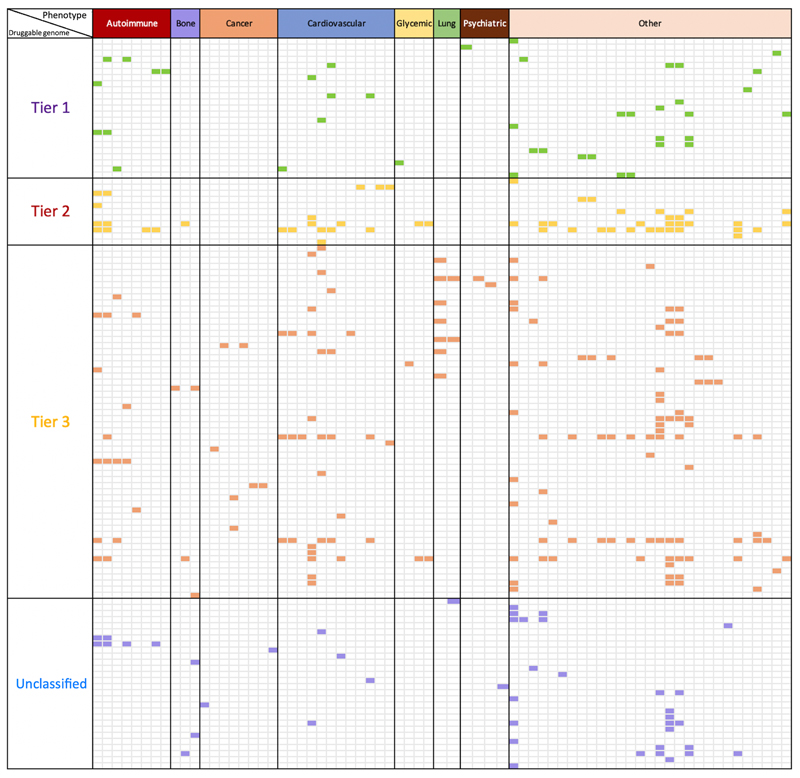
The human proteome is a major source of therapeutic targets. Recent genetic association analyses of the plasma proteome enable systematic evaluation of the causal consequences of variation in plasma protein levels. Here we estimated the effects of 1,002 proteins on 225 phenotypes using two-sample Mendelian randomization (MR) and colocalization. Of 413 associations supported by evidence from MR, 130 (31.5%) were not supported by results of colocalization analyses, suggesting that genetic confounding due to linkage disequilibrium is widespread in naïve phenome-wide association studies of proteins. Combining MR and colocalization evidence in cis-only analyses, we identified 111 putatively causal effects between 65 proteins and 52 disease-related phenotypes ( https://www.epigraphdb.org/pqtl/ ). Evaluation of data from historic drug development programs showed that target-indication pairs with MR and colocalization support were more likely to be approved, evidencing the value of this approach in identifying and prioritizing potential therapeutic targets.
Conflict of interest statement
Competing Interests Statement
A. G., L. M., M. R. H., D. W., M. R. N., R. S., and R. A. S.are employees and shareholders in GlaxoSmithKline. H. R., J. Z. L., and K. E. are employees and shareholders in Biogen. J. Z and V. H. is employed on a grant funded by GlaxoSmithKline. D. B. is employed on a grant funded by Biogen. T. R. G., G. H., and G. D. S. receive funding from GlaxoSmithKline and Biogen for the work described here. A. S. B. has received grants from Merck, Novartis, Biogen, Pfizer and AstraZeneca. M. V. H. has collaborated with Boehringer Ingelheim in research, and in accordance with the policy of the Clinical Trial Service Unit and Epidemiological Studies Unit (University of Oxford), did not accept any personal payment.
This work was supported by Health Data Research UK, which is funded by the UK Medical Research Council, Engineering and Physical Sciences Research Council, Economic and Social Research Council, Department of Health and Social Care (England), Chief Scientist Office of the Scottish Government Health and Social Care Directorates, Health and Social Care Research and Development Division (Welsh Government), Public Health Agency (Northern Ireland), British Heart Foundation and Wellcome.
Figures
References
-
- Plenge RM, Scolnick EM, Altshuler D. Validating therapeutic targets through human genetics. Nat Rev Drug Discov. 2013;12:581–594. - PubMed
-
- Hay M, Thomas DW, Craighead JL, Economides C, Rosenthal J. Clinical development success rates for investigational drugs. Nat Biotechnol. 2014;32:40–51. - PubMed
-
- Arrowsmith J, Miller P. Phase II and Phase III attrition rates 2011-2012. Nat Rev Drug Discov. 2013;12:569. - PubMed
-
- Harrison RK. Phase II and phase III failures: 2013-2015. Nat Rev Drug Discov. 2016;15:817. - PubMed
Publication types
MeSH terms
Substances
Grants and funding
- MR/L003120/1/MRC_/Medical Research Council/United Kingdom
- 19169/CRUK_/Cancer Research UK/United Kingdom
- BTRU-2014-10024/DH_/Department of Health/United Kingdom
- RG/18/13/33946/BHF_/British Heart Foundation/United Kingdom
- C52724/A20138/CRUK_/Cancer Research UK/United Kingdom
- MC_UU_00002/7/MRC_/Medical Research Council/United Kingdom
- C18281/A19169/CRUK_/Cancer Research UK/United Kingdom
- 20138/CRUK_/Cancer Research UK/United Kingdom
- MC_UU_00011/4/MRC_/Medical Research Council/United Kingdom
- 208806/Z/17/Z/WT_/Wellcome Trust/United Kingdom
- G9815508/MRC_/Medical Research Council/United Kingdom
- FS/18/23/33512/BHF_/British Heart Foundation/United Kingdom
- MC_PC_19009/MRC_/Medical Research Council/United Kingdom
- 217065/WT_/Wellcome Trust/United Kingdom
- MC_PC_15018/MRC_/Medical Research Council/United Kingdom
- 208806/WT_/Wellcome Trust/United Kingdom
- 204623/Z/16/Z/WT_/Wellcome Trust/United Kingdom
- RG/13/13/30194/BHF_/British Heart Foundation/United Kingdom
- 102215/2/13/2/WT_/Wellcome Trust/United Kingdom
- SP/09/002/BHF_/British Heart Foundation/United Kingdom
- 29019/CRUK_/Cancer Research UK/United Kingdom
- MC_UU_00011/1/MRC_/Medical Research Council/United Kingdom
LinkOut - more resources
Full Text Sources
