. 2020 Oct;26(10):1541-1548.
doi: 10.1038/s41591-020-1023-0. Epub 2020 Sep 7.

Polygenic architecture informs potential vulnerability to drug-induced liver injury

Affiliations

Polygenic architecture informs potential vulnerability to drug-induced liver injury

Masaru Koido et al. Nat Med. 2020 Oct.

Abstract

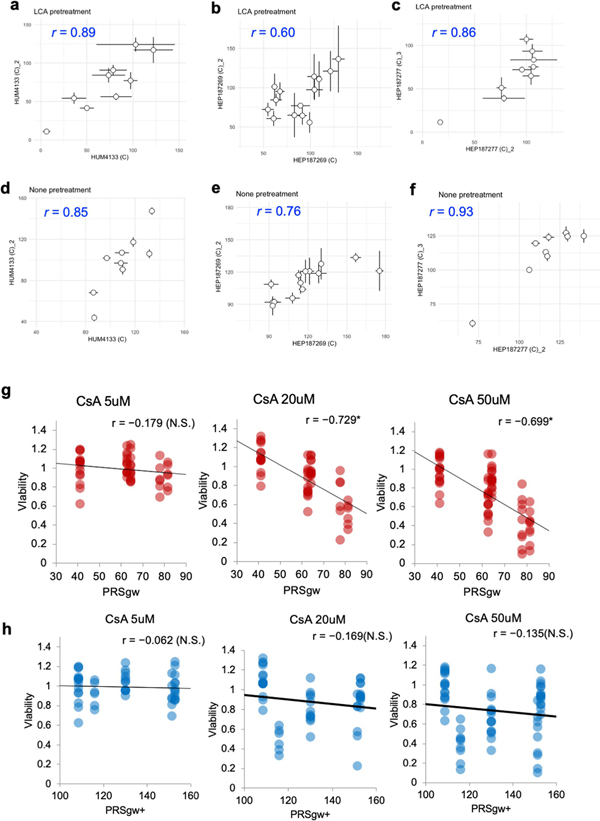
Drug-induced liver injury (DILI) is a leading cause of termination in drug development programs and removal of drugs from the market; this is partially due to the inability to identify patients who are at risk1. In this study, we developed a polygenic risk score (PRS) for DILI by aggregating effects of numerous genome-wide loci identified from previous large-scale genome-wide association studies2. The PRS predicted the susceptibility to DILI in patients treated with fasiglifam, amoxicillin-clavulanate or flucloxacillin and in primary hepatocytes and stem cell-derived organoids from multiple donors treated with over ten different drugs. Pathway analysis highlighted processes previously implicated in DILI, including unfolded protein responses and oxidative stress. In silico screening identified compounds that elicit transcriptomic signatures present in hepatocytes from individuals with elevated PRS, supporting mechanistic links and suggesting a novel screen for safety of new drug candidates. This genetic-, cellular-, organoid- and human-scale evidence underscored the polygenic architecture underlying DILI vulnerability at the level of hepatocytes, thus facilitating future mechanistic studies. Moreover, the proposed 'polygenicity-in-a-dish' strategy might potentially inform designs of safer, more efficient and robust clinical trials.


Conflict of interest statement

Competing interests

Figures

Extended Data Fig. 1 |
Extended Data Fig. 1 |. Overview of our polygenicity analysis.
Workflow of shared genetic aetiology analysis was shown. Left: Processing strategy of iDILIC/DILIN GWAS summary statistics (summary data); Right: TAK-875 GWAS procedures.
Extended Data Fig. 2 |
Extended Data Fig. 2 |. TAK-875 DILI severity and GWAS analysis.
a, Ratio of ALT, AST, and BILT peak values to their basal values. b, Distribution of time from start of drug to DILI onset (days). c, Exclusion criteria of TAK-875 samples based on genetic ancestors. d, The outlier of TAK-875 samples was not observed in Northern Europeans from Utah (CEU), Tuscans from Italy (TSI) and Mexican (MEX) ancestry. e, Quantile-Quantile plot for the TAK-875 GWAS. f, g, Polygenic test using hepatocellular DILI-GWAS summary statistics in (a) and All DILI-GWAS ones in (b). X-axis, the total number of SNPs, ordered by iDILIC/DILIN GWAS association; y-axis, explained the variance of TAK-875 white GWAS; color scale, p-value for the shared genetic aetiology analysis.
Extended Data Fig. 3 |
Extended Data Fig. 3 |. Distribution and performance of each PRS.
a, Distribution of CM-DILI PRSlimited in TAK-875 DILI patients and the tolerances (see Fig. 1 and Supplementary Text). b, AUROC values and their 95% confidence interval for the indicated PRS. c, Histogram of the indicated PRS.
Extended Data Fig. 4 |
Extended Data Fig. 4 |. correlation between CM-DILI PRSgw and biomarkers for DILI in TAK-875 treated subjects.
Scatter plot and the linear regression line of clinical laboratory test value in basal state and CM-DILI PRSgw in 172 TAK-875 treated patients (cases and controls). *, p < 0.05; **, p < 0.01, ***, p < 0.001 in coefficients of risk score. ALTB, Basal ALT; ASTB, Basal AST; BILTB, Basal total bilirubin.
Extended Data Fig. 5 |
Extended Data Fig. 5 |. Predictive accuracy of CM-DILI PRSgw for Flucloxacillin or Amoxicillin-clavulanate DILI.
Distribution of CM-DILI PRSgw and HC-DILI PRSgw in Flucloxacillin or Amoxicillin-clavulanate DILI patients with the indicated DILI type (cholestasis/mixed or hepatocellular). AUROC (95% CI) and P-value of two-tailed Wilcoxon–Mann–Whitney U test were shown.
Extended Data Fig. 6 |
Extended Data Fig. 6 |. GARFIELD plot of CM-DILI GWAS summary statistics in cirulli et al., 2019.
a, Chromatin state, b, FAIR-seq, c, ENCODE DNase1 footprints, d, Genic annotation.
Extended Data Fig. 7 |
Extended Data Fig. 7 |. Multi-donor iPSc-HLO cholestatic DILI assays.
a, Bright field images of multi-donor iPSC and iPSC-HLO. b, Immunofluorescence staining of Albumin (ALB), BSEP, CD31 and HNF4a in multi-donor iPSC-HLO. c, ALB production during 24 hours in multi-donor iPSC-HLO. Data represent means ± SD (n = 3). d, CYP3A4 activity. Data represent means ± SD (n = 3). e, CLF accumulation and cell death signal in 1383D2 iPSCs derived iPSC-HLOs under CsA treatment for 24hr and 72hr. f, Viability after 24hr (dotted line) and 72hr (black line) CsA treatment in iPSC-HLO model. The ATP levels were normalized by the area of iPSC-HLO (see Materials and Methods).
Extended Data Fig. 8 |
Extended Data Fig. 8 |. Transcriptomic expression profiling of PHH cells at basal state.
a-g, Basal expression levels of mRNA were shown by the indicated signature of gene sets. Color scale and sample annotation colors were shown in the bottom right. (a) Liver signature genes. (b) Signature of gene set characterizing liver sinusoidal endothelial cell (LSEC). (c) Signature of gene set characterizing hepatic stellate cell (HSC). (d) all drug transport proteins and proteins involved in bile transport and cholestasis (TCP, OATPs, OCT1, OAT2, CNT1, CNT2, ENT1, ENT2, MDR1, MDR3, MRP2, BSEP, BCRP, MATE1, MRP3, MRP4), mRNA coding proteins of N; (e-g) mRNA coding phase 1, 2, and 3 enzymes. The Z-scores of log2(RPM+1) values were calculated within the indicated samples. Gene with RPM = 0 in all of the samples were excluded. PHH_1day_1/_2, PHH cells after 1 day of culturing (suffix means experimental batch), which was used for assessments of drug-induced transcriptomic change; PHH_2d, PHH cells after 2days of culturing; FLT, fetal liver tissue; ALT, adult liver tissue.
Extended Data Fig. 9 |
Extended Data Fig. 9 |. reproducibility of drug toxicity assay of PHH cells under LCA pretreatment.
ac, Drug sensitivity comparison between different days’ experiments under LCA pretreatments. (a) HUM4133. (b) HEP187269. (c) HEP187277. d–f, Drug sensitivity comparison between different days’ experiments under none pretreatments. (d) HUM4133. (e) HEP187269. (f) HEP187277. (g, h) Viability comparison of multi-donor iPSC-HLO models under the indicated CsA treatment without LCA. Pearson’s r for correlation with PRSgw (g) or PRSgw+ h), and its P-value is described. *, p<0.05. We regress mean viability for each donor by PRSgw or PRSgw+ and calculated the P-values.
Extended Data Fig. 10 |
Extended Data Fig. 10 |. Decreased mitochondria activity by cholestatic DILI drug treatment.
Live staining for TMRM and mitochondria levels (mitotracker) in 1383 iPSC-HLO model under CsA treatment for 72hr.
Fig. 1 |
Fig. 1 |. Polygenic architecture of DILI.
a, Summary of PRSs and their sources. b, Manhattan plot of P values (logistic regression model, from SNPTEST software) in TAK-875 white GWAS. The blue line is a suggestive cutoff (P <1 × 10−5). c, Polygenic test using CM-DILI GWAS summary statistics. x axis, total number of SNPs, ordered by iDILIC–DILIN GWAS association; y axis, explained variance of TAK-875 DILI phenotype from iDILIC–DILIN GWAS signals; color scale, one-tail P value for the shared genetic aetiology test from PRSice software. The described PGWAS indicates the corresponding thresholds to the x axis. R2, percent of variance explained. d, GARFIELD plot of CM-DILI GWAS summary statistics in ref. . Enrichment in FAIRE-seq (formaldehyde-assisted isolation of regulatory elements) annotations in left and genic state in right. e, Enriched experimentally known or related pathways associated with CM-DILI. CM-DILI GWAS summary statistics in ref. were used. The empirical P values were from Pascal software. f, Distribution of PRS in TAK-875 DILI patients (cases, n = 39 individuals) and matched patients treated with TAK-875 without DILI (controls, n = 122 individuals). For each type of PRS, scores were centred on the median values in controls. *P < 0.05 (two-tailed Wilcoxon–Mann–Whitney U test; P = 0.0036 for CM-PRSgw, P = 0.70 for HC-PRSgw, P = 0.27 for ALL-PRSgw and P = 0.029 for CM-PRSgw+). For the box plot, the box represents the first and third quartiles; the center line represents the median; the upper whisker extends from the hinge to the highest value that is within 1.5 × IQR of the hinge; the lower whisker extends from the hinge to the lowest value within 1.5 × IQR of the hinge; and the data beyond the end of the whiskers were plotted as points. ES, embryonic stem; IQR, interquartile range; NS, not significant.
Fig. 2 |
Fig. 2 |. Polygenic risk score based human stratification by in vitro multi-drug-induced CM-DILI assays.
a, Workflow of comparison. b, Viability comparison of multi-donor iPSC-HLO models (triangle) and primary human hepatocytes (circle) under multiple DILI drug treatments. See Supplementary Table 4 for donor information per drug. c, Comparison of Pearson correlation coefficients between the survival rate of the liver model (mean value for each donor) and the PRS (PRSgw or PRSgw+) under indicated drugs. *P < 0.01 (two-tailed Welch’s t-test); P = 0.0038 for cholestatic DILI drugs treatment and P = 0.0005 for hepatocellular DILI drugs treatment. For the violin plot, the center point represents the median; the upper whisker extends from the hinge to the highest value that is within 1.5 IQR of the hinge; and the lower whisker extends from the hinge to the lowest value within 1.5 IQR of the hinge. IQR, interquartile range.
Fig. 3 |
Fig. 3 |. Mechanistic association studies for CM-DILI vulnerability.
a, Method to find CM-DILI PRSgw-associated pathways. We performed GSEA analysis of CM-DILI PRSgw-associated genes, regressing out five first transcriptome principal components (PCs) to capture experimental variability. b, Pathway enrichment analysis results for PHH cells and liver tissues. c, Heat map analysis of gene sets involved in UPR (76 genes) and TCA cycle and respiratory electron transport (116 genes) (Reactome pathway database) in multi-donor iPSC-HLO models. d, Immunostaining of HNF4a and CHOP under the indicated CsA treatment. Representative pictures from two biological replicates. e, XBP1s and KDEL levels under the indicated CsA treatment via immunoblot analysis. GAPDH was used for loading controls. n = 3 independent experiments. f, Live imaging of oxidative stress induction using CellROX reagent (ROX), CLF accumulation and cell death (stained by PI) under the indicated CsA treatment. Representative pictures from three biological replicates. g, Comparison of GSH/GSSG ratio in the iPSC-HLO model between the PRSgw-high donor (45A) and the -low donor (CW10027) upon CsA treatment. *P = 0.017064, a significant difference between the two groups. n = 3, independent experiments. h, GSH/GSSG ratio change by BM treatment in 1383D2-derived iPSC-HLOs under basal condition. n = 2 independent experiments. i, Cell viability upon BM treatment between PRSgw-high and -low donor-derived iPSC-HLOs under CsA 50 μM treatment. A significant difference between the two groups with no treatment was shown (P = 0.0051), whereas a significant diifference was not shown with BM pretreatment (P = 0.1048) or with BM pre-/co-treatment (P = 0.0640). n = 3 independent experiments. All data are shown as mean ± s.d. *P < 0.05 (two-tailed Welch’s t-test). NS. not significant.
Fig. 4 |
Fig. 4 |. PrS associated transcriptomic signatures associate with known CM-DILI responses.
a, A schematic representation of the protocol for identifying compounds associated with PRSgw-related transcriptomic pathways (see Results and Methods). b, Heat map analysis of gene sets involved in TCA cycle and respiratory electron transport in eight PHH donors ordered by PRSgw. This pathway was one of the significantly inactivated pathways in higher CM-PRSgw donors (Supplementary Table 9). The core enriched genes in GSEA are shown. c, Network representation of screened gene sets associated with CM-DILI PRSgw (FDR < 0.01). Representative clusters and compounds associated with them are indicated. All of the raw results are shown in Supplementary Tables 9 and 10. d, Gene expression analysis for representative ER stress marker genes in the eight PHH donors under CsA treatment or control conditions (see Methods). **P < 0.01 (two-sided Pearson correlation test; P = 4.7 × 10−3). e, PRSgw informed CM-DILI vulnerable mechanisms, genetic factors and their relationships. Green text, validated events by phenotypic assays; red box, PRS informed mechanisms for CM-DILI.

References

    1. Chalasani N et al.Features and outcomes of 899 patients with drug-induced liver injury: the DILIN prospective study. Gastroenterology 148, 1340–1352 (2015). - PMC - PubMed
    1. Nicoletti P et al.Association of liver injury from specific drugs, or groups of drugs, with polymorphisms in HLA and other genes in a genome-wide association study. Gastroenterology 152, 1078–1089 (2017). - PMC - PubMed
    1. Khera AV et al.Genome-wide polygenic scores for common diseases identify individuals with risk equivalent to monogenic mutations. Nat. Genet. 50, 1219–1224 (2018). - PMC - PubMed
    1. Bulik-Sullivan B et al.LD score regression distinguishes confounding from polygenicity in genome-wide association studies. Nat. Genet. 47, 291–295 (2015). - PMC - PubMed
    1. Burant CF et al.TAK-875 versus placebo or glimepiride in type 2 diabetes mellitus: a phase 2, randomised, double-blind, placebo-controlled trial. Lancet 379, 1403–1411 (2012). - PubMed

Publication types

MeSH terms