Clinical Trial
. 2020 Nov;26(11):1733-1741.
doi: 10.1038/s41591-020-1044-8. Epub 2020 Sep 7.

Avelumab plus axitinib versus sunitinib in advanced renal cell carcinoma: biomarker analysis of the phase 3 JAVELIN Renal 101 trial

Affiliations
Clinical Trial

Avelumab plus axitinib versus sunitinib in advanced renal cell carcinoma: biomarker analysis of the phase 3 JAVELIN Renal 101 trial

Robert J Motzer et al. Nat Med. 2020 Nov.

Abstract

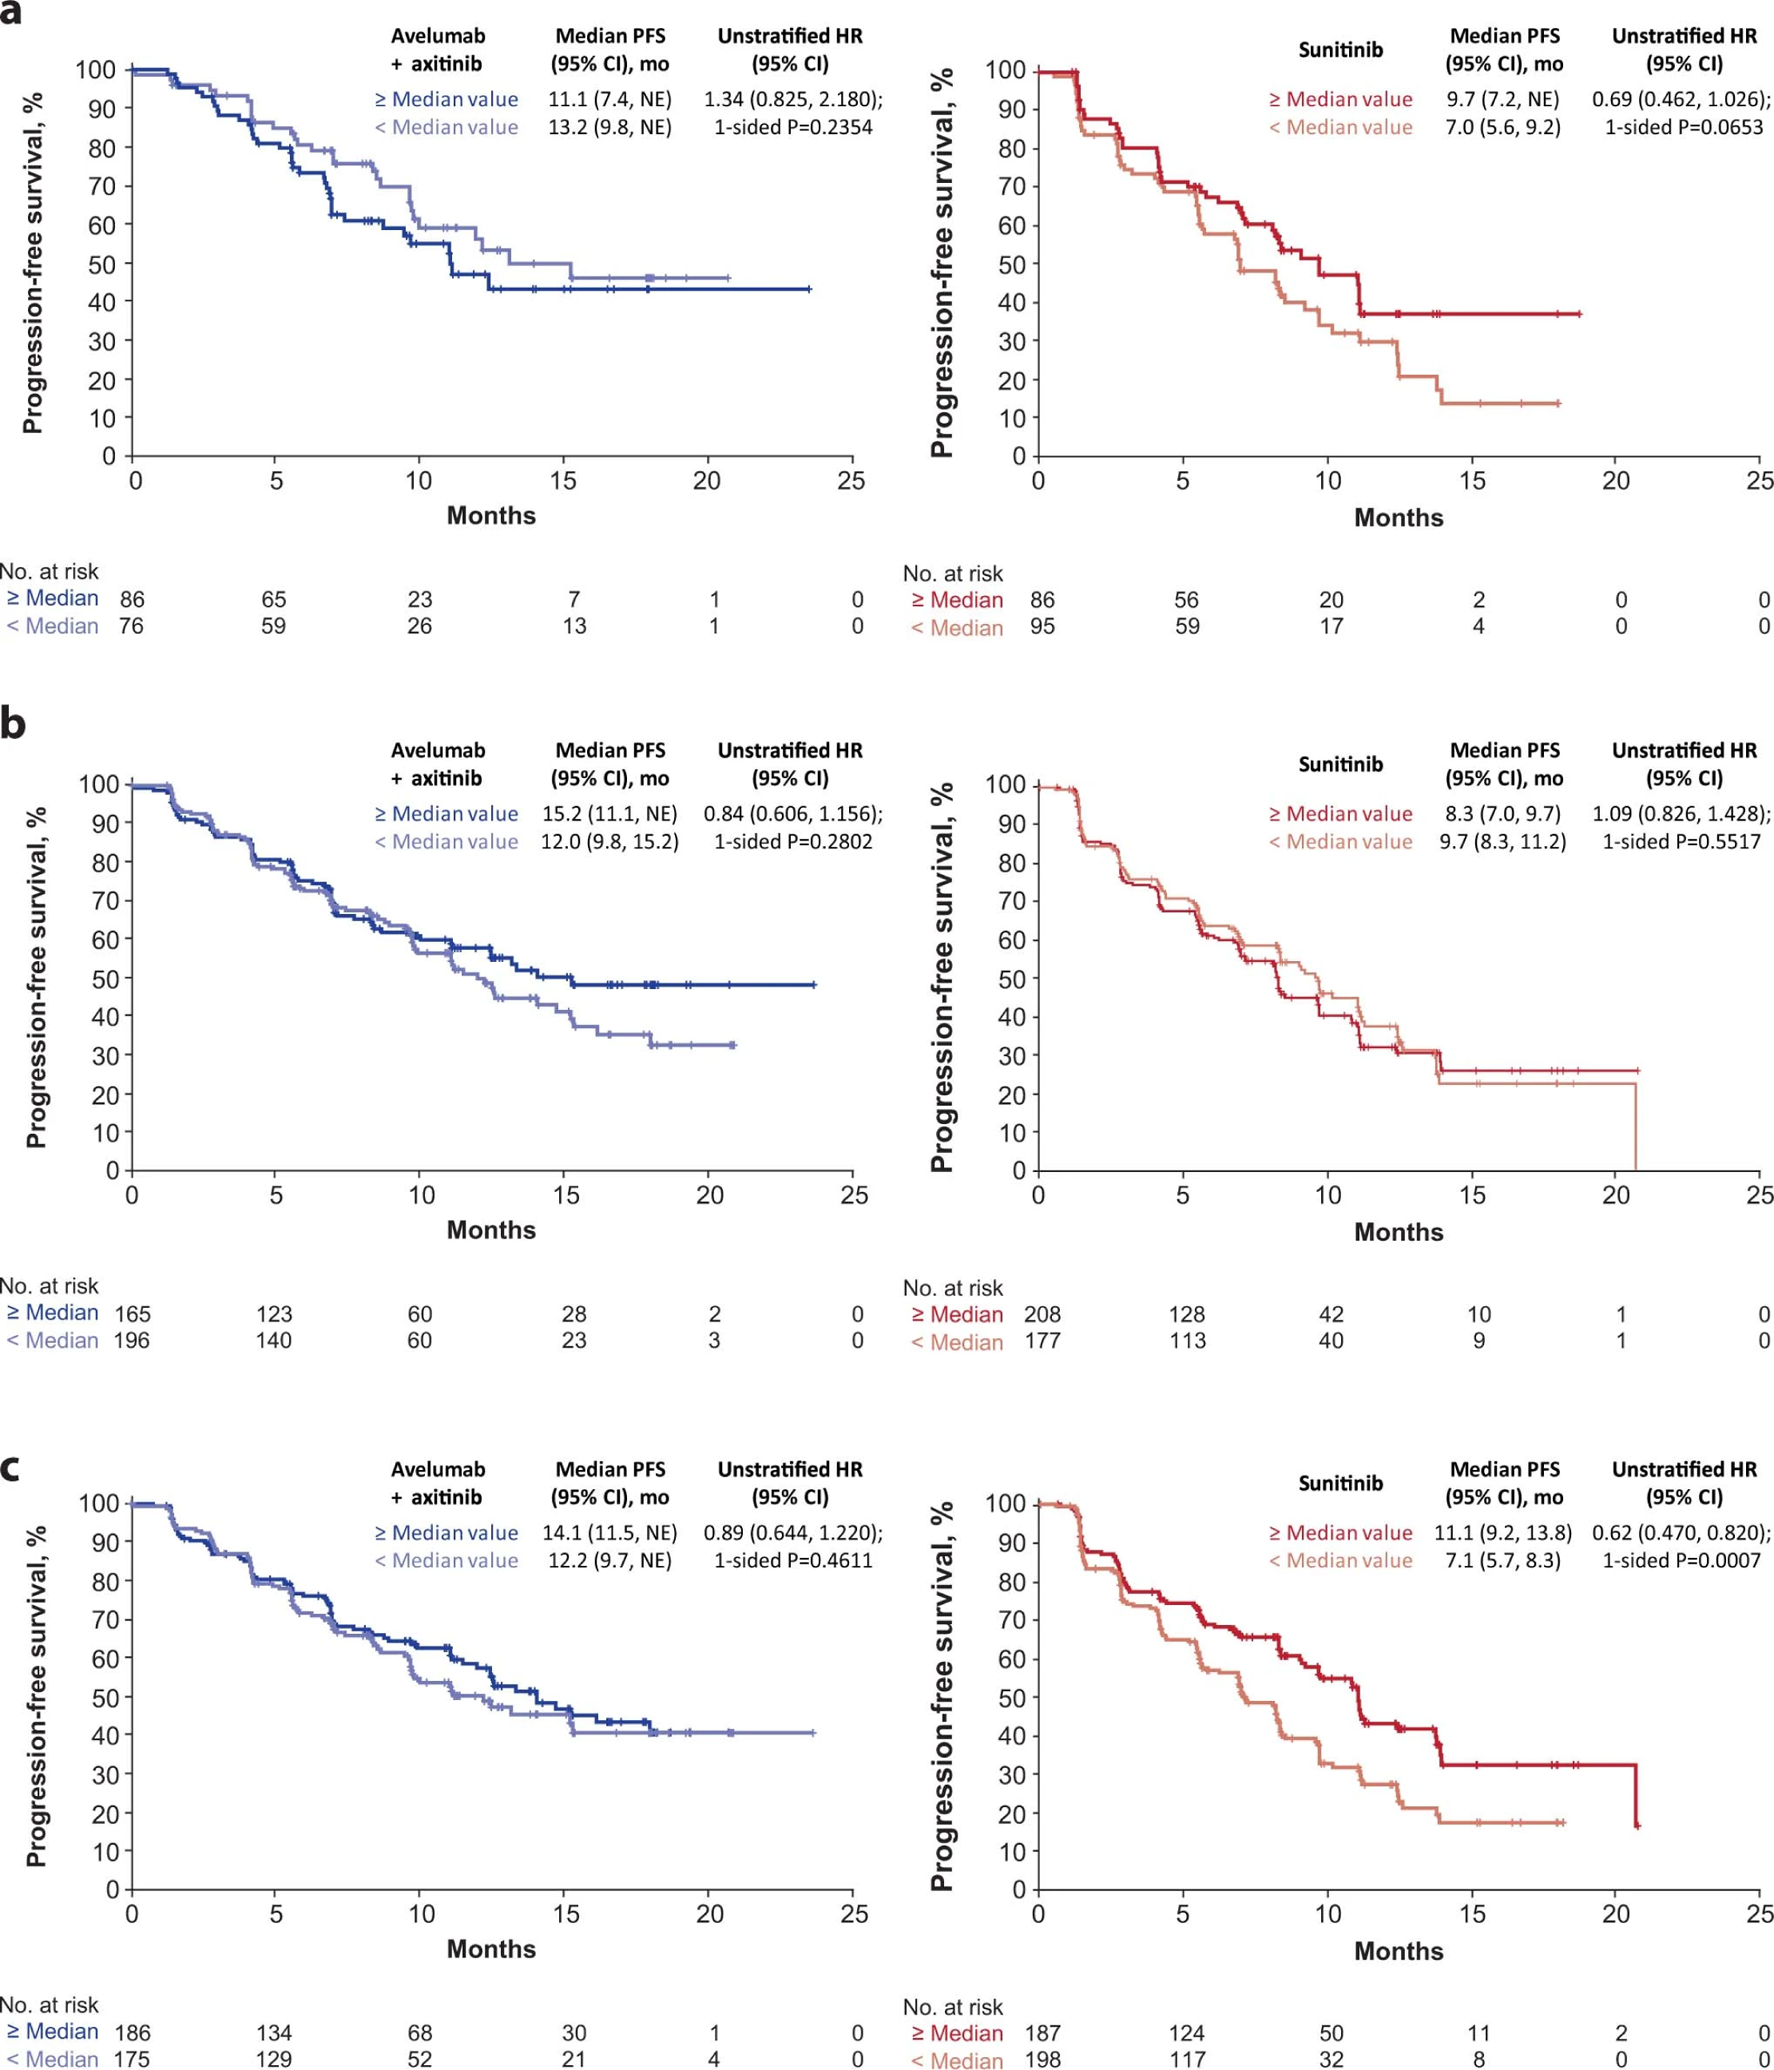
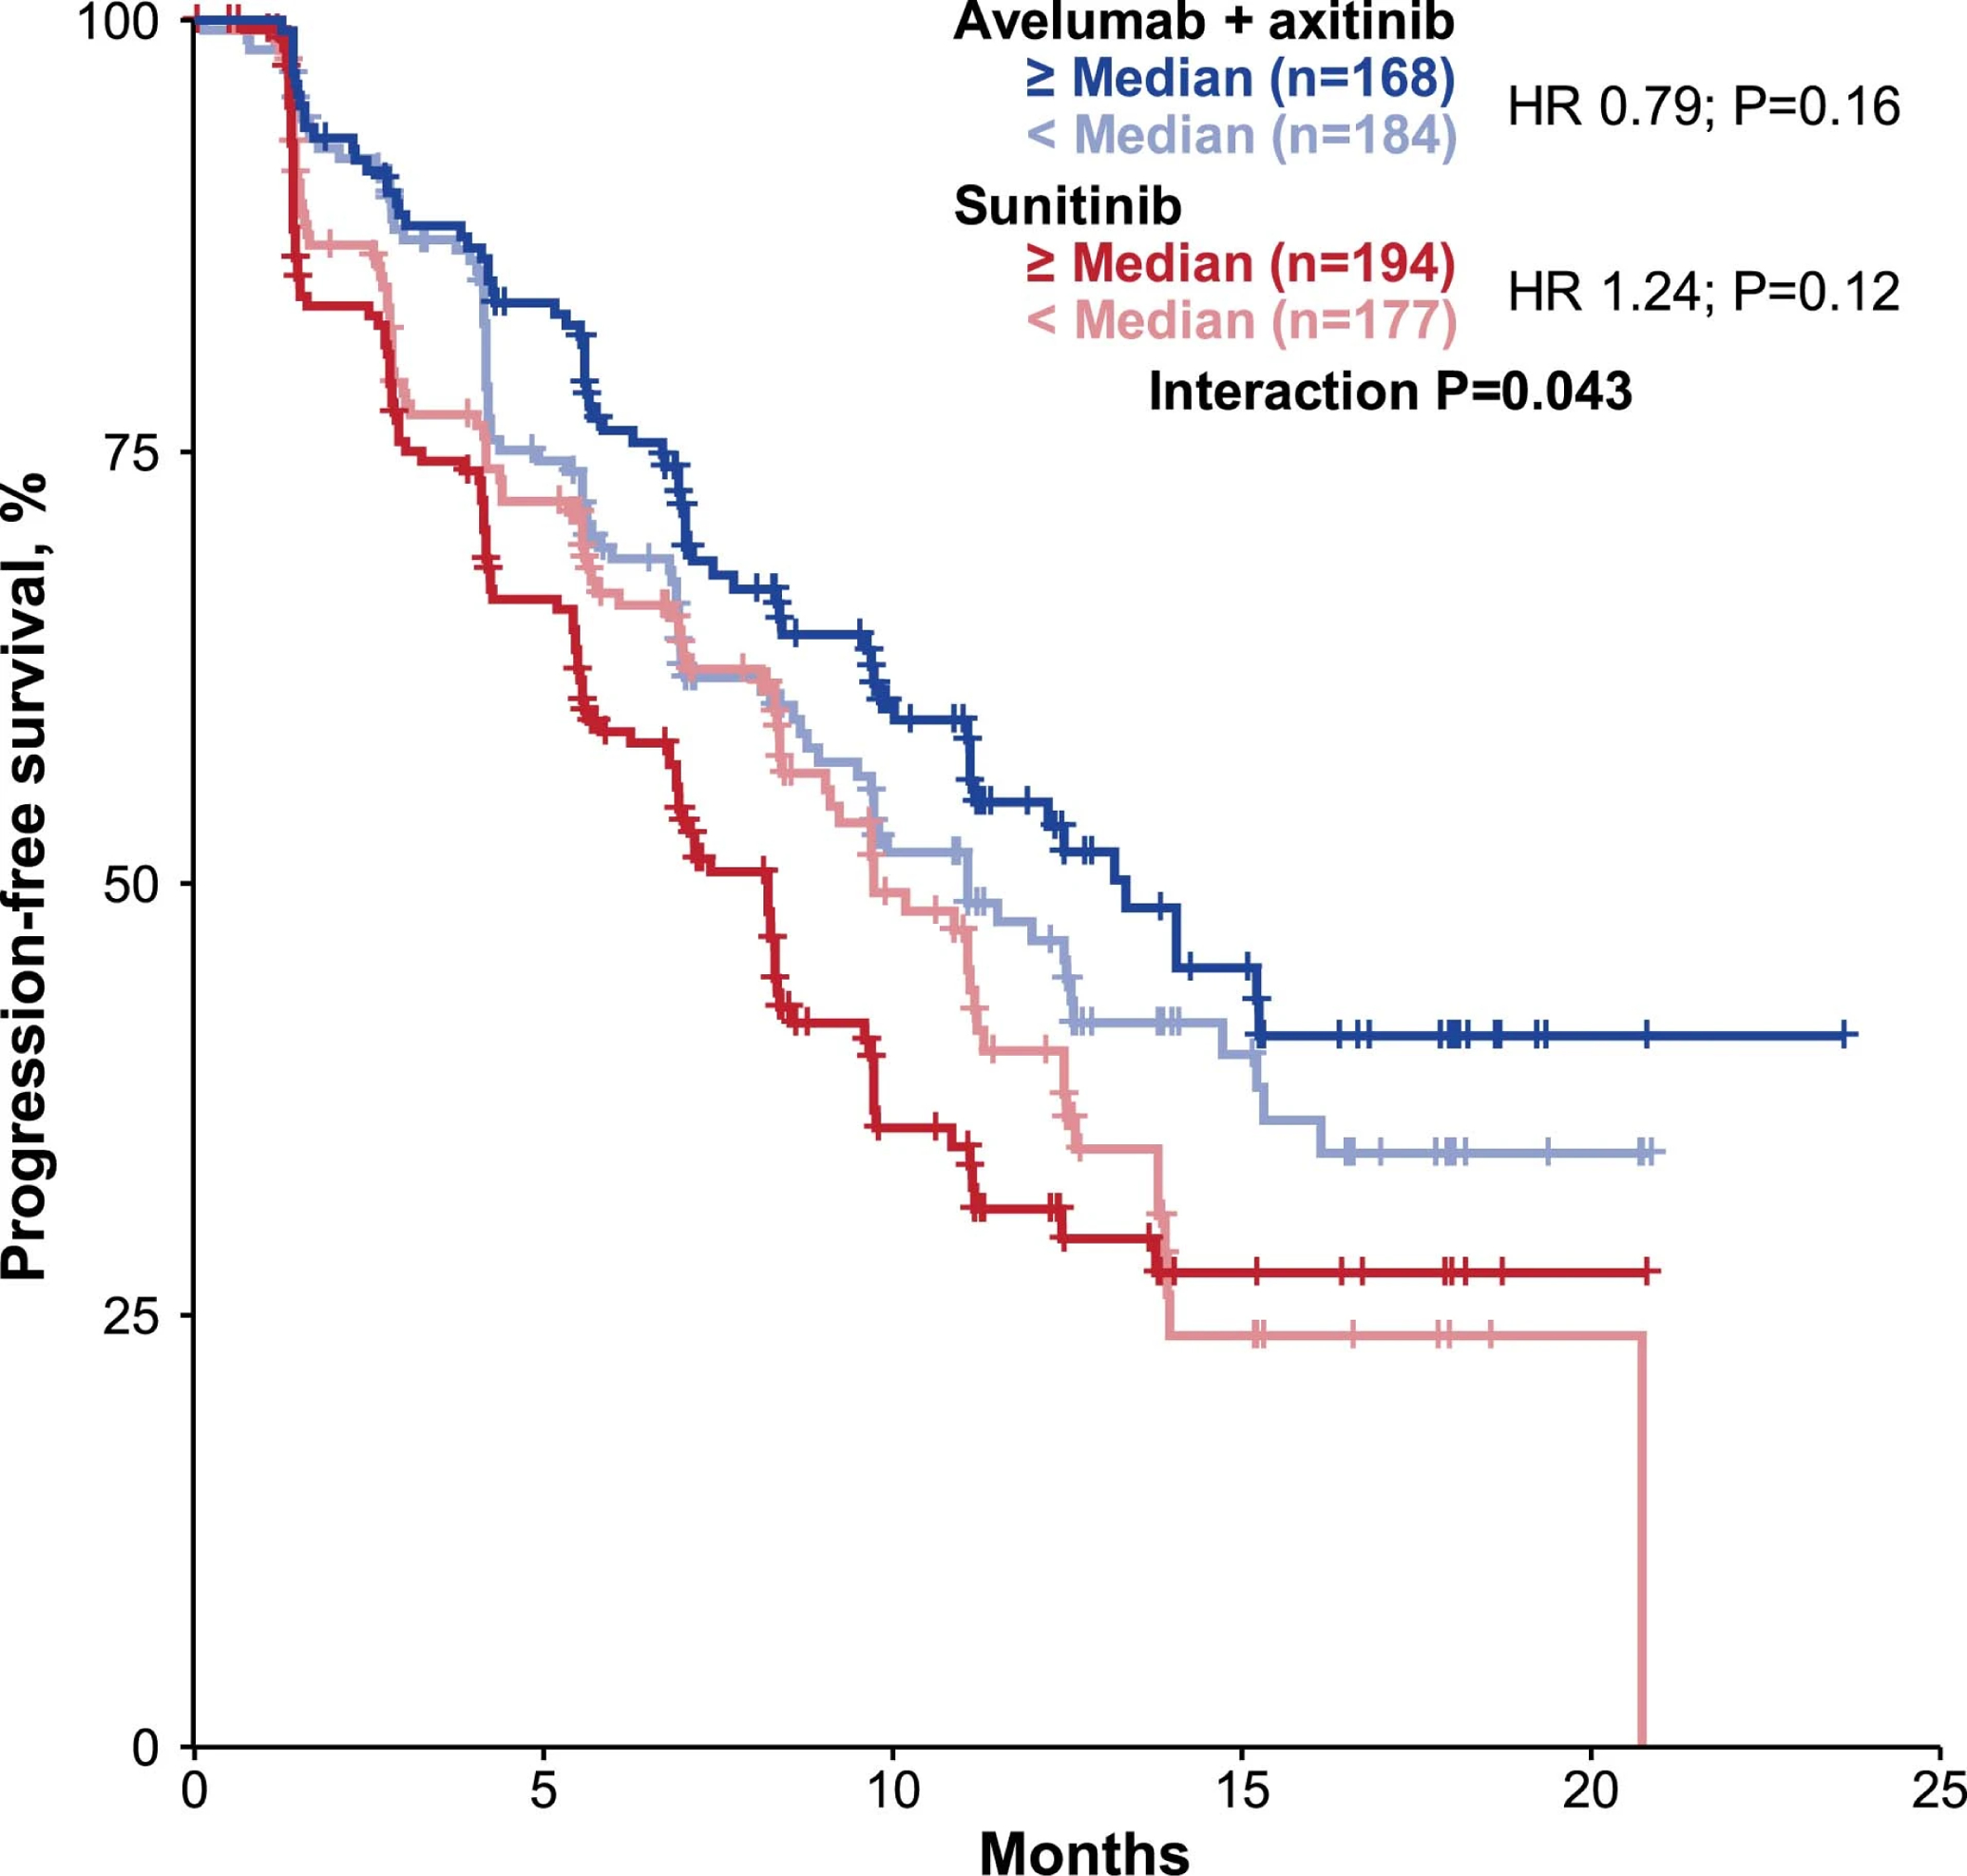
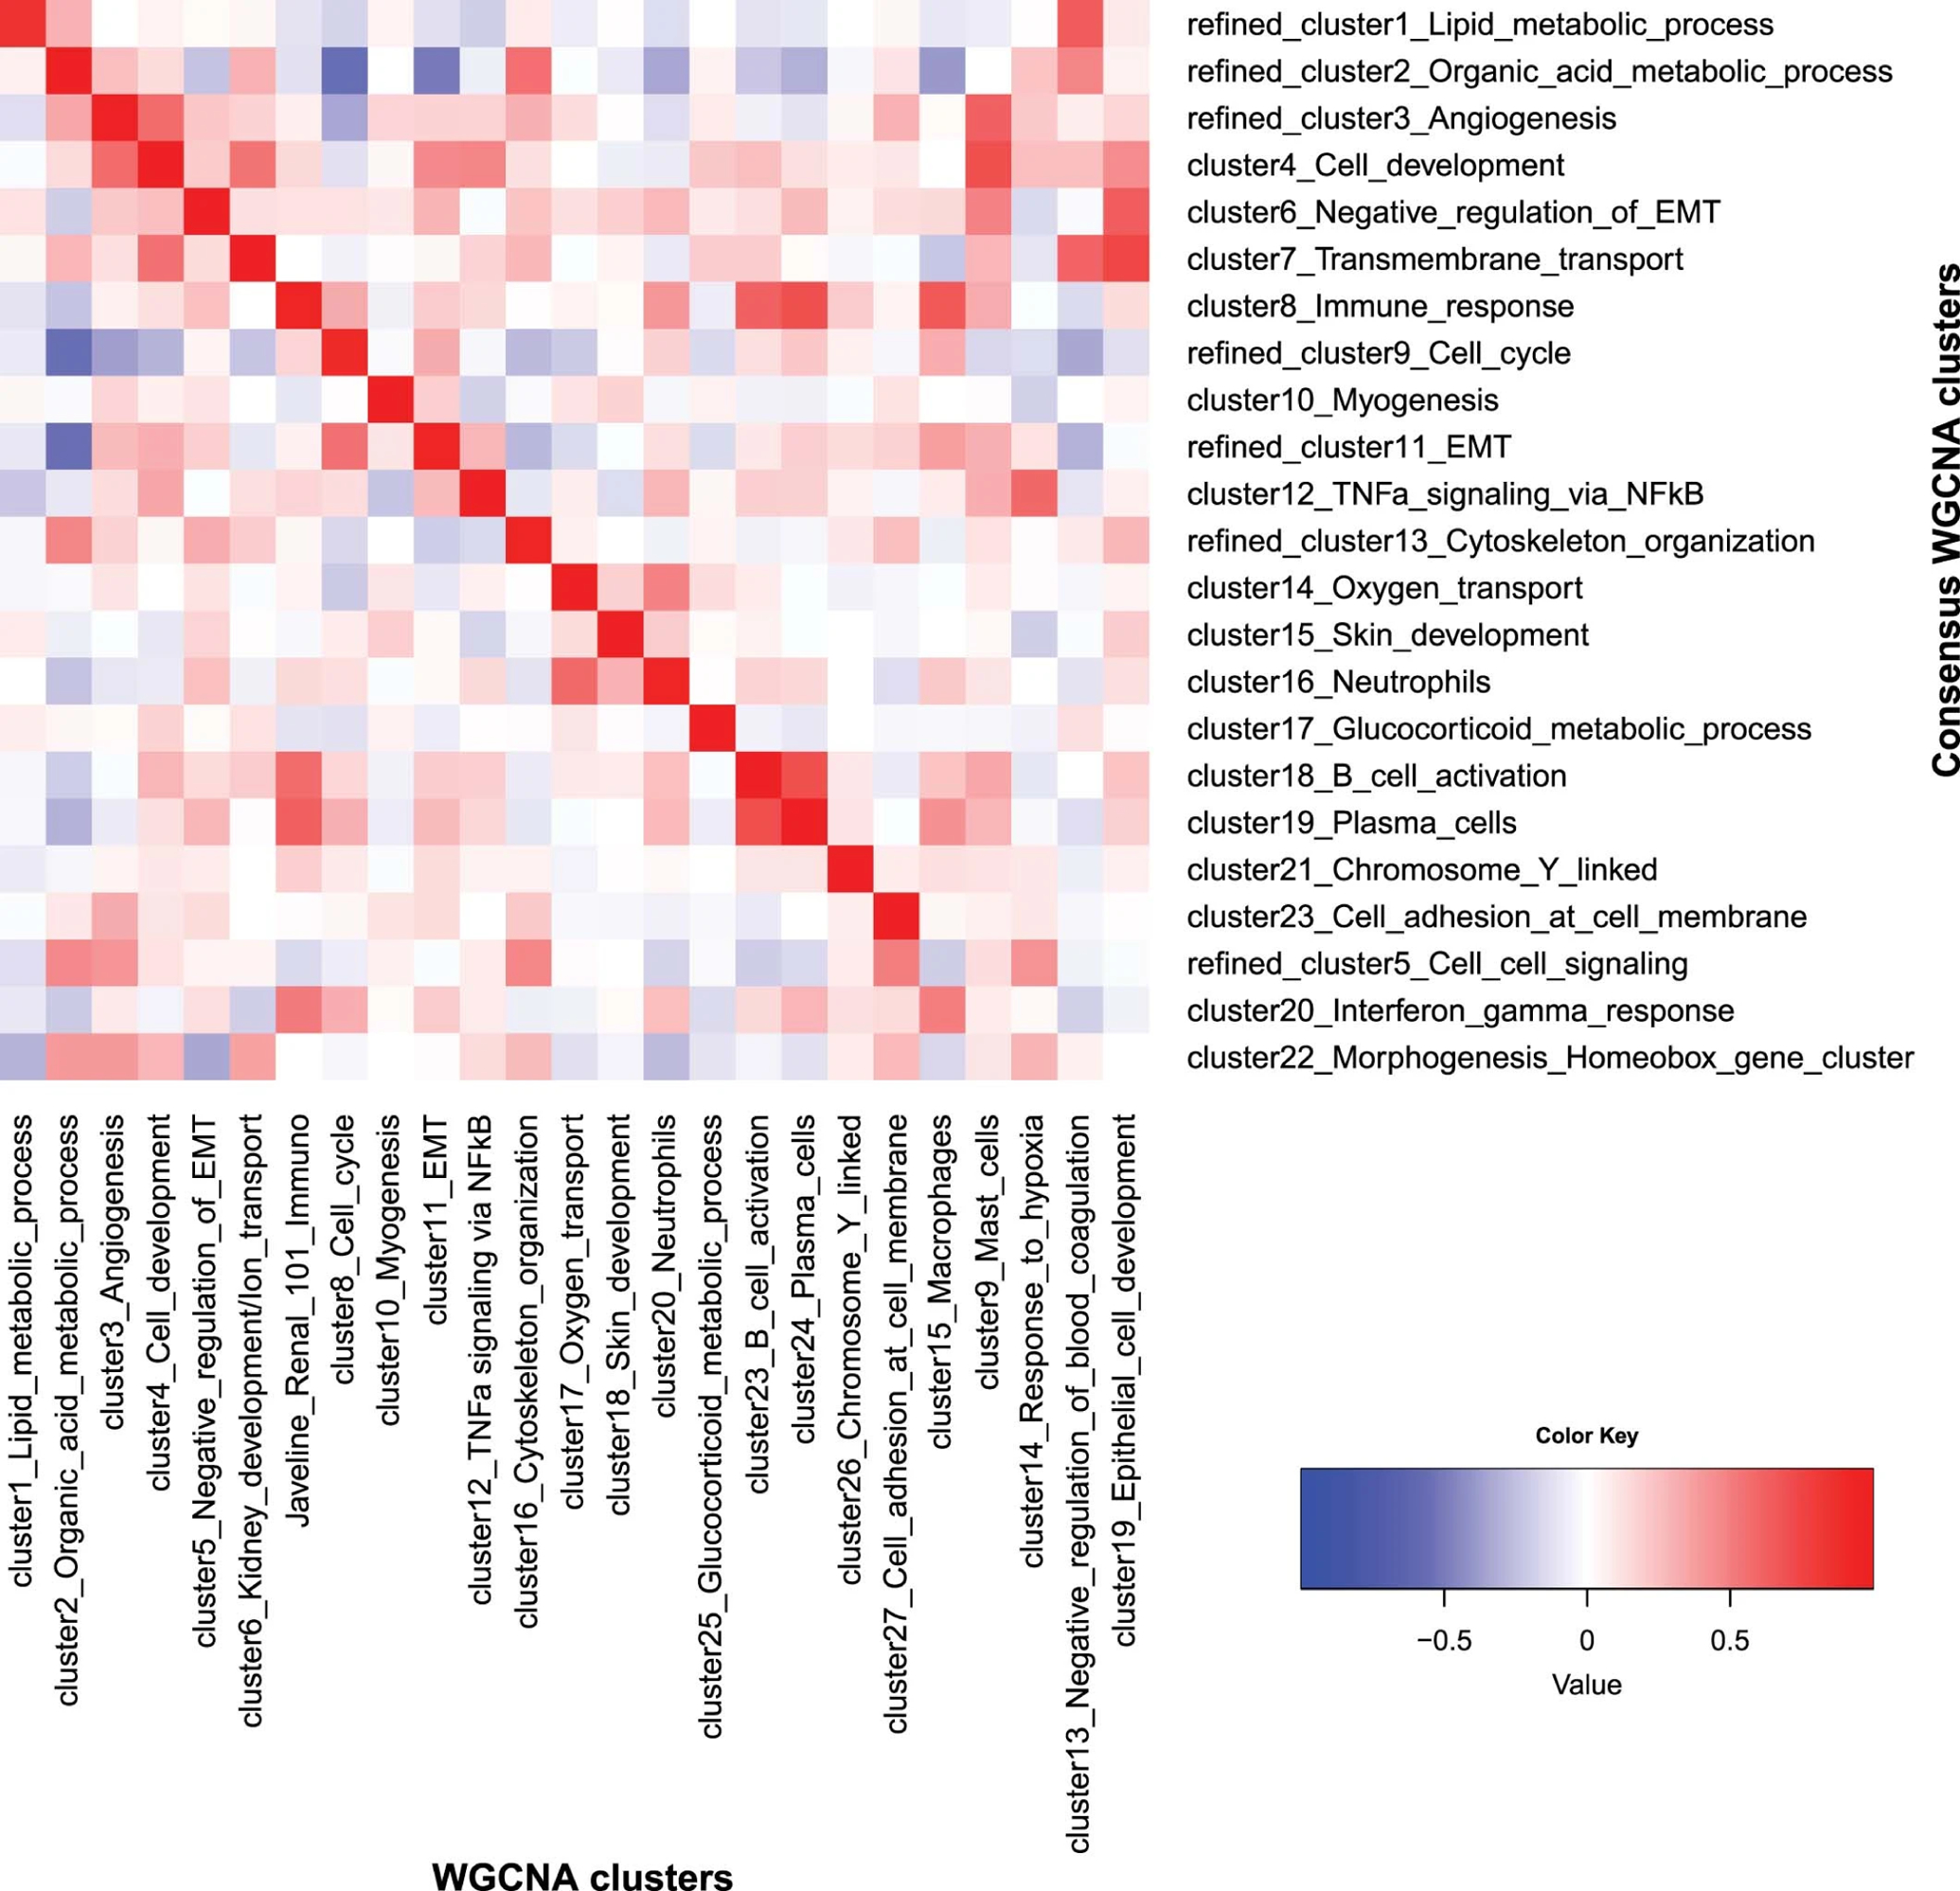
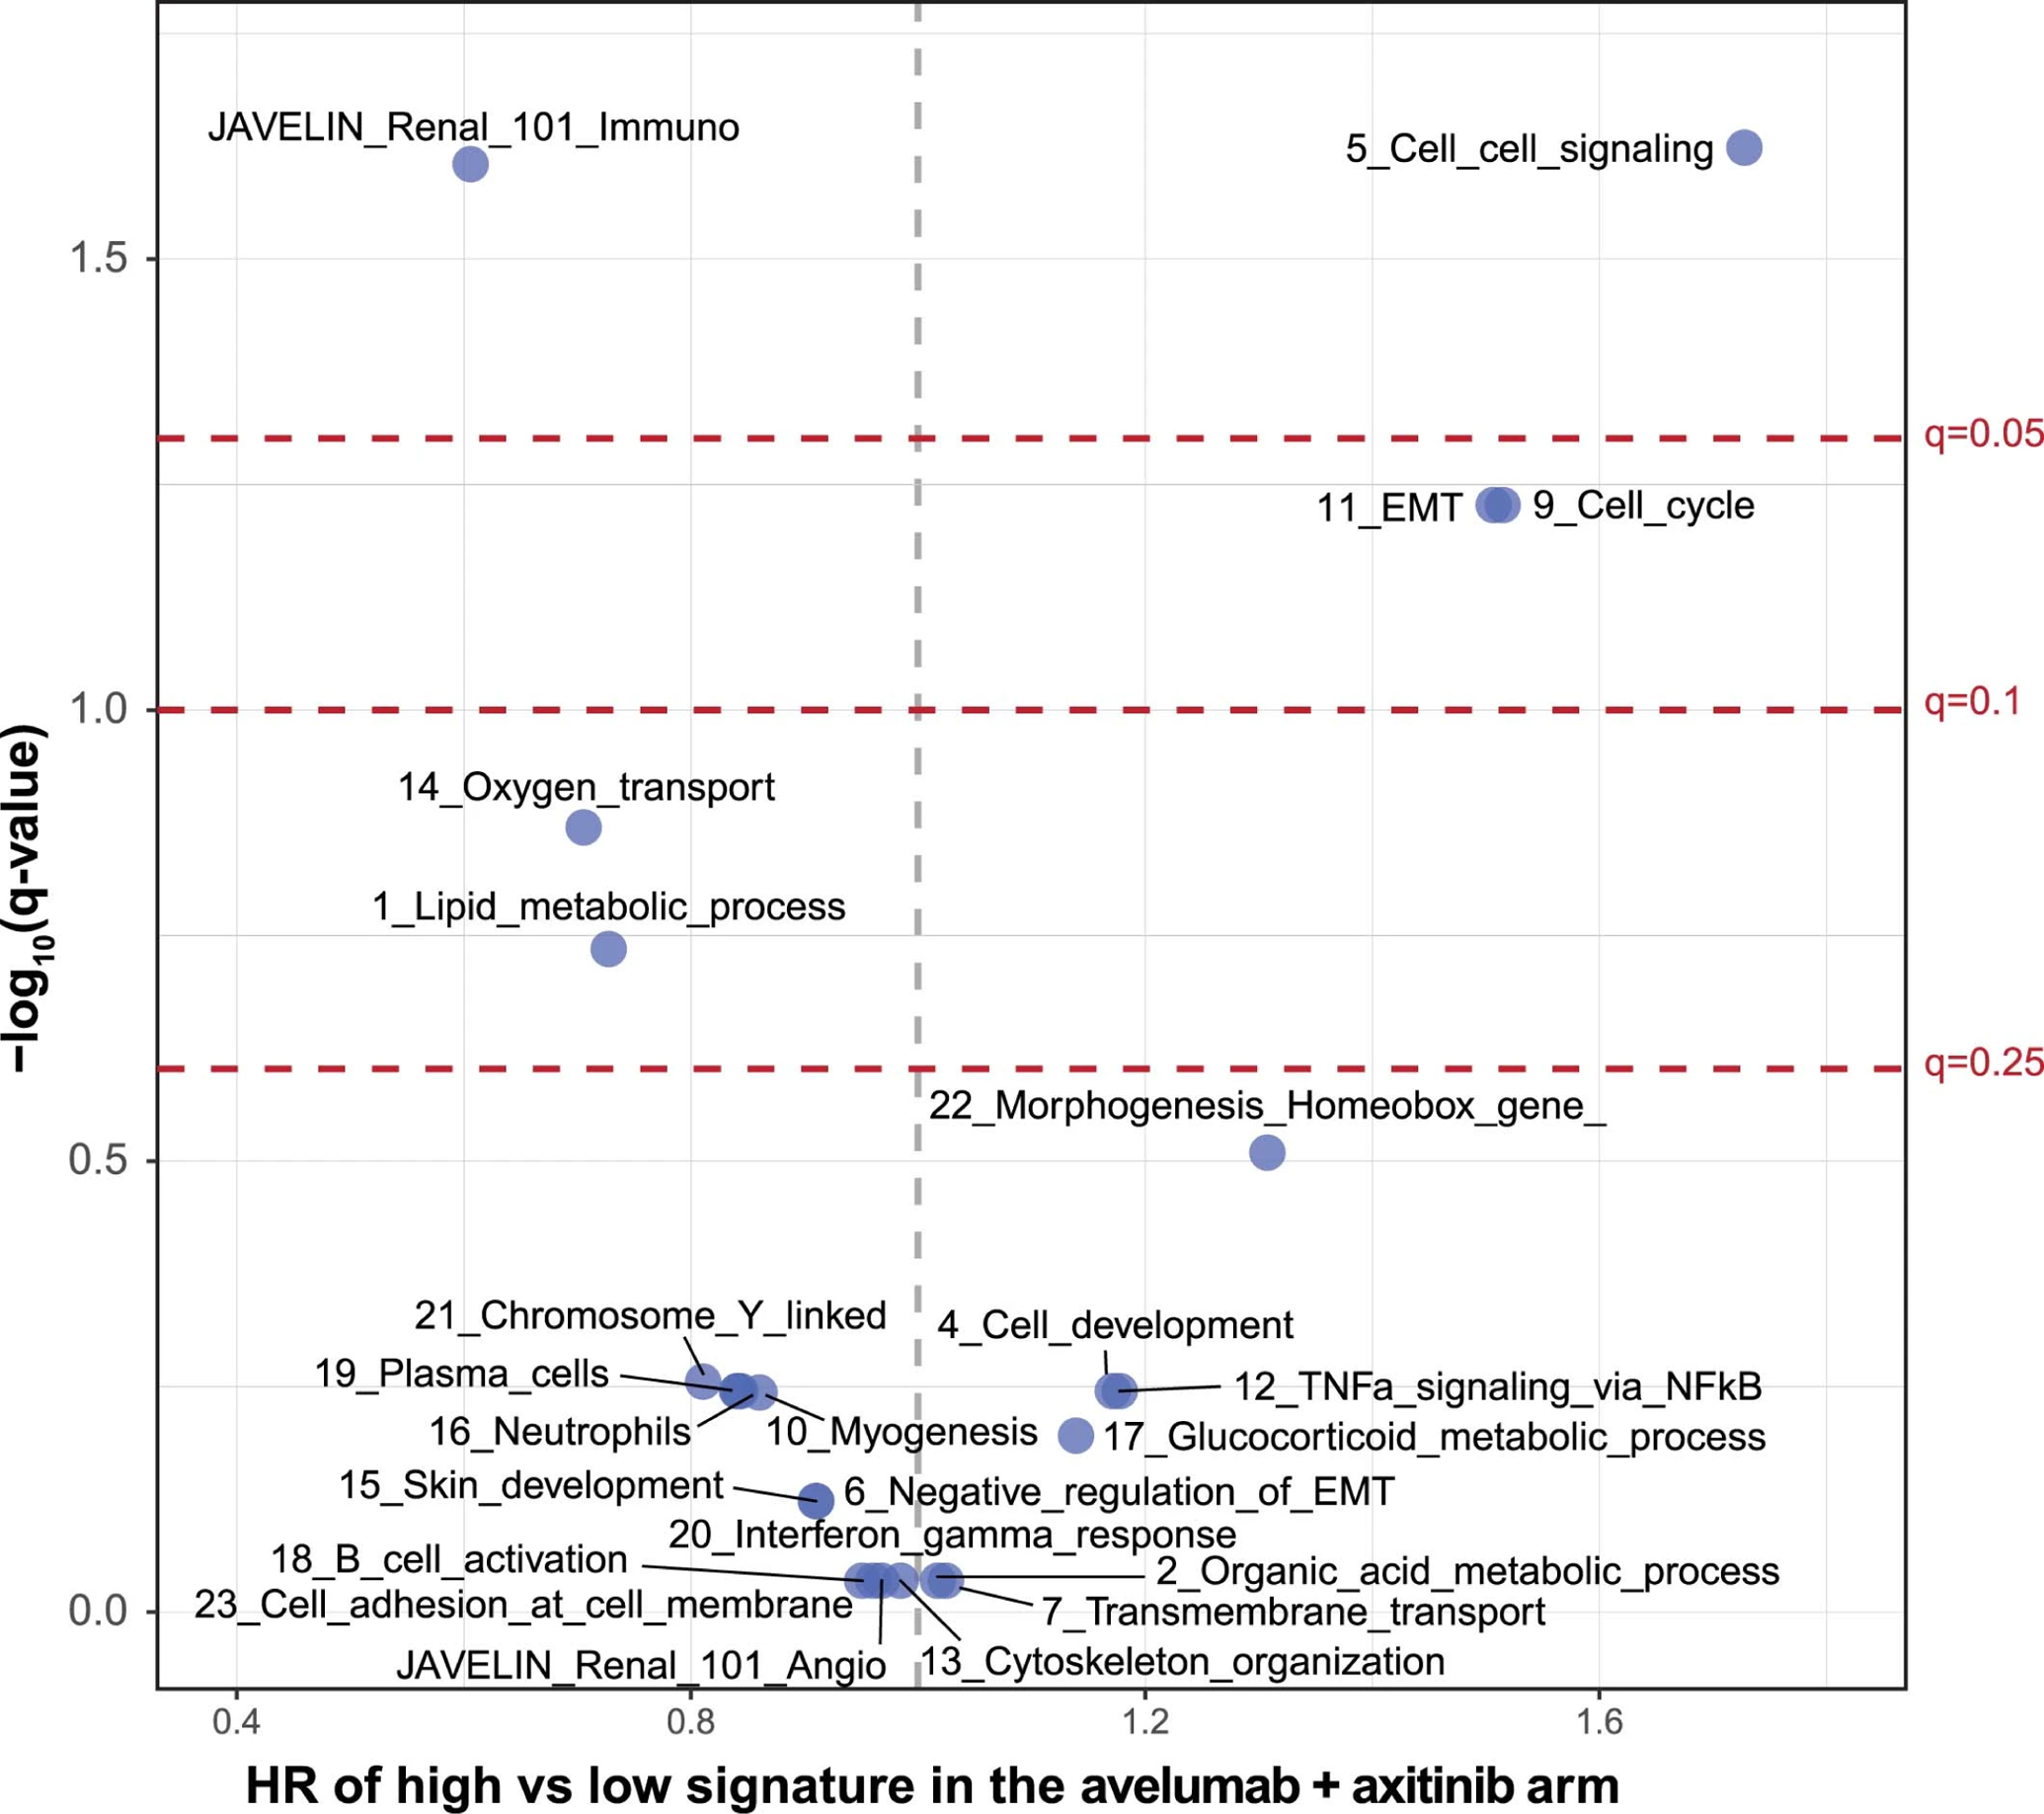
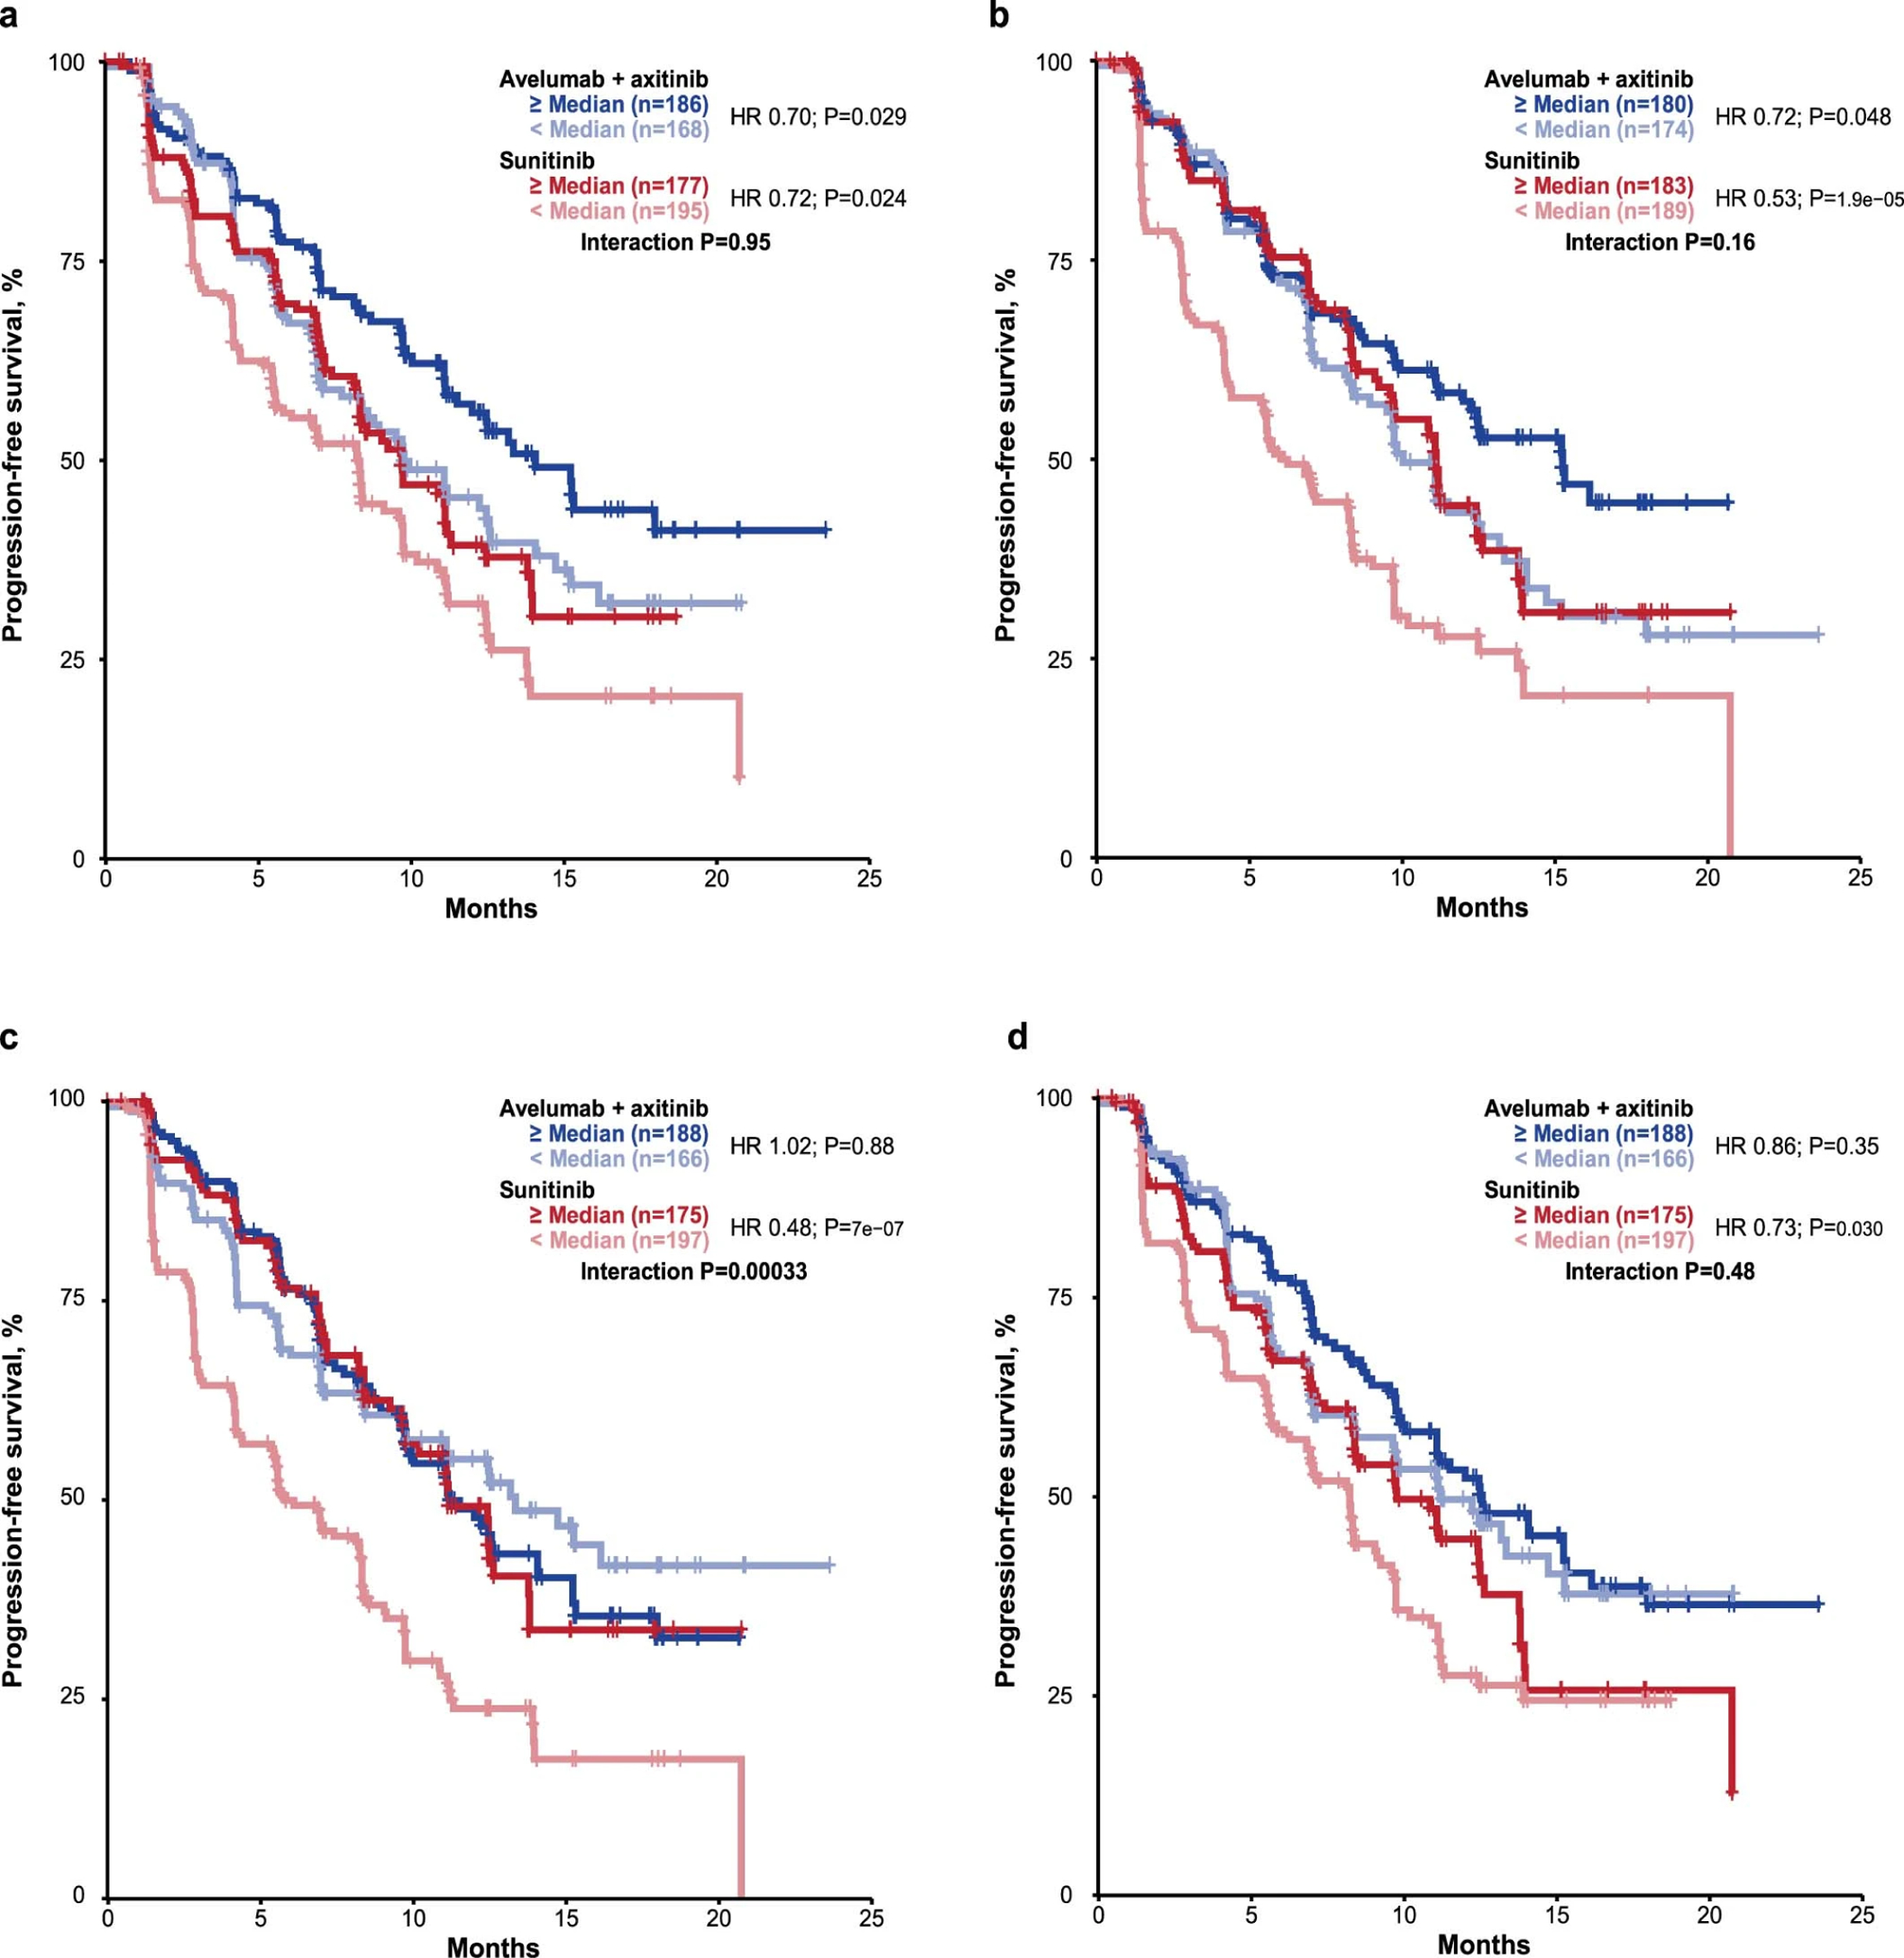
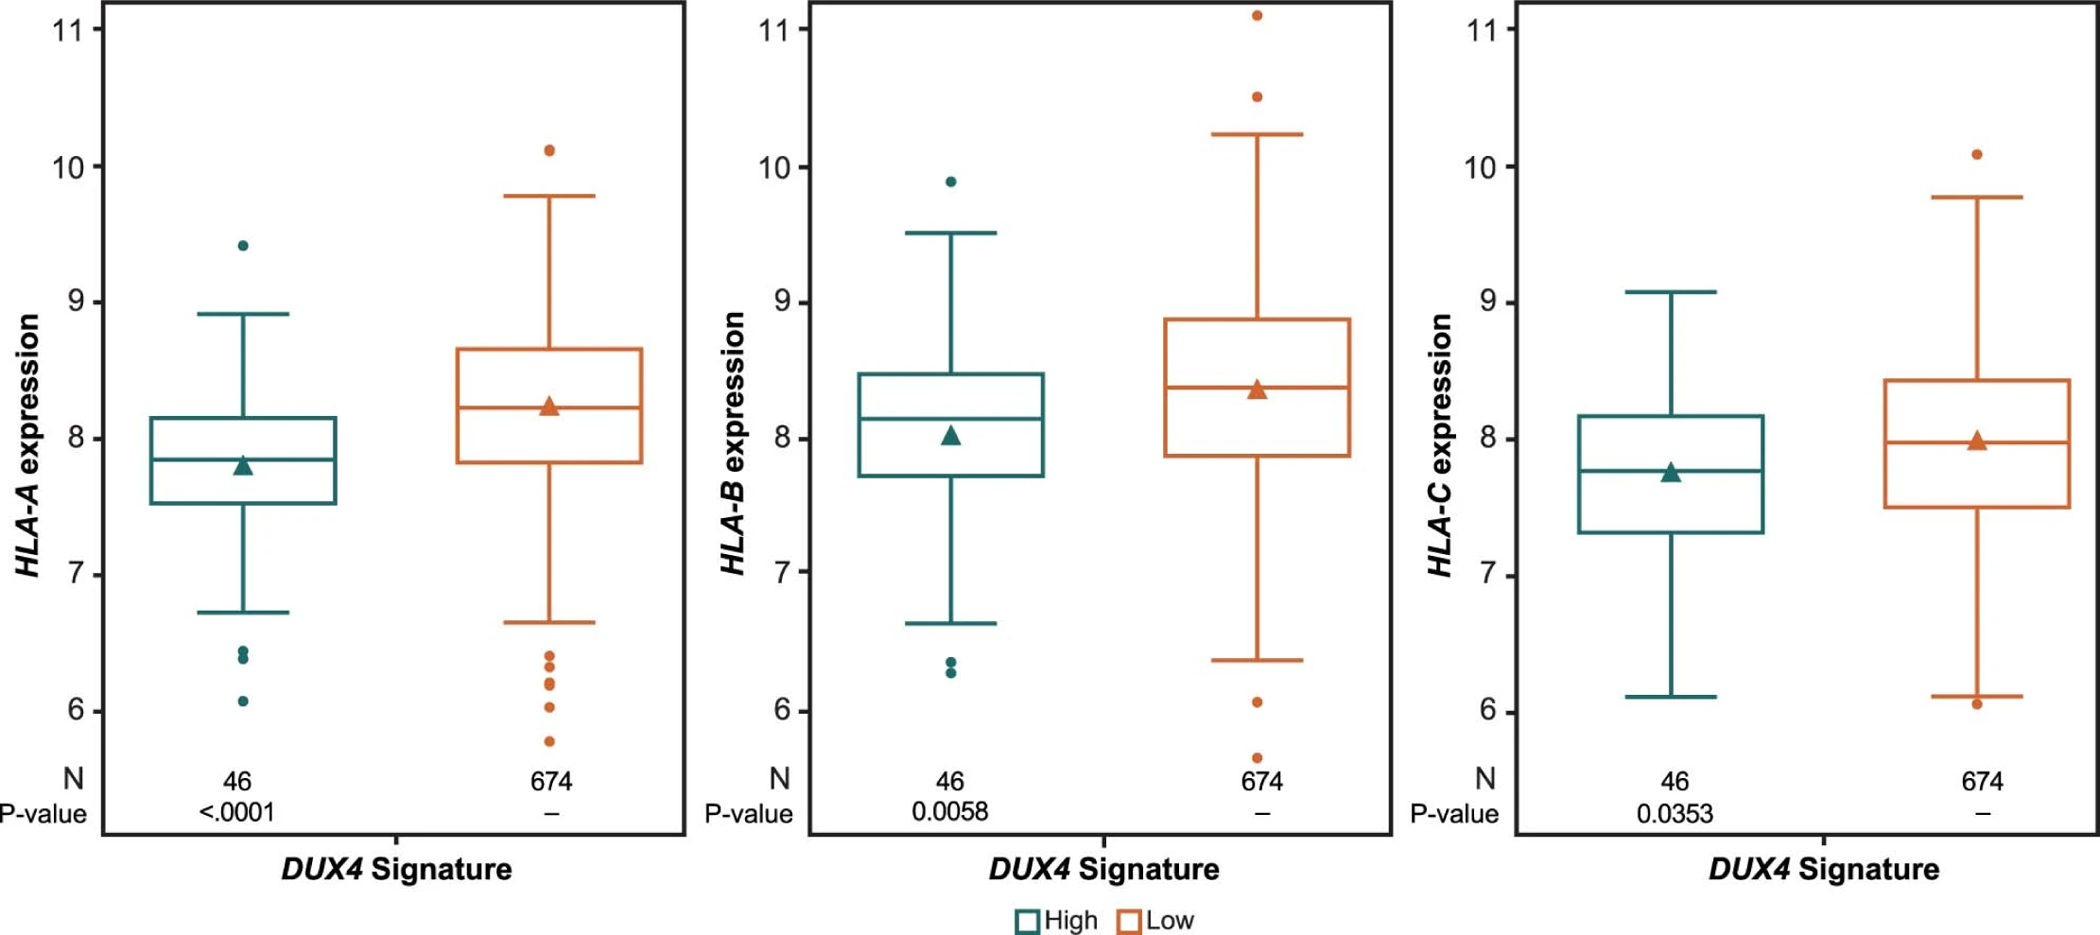
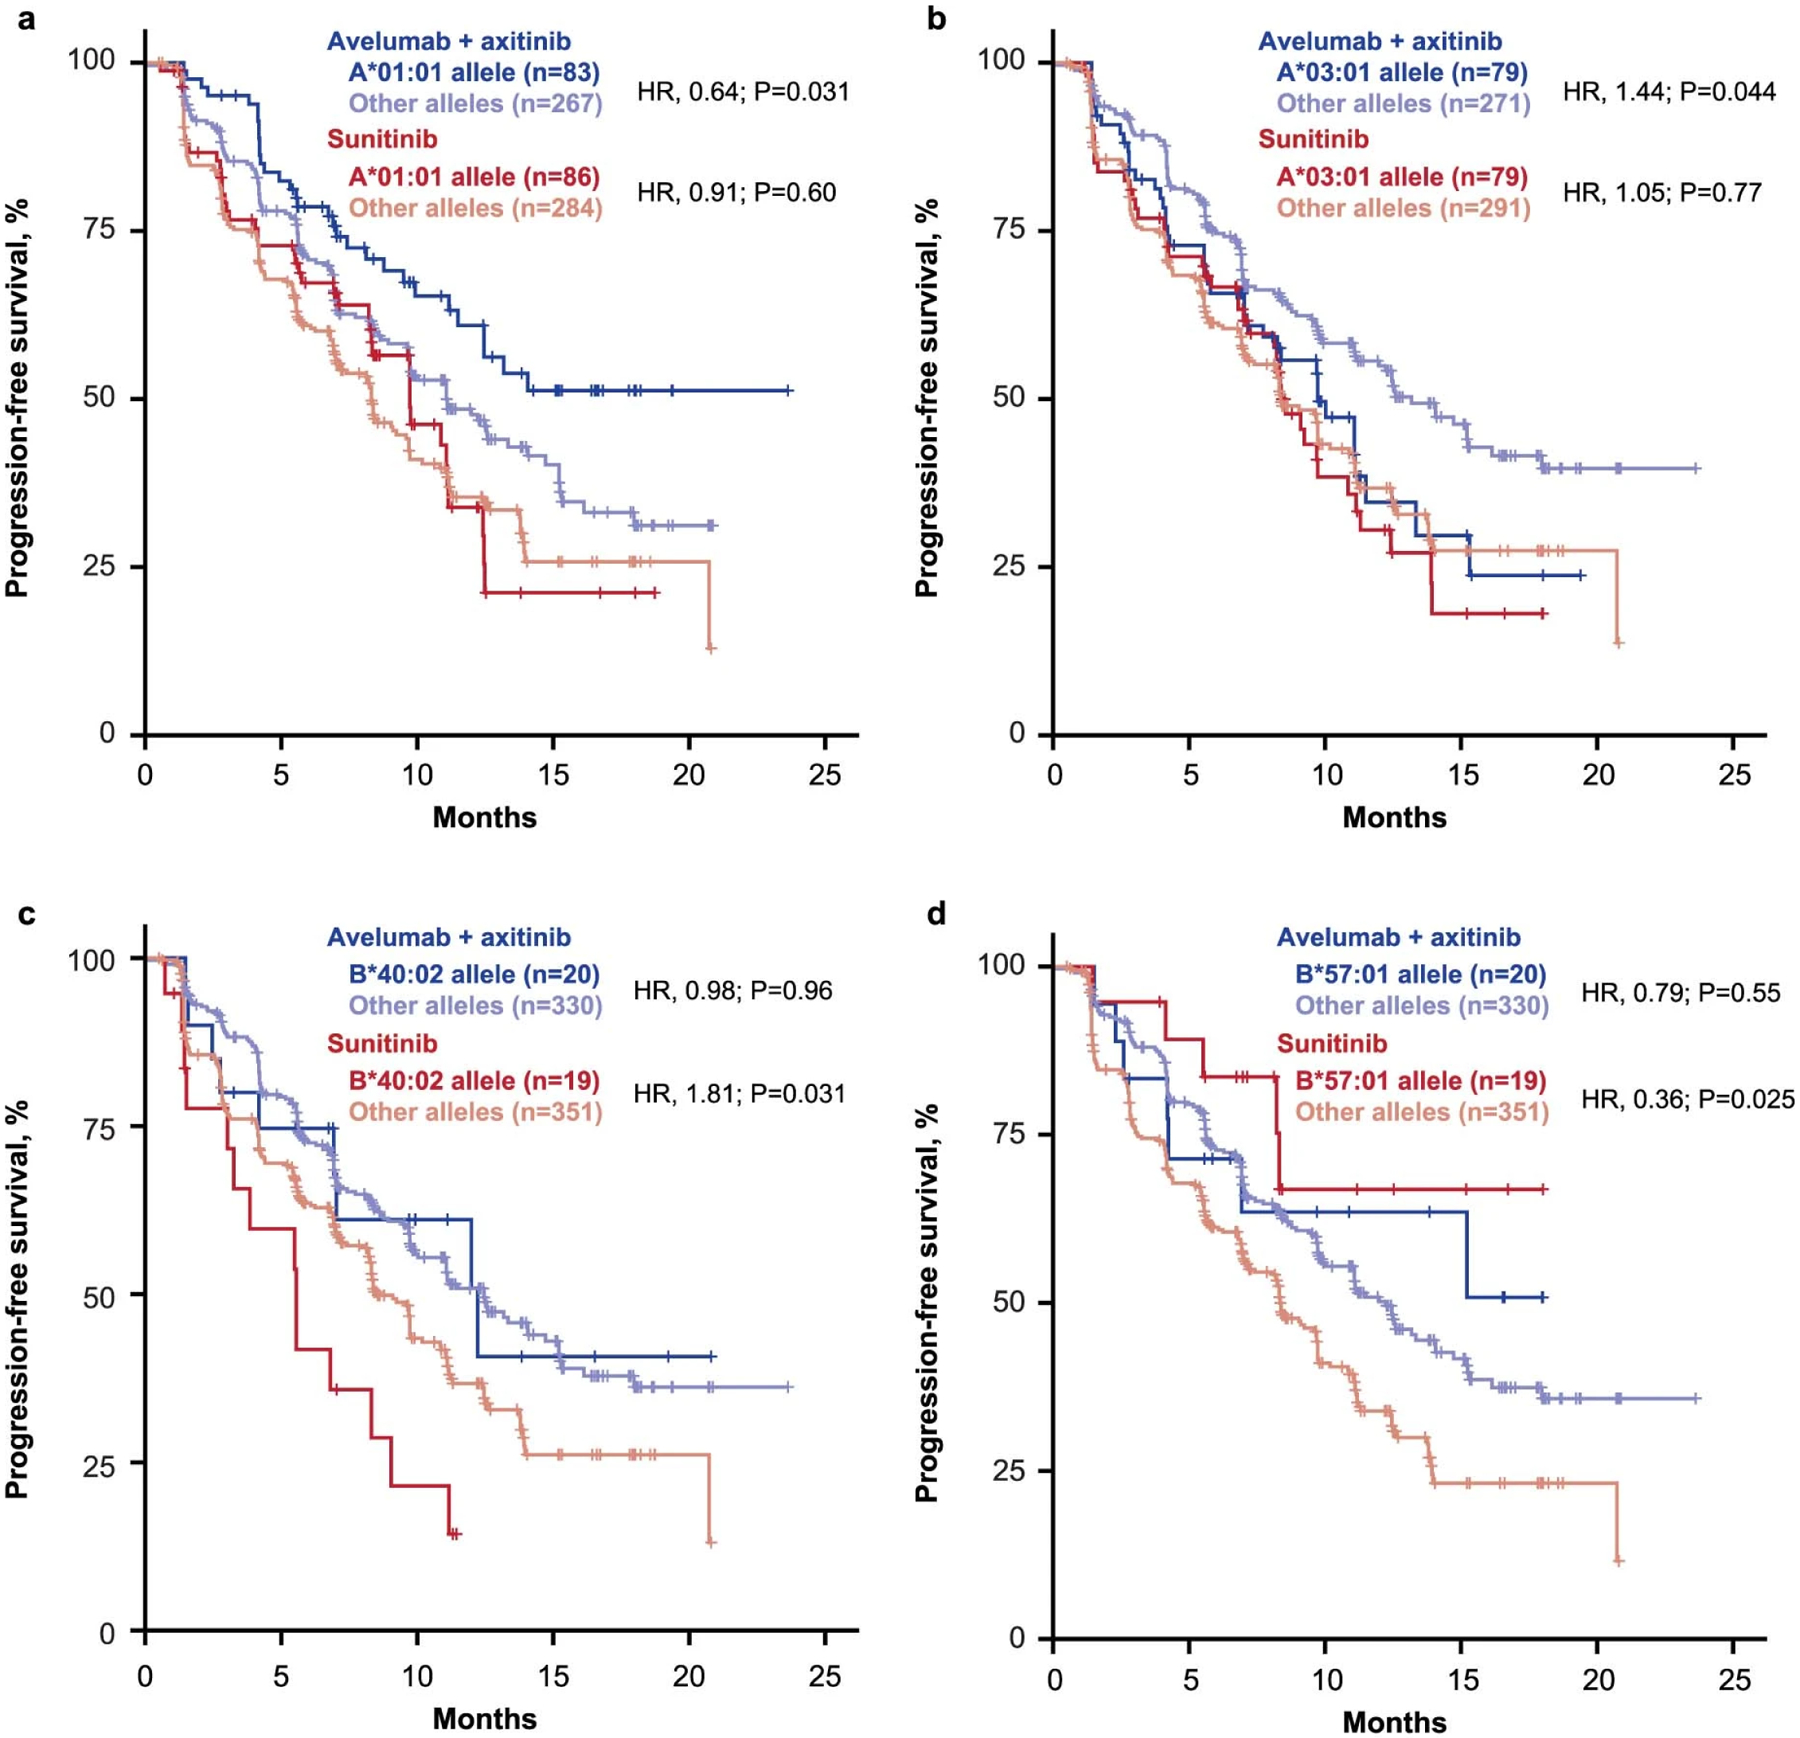
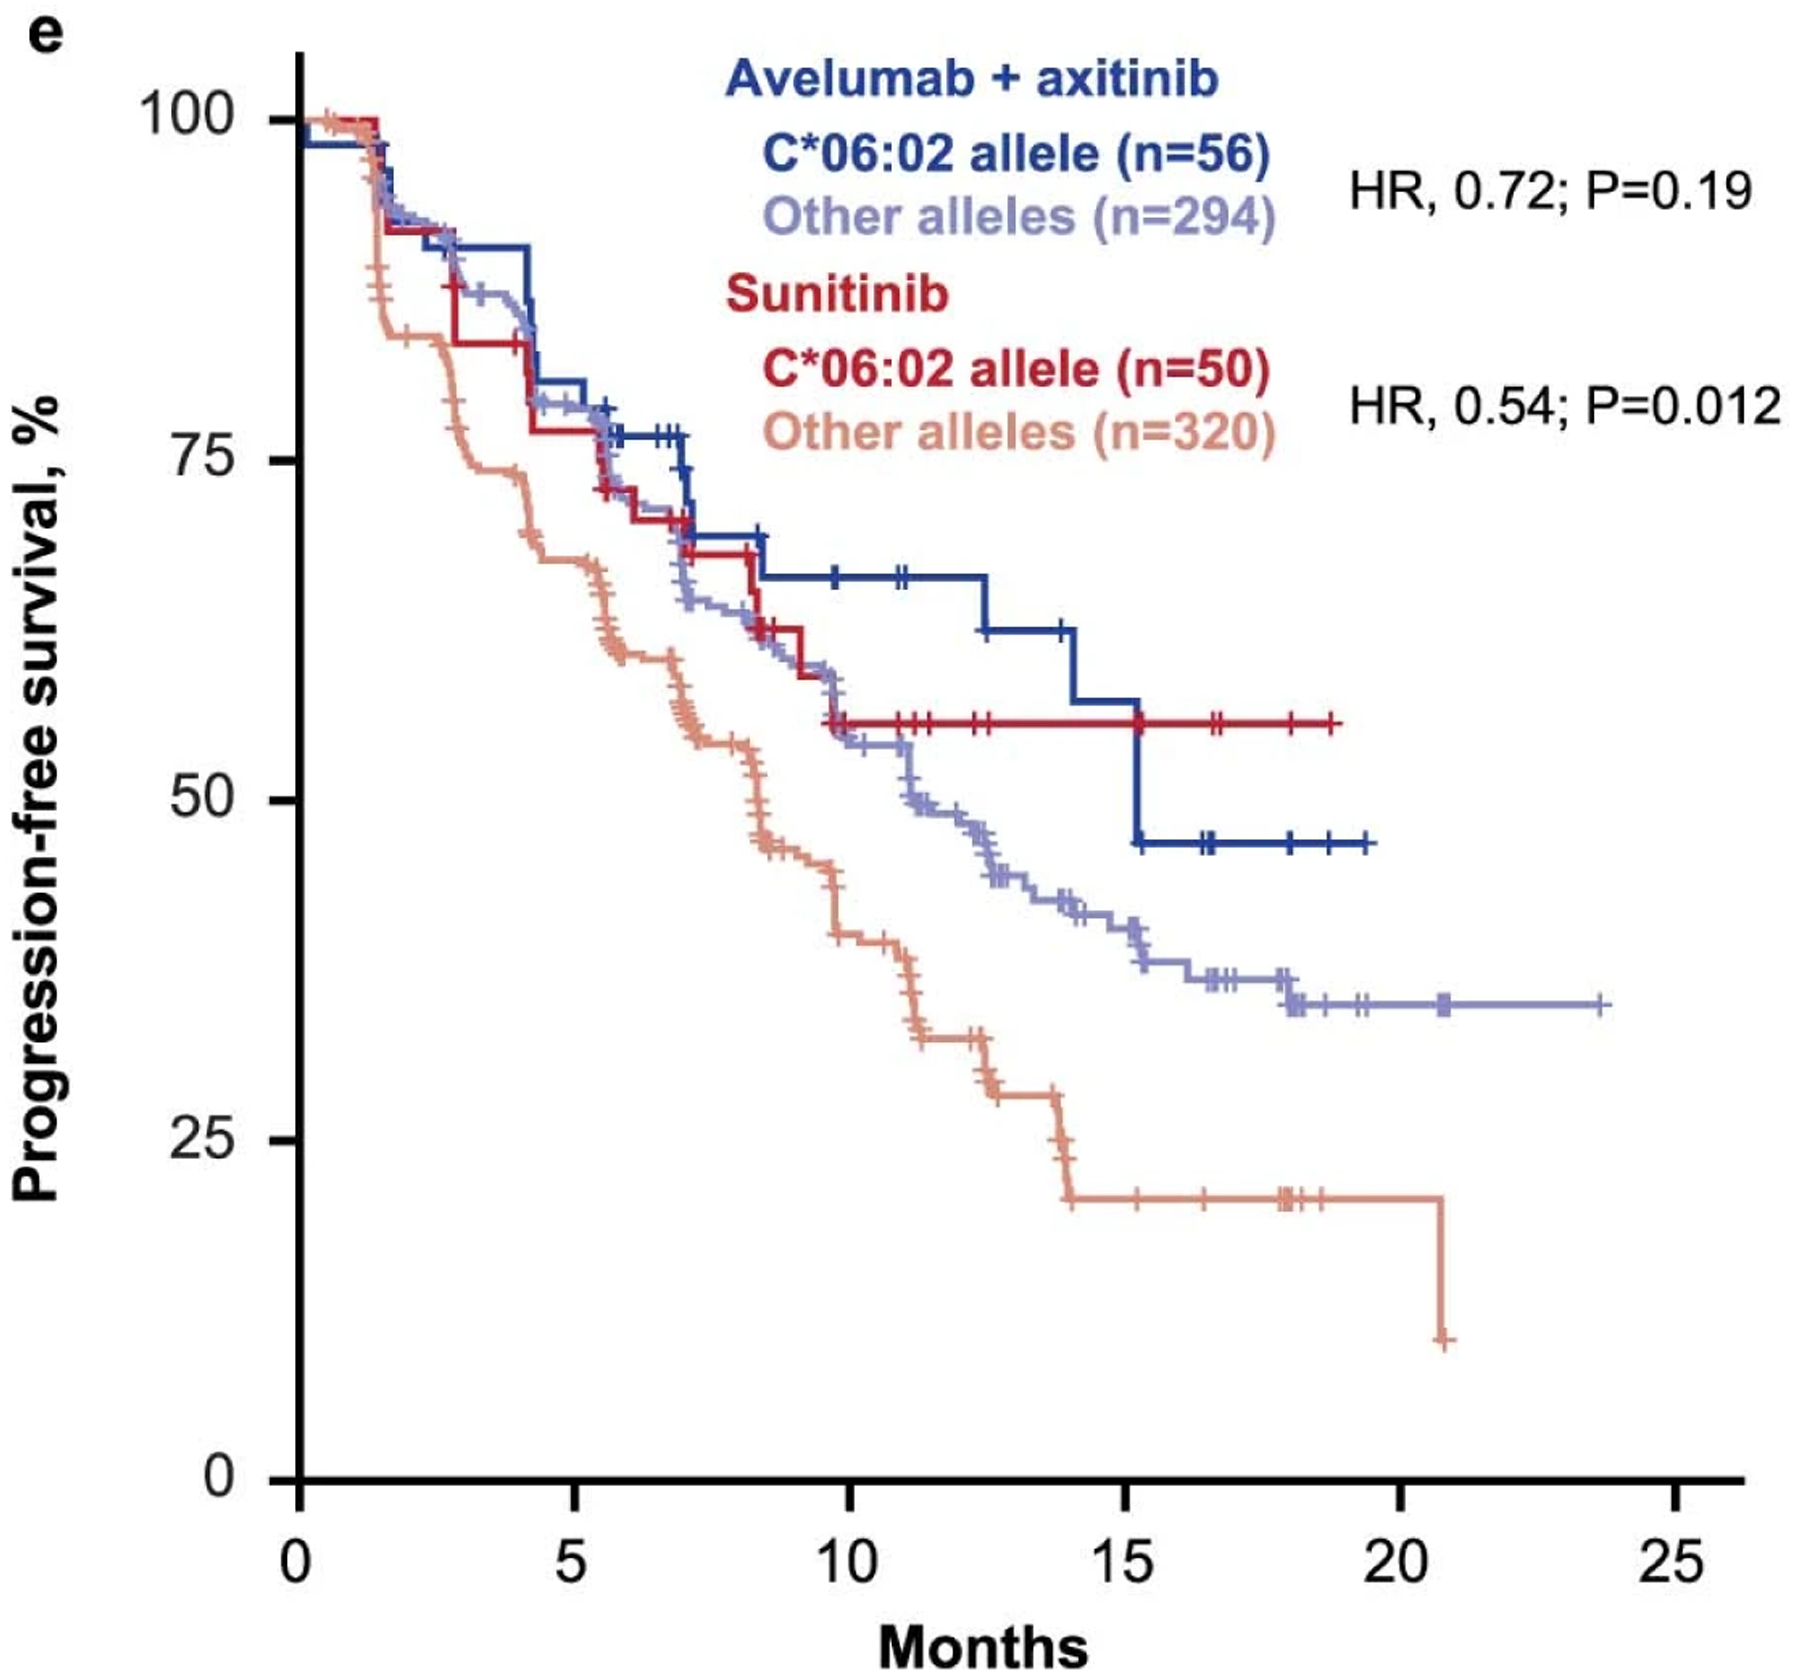
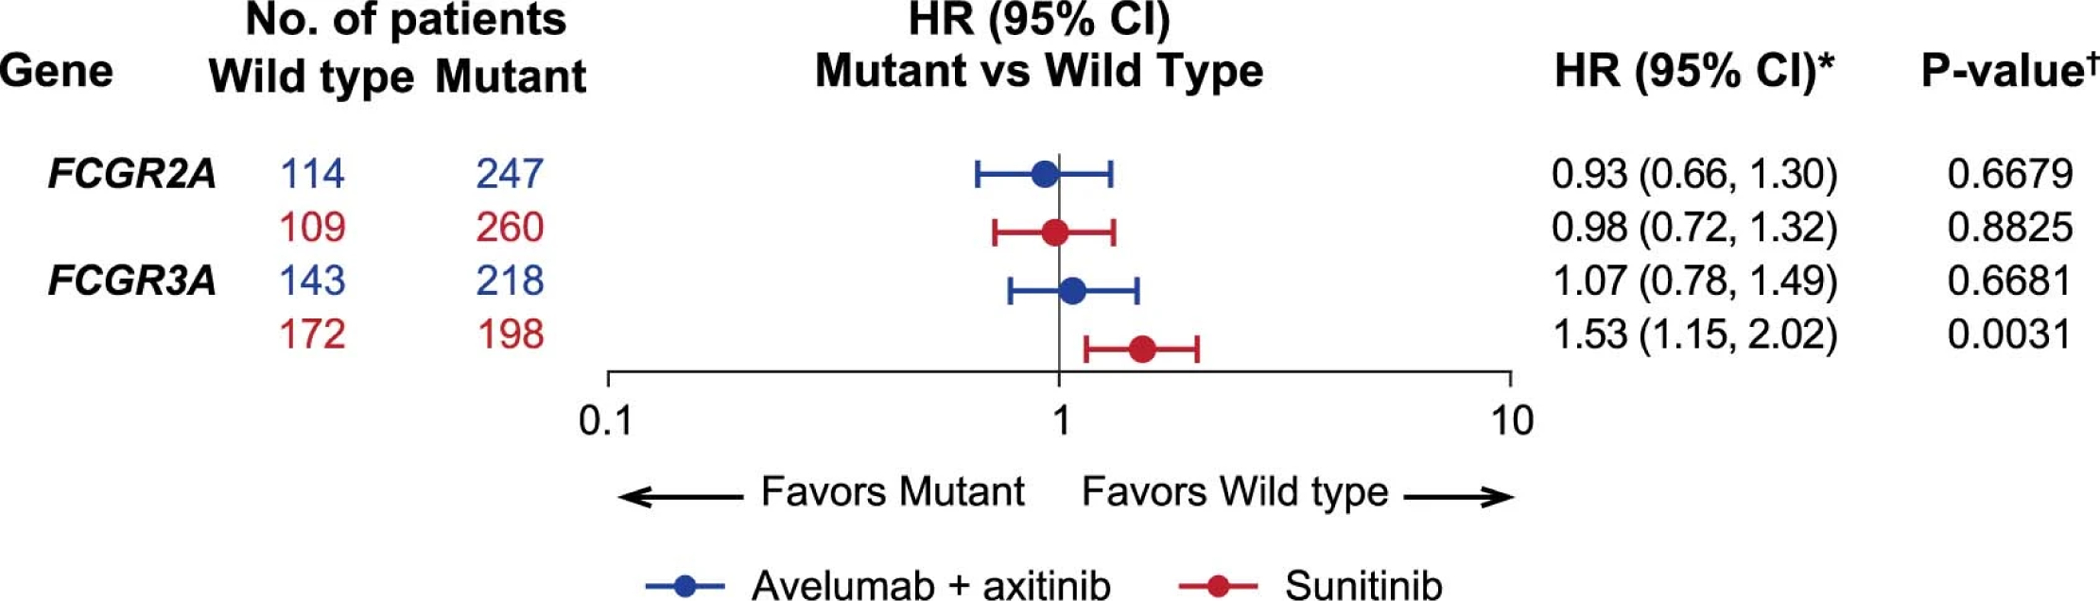
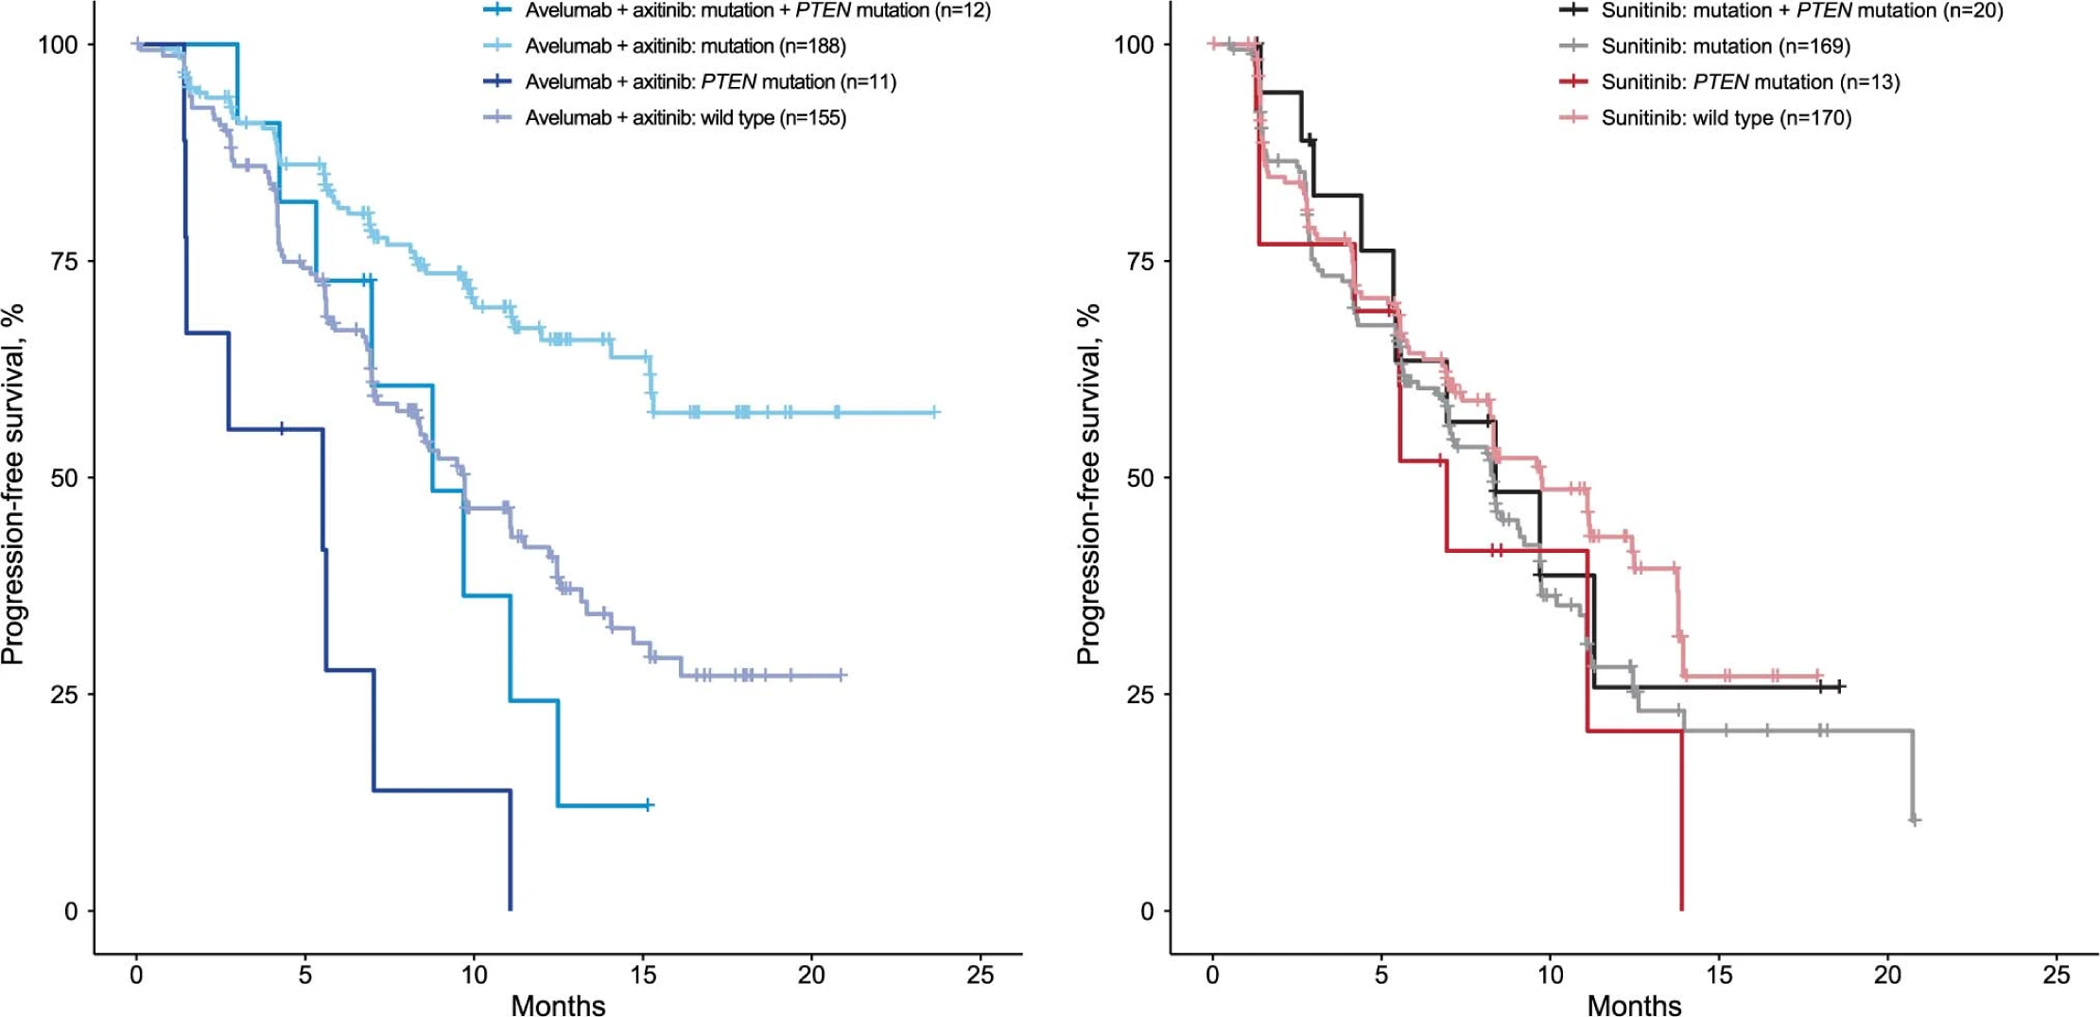
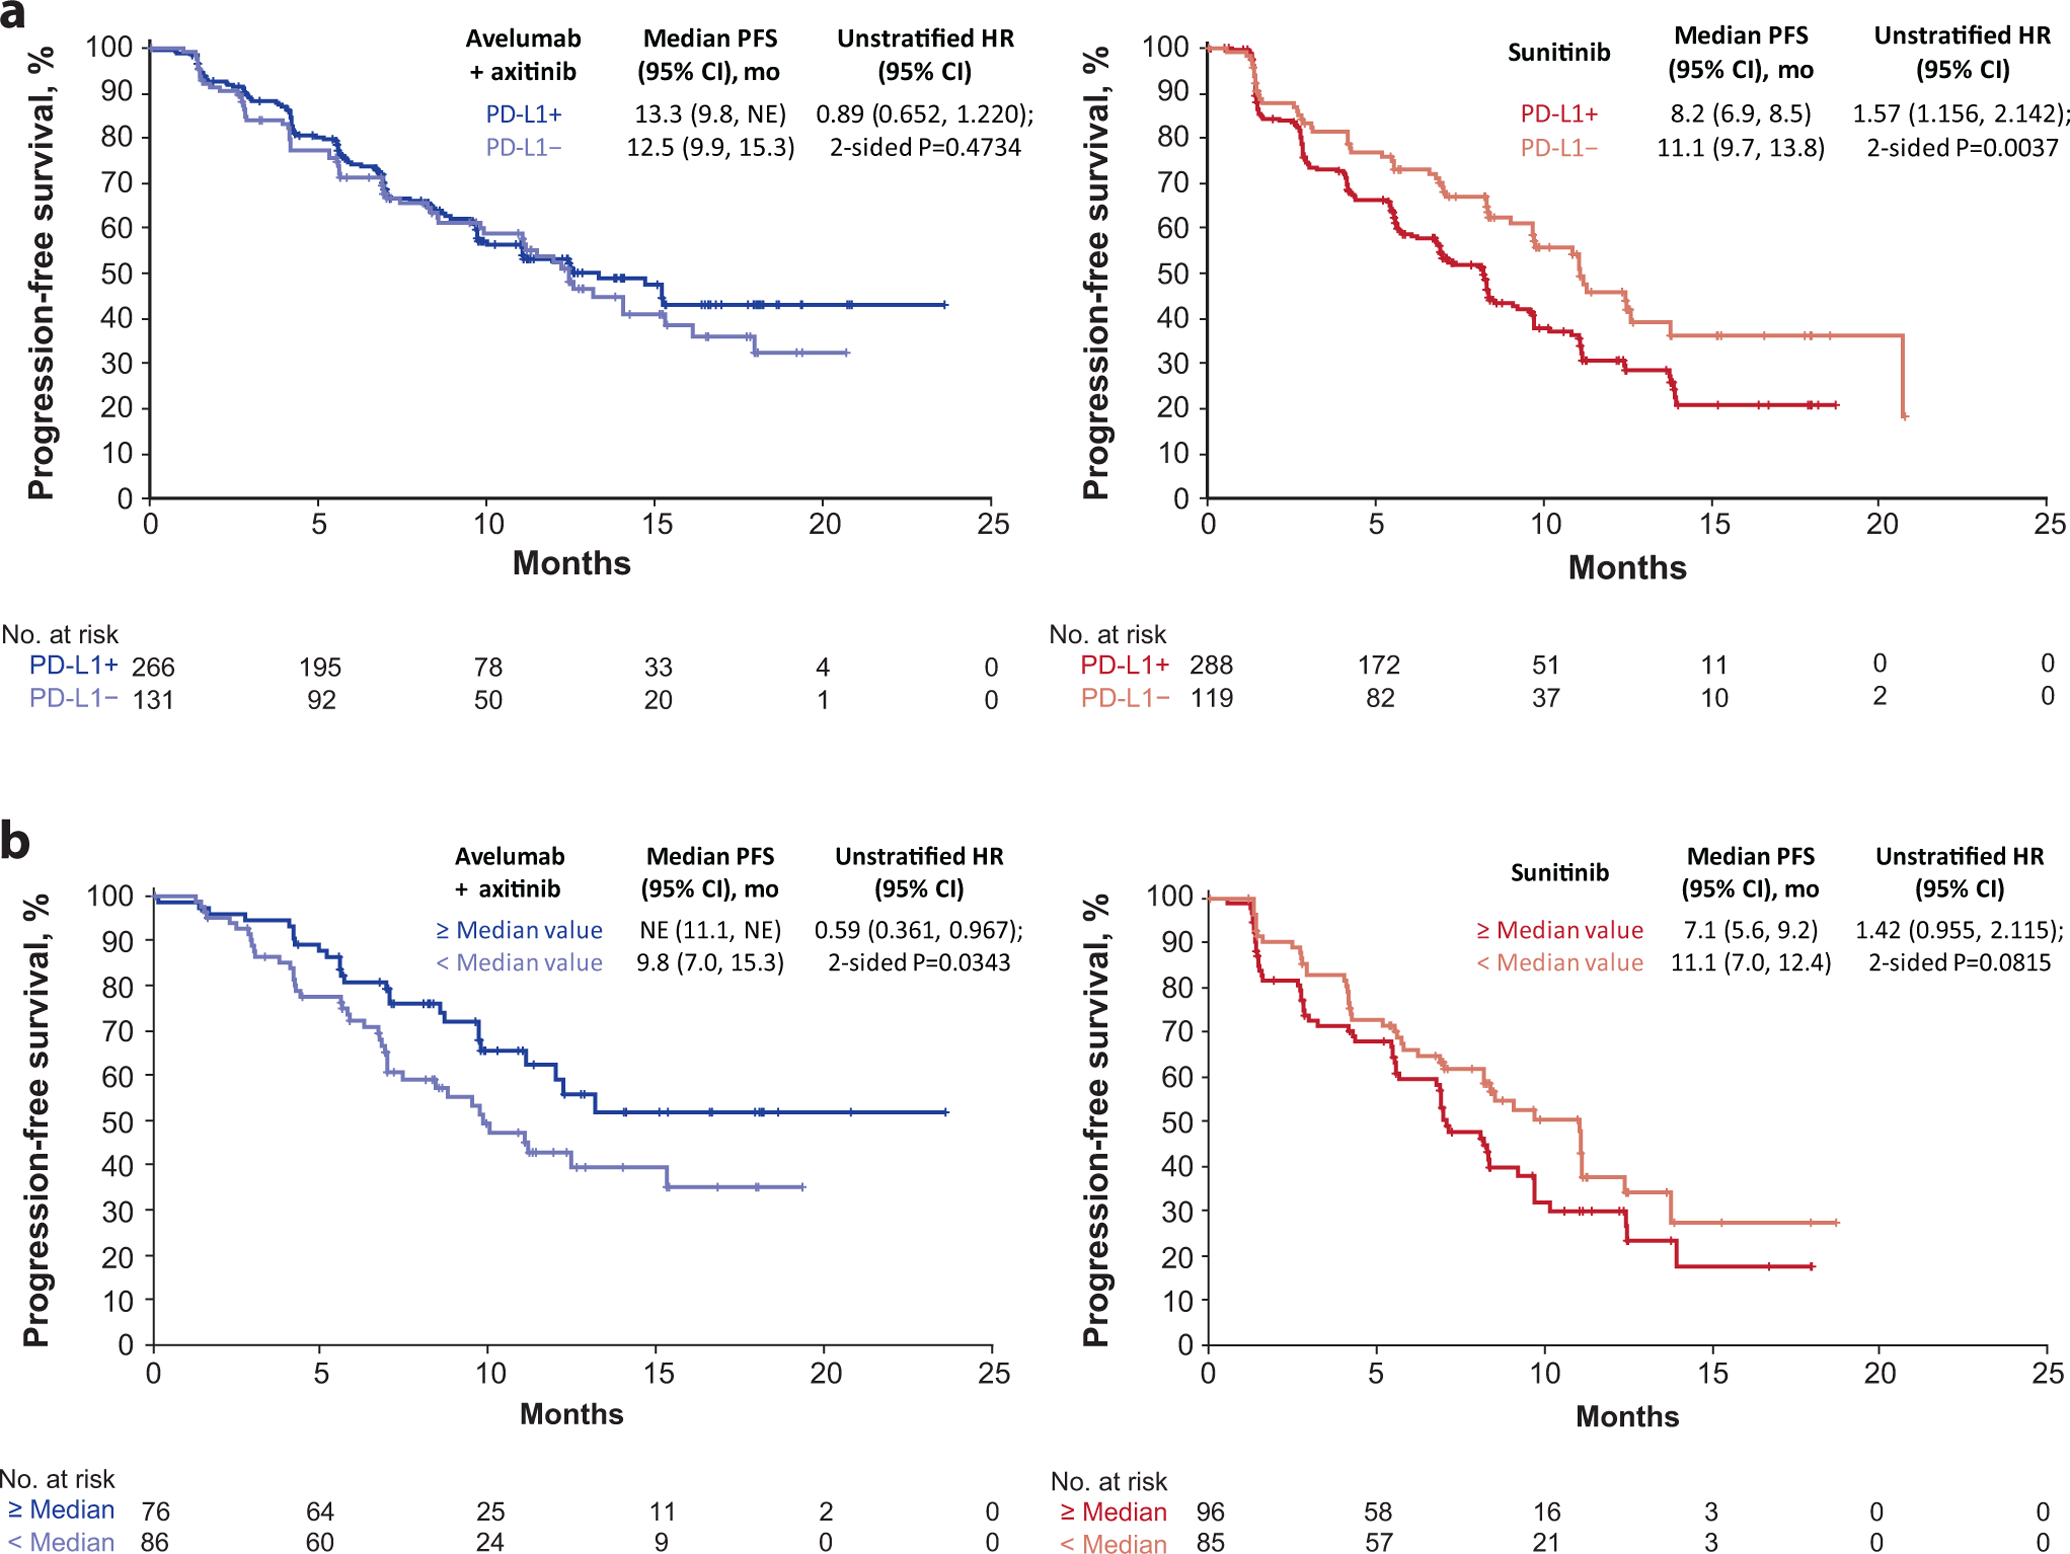
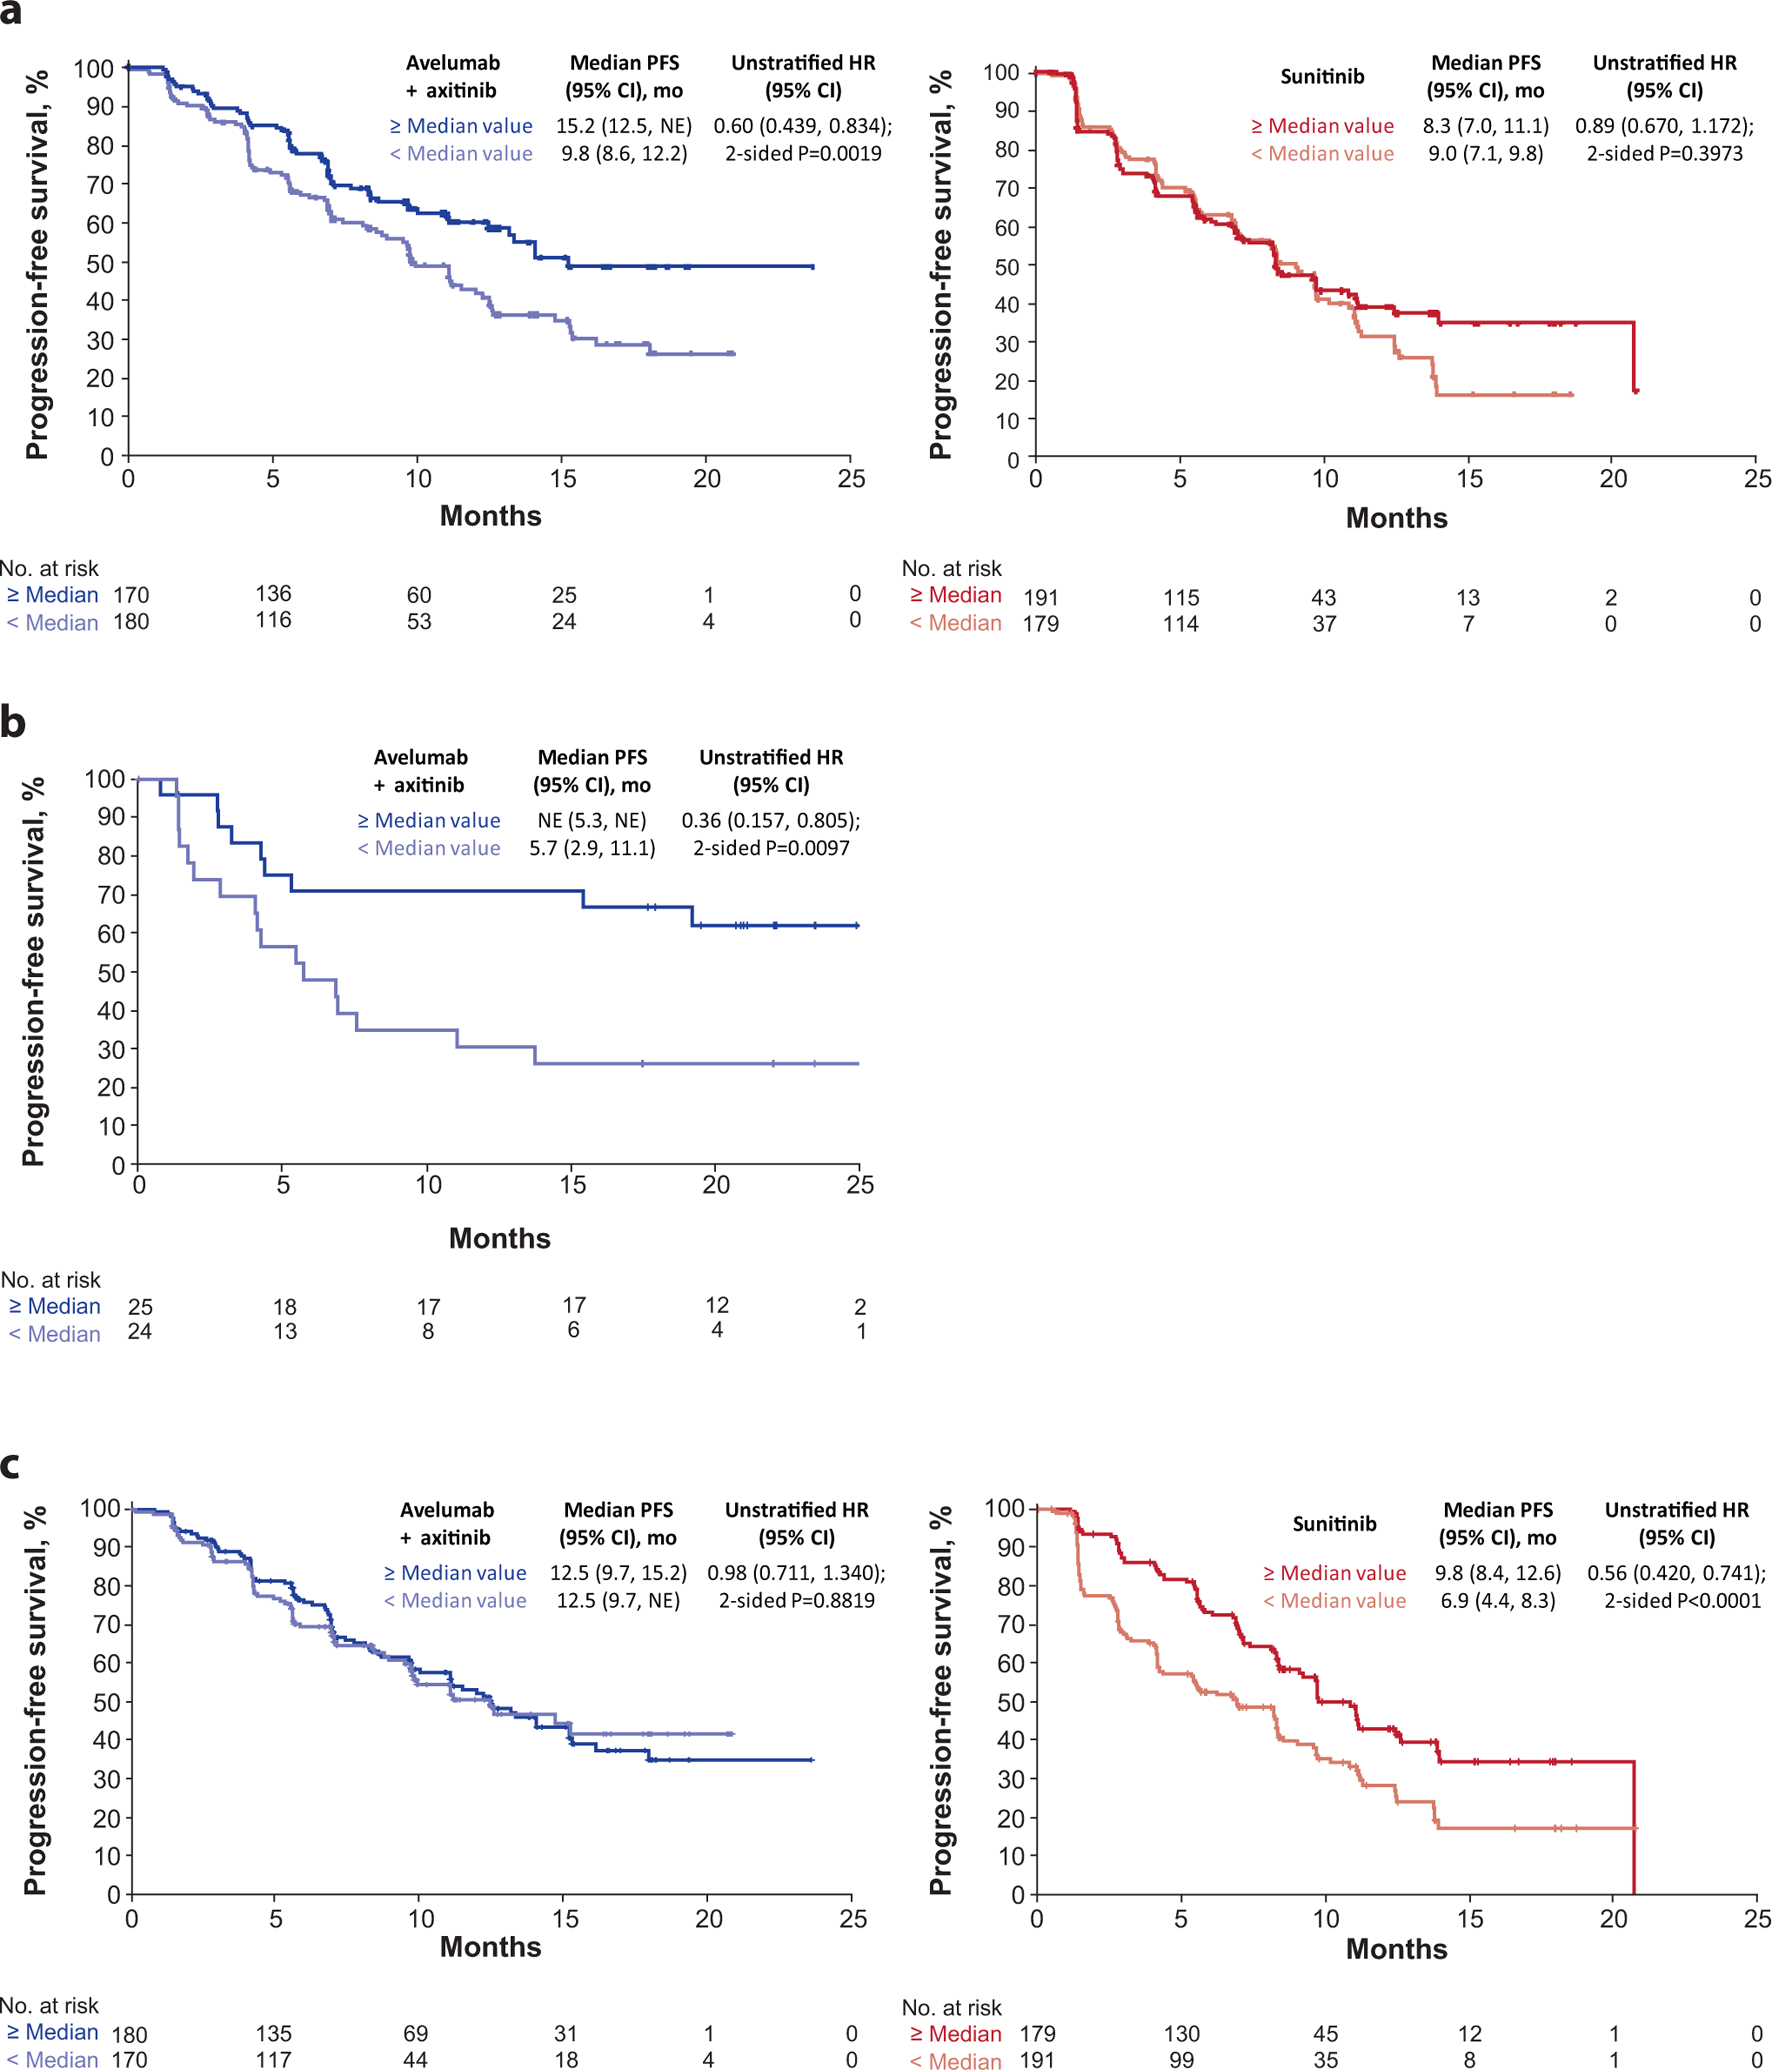
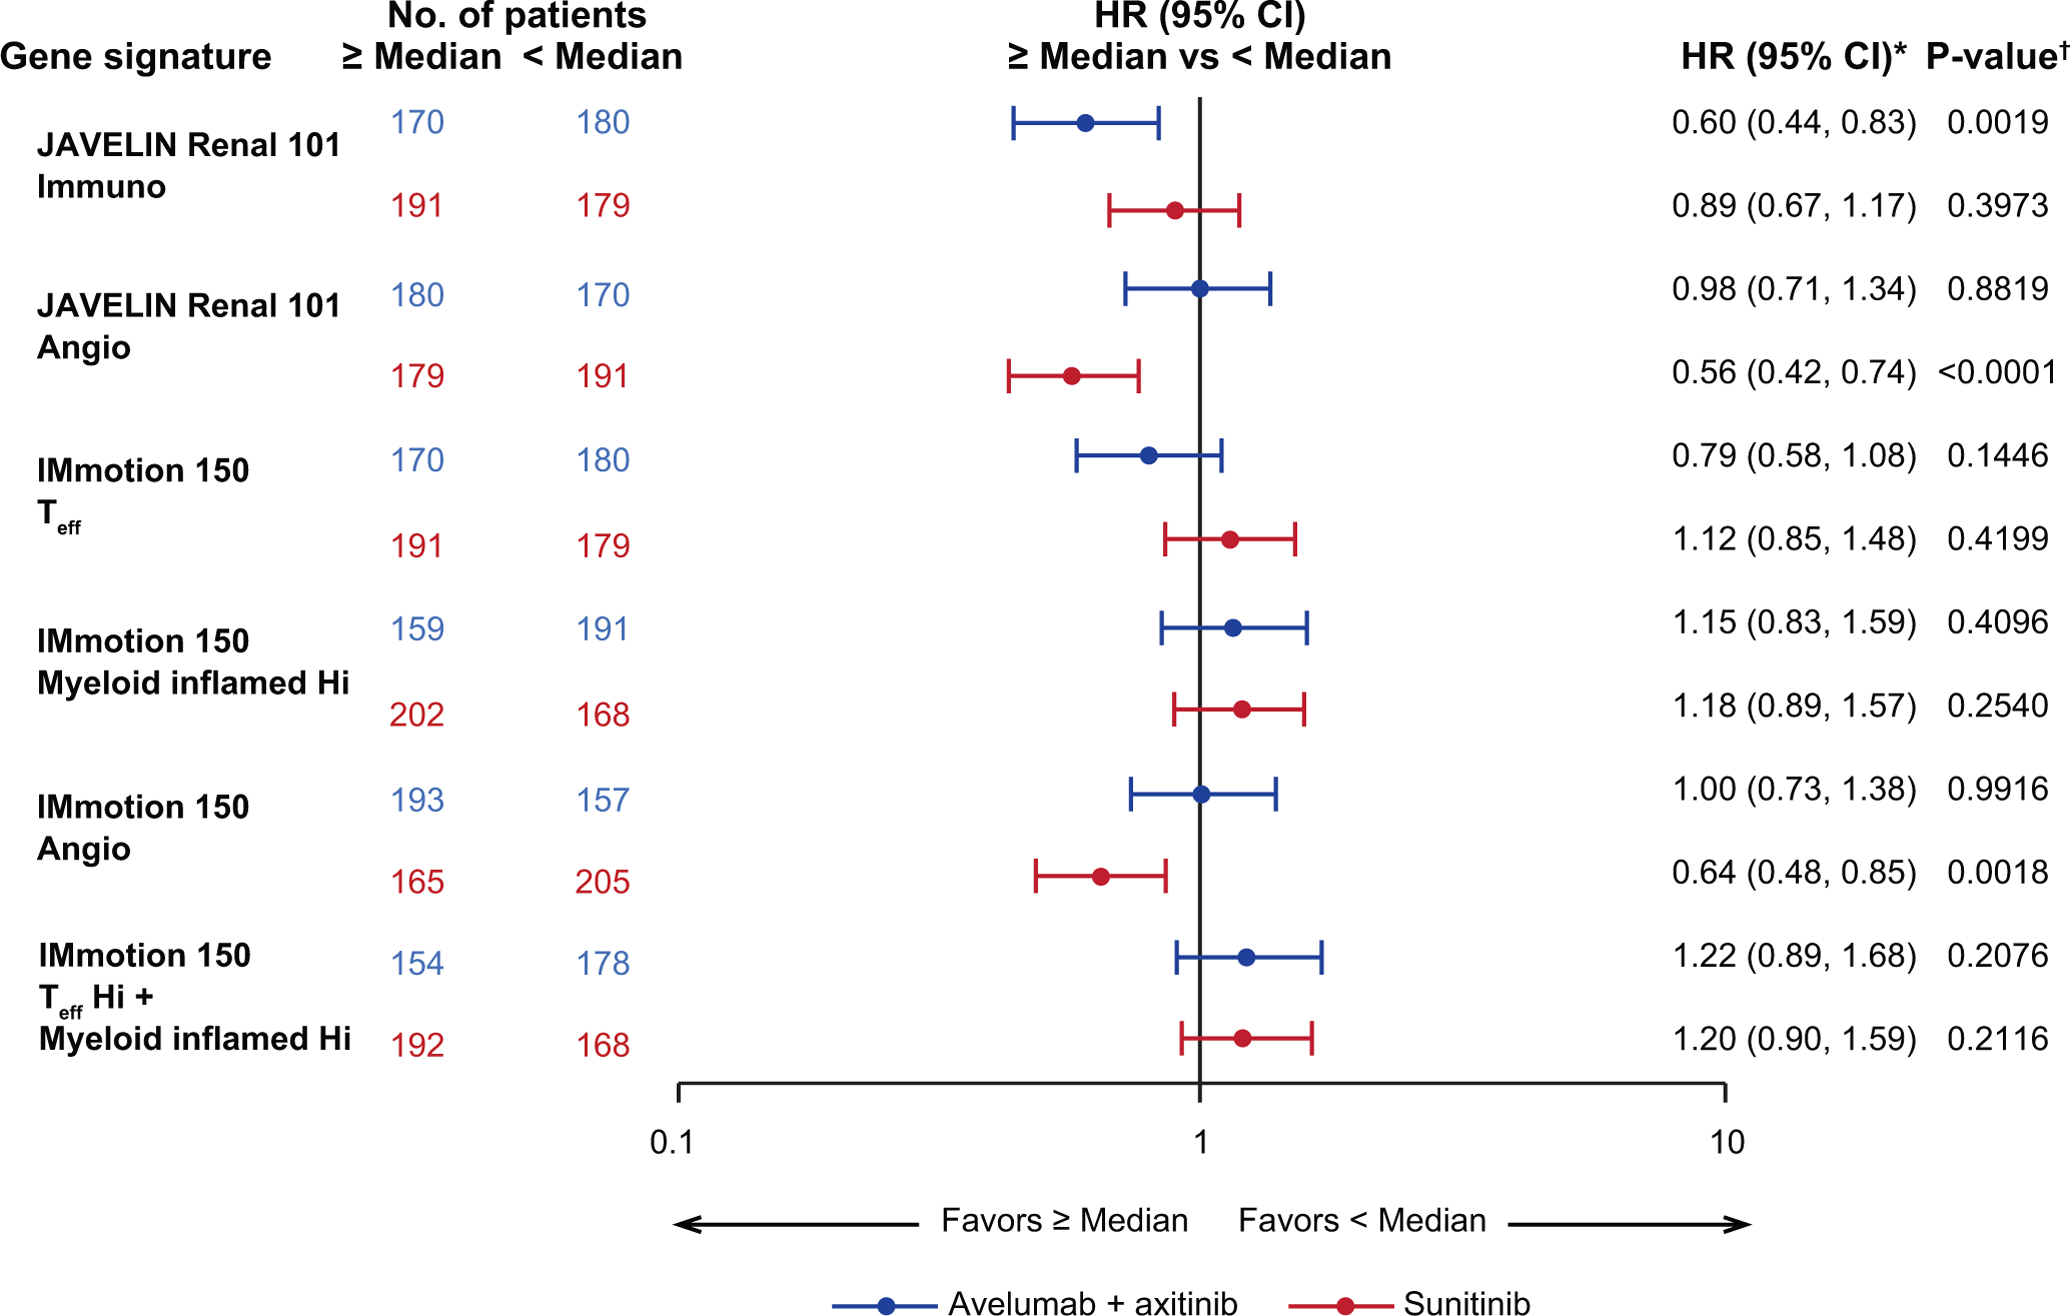
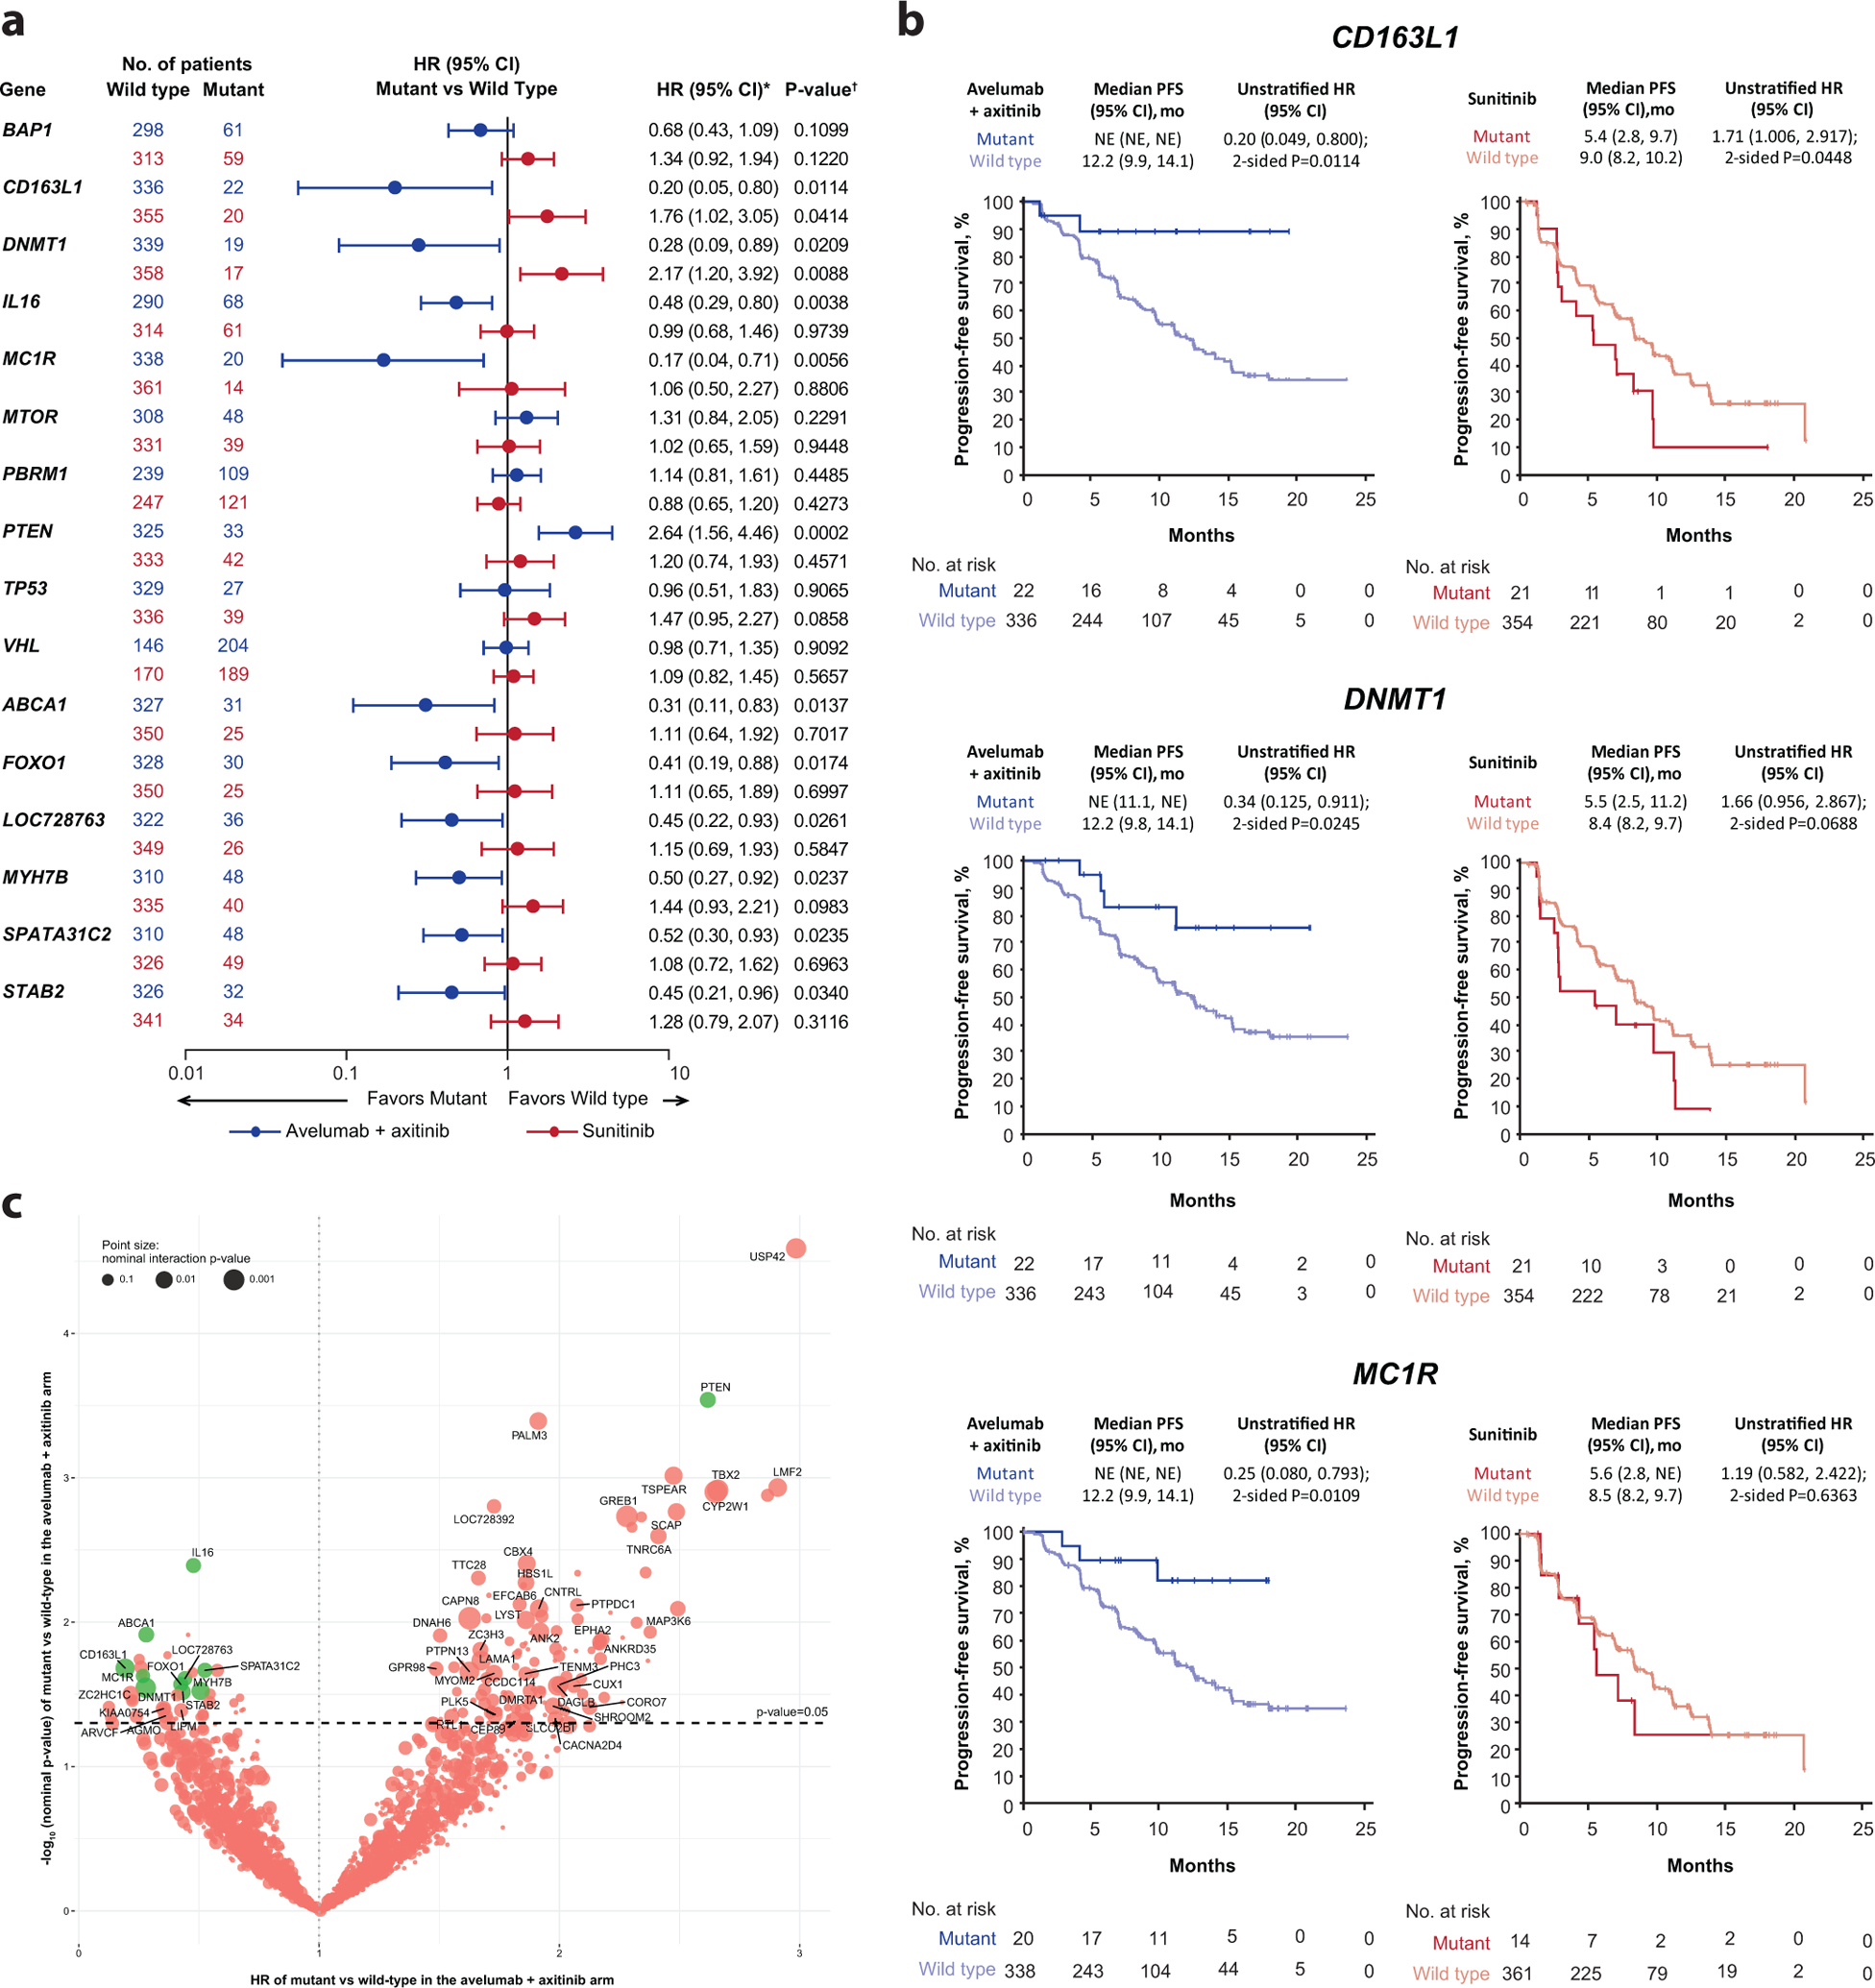
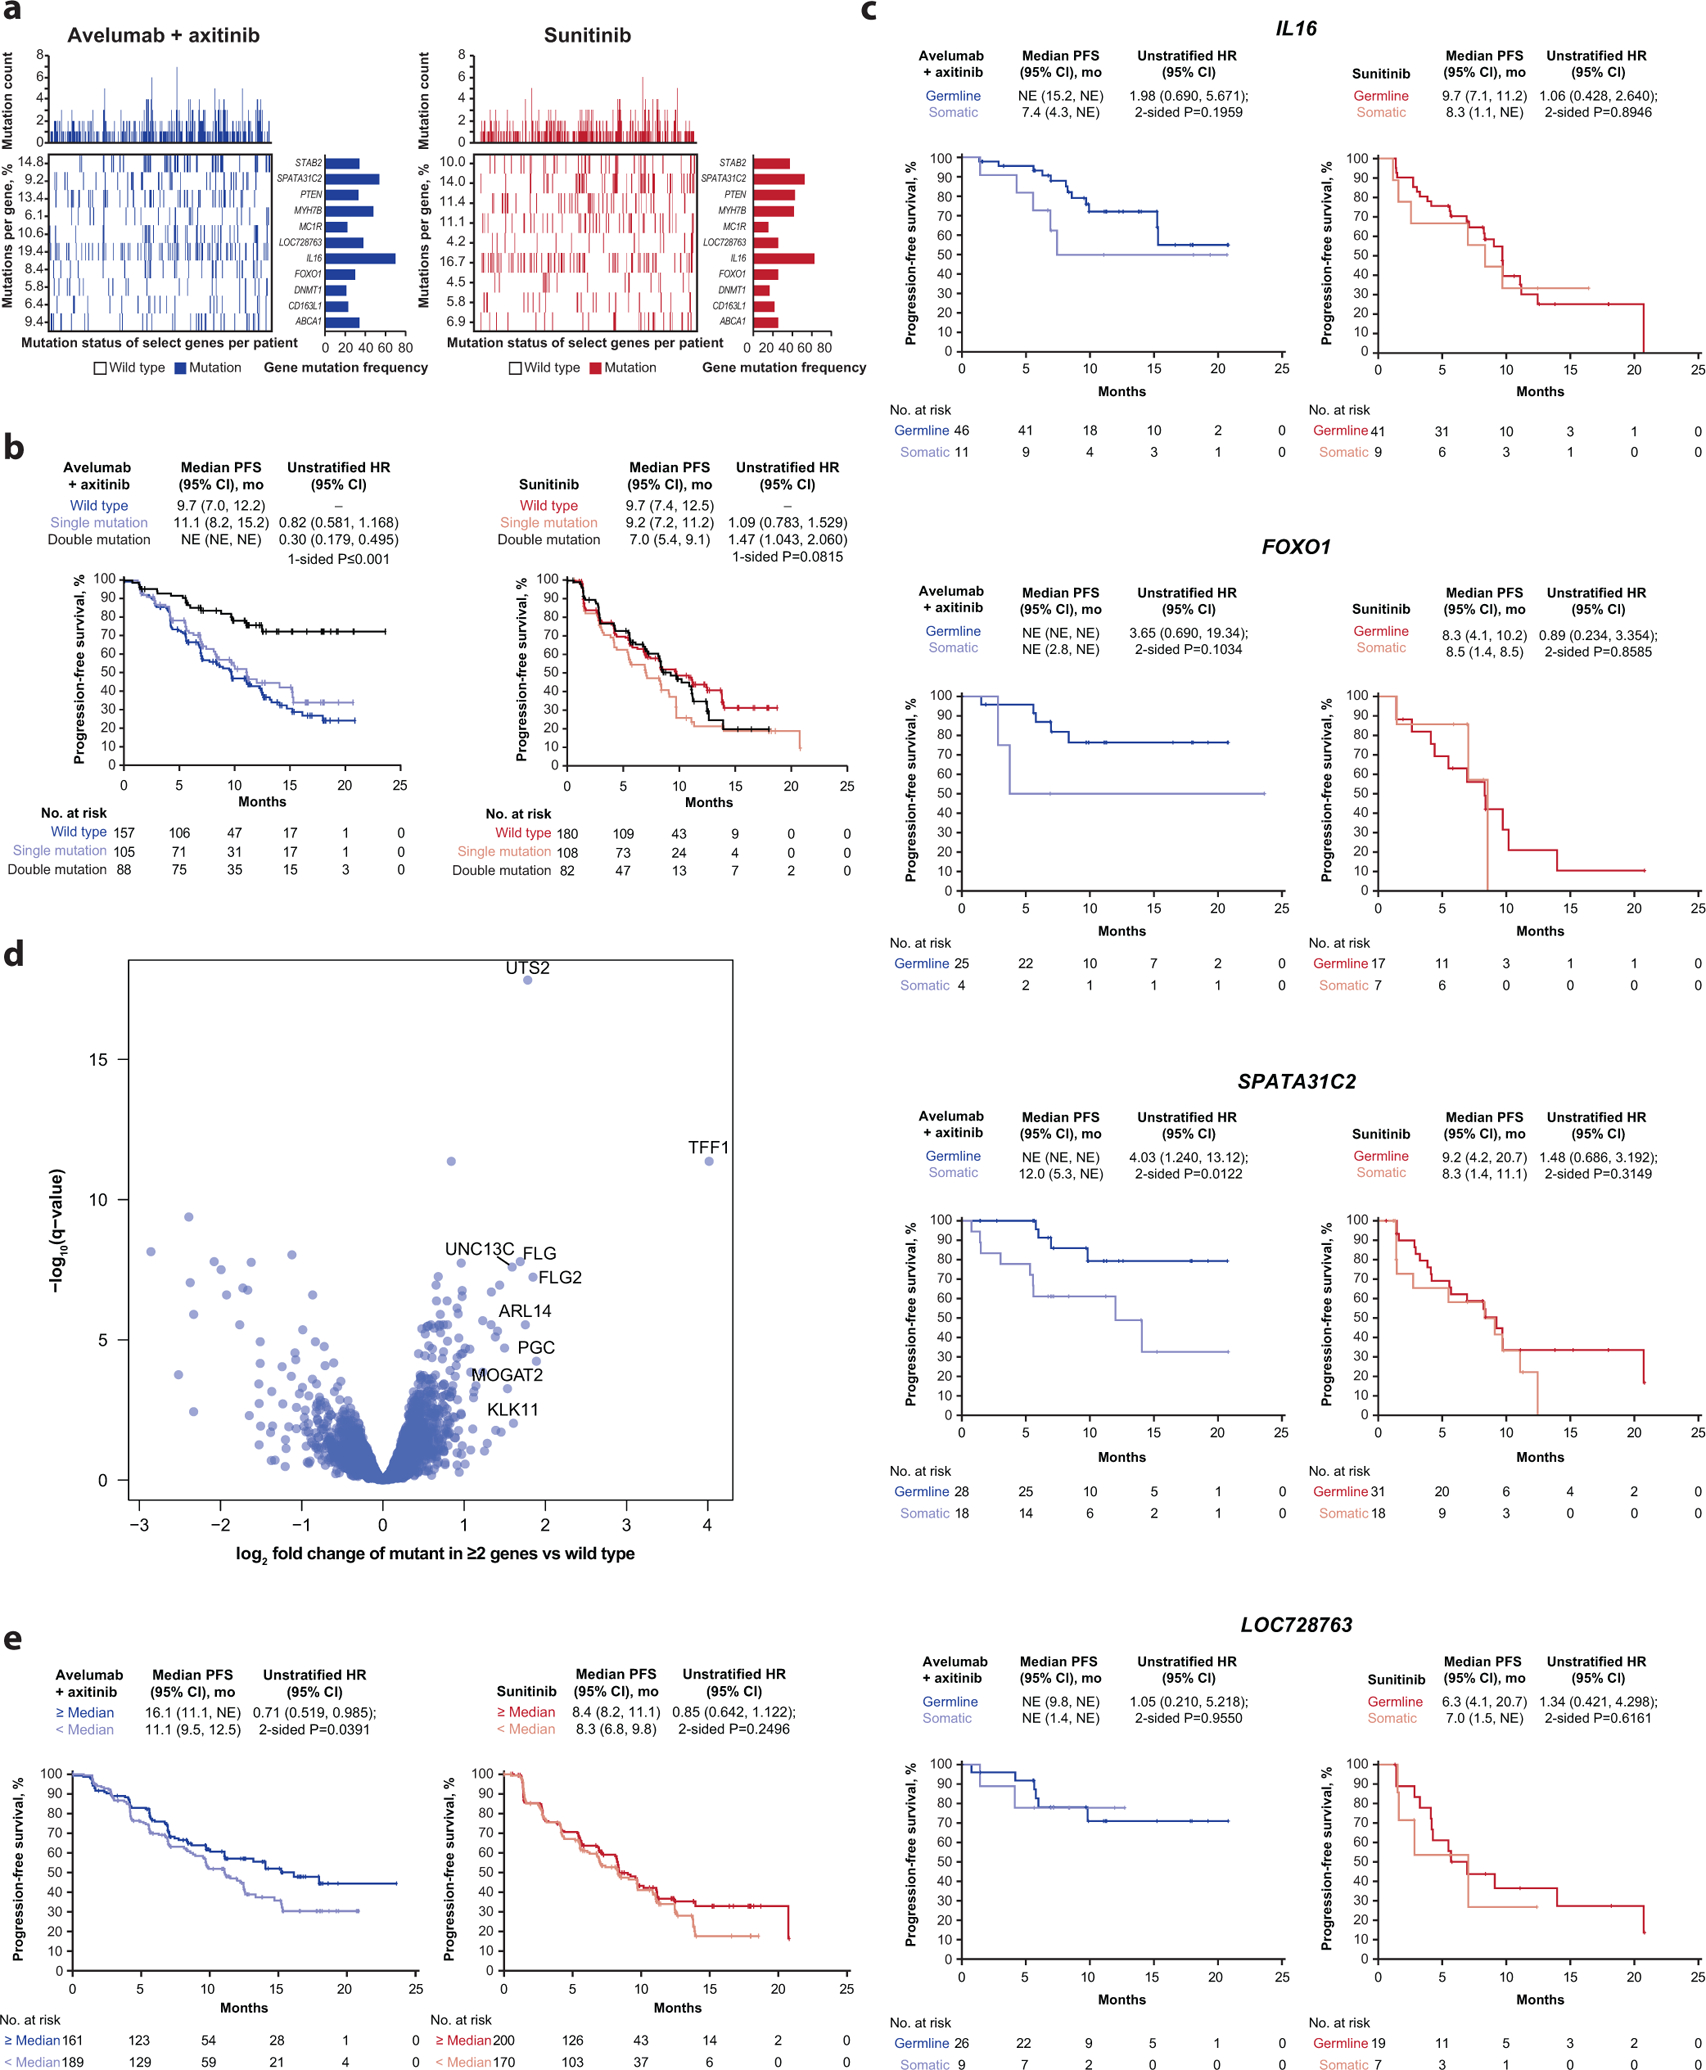
We report on molecular analyses of baseline tumor samples from the phase 3 JAVELIN Renal 101 trial (n = 886; NCT02684006 ), which demonstrated significantly prolonged progression-free survival (PFS) with first-line avelumab + axitinib versus sunitinib in advanced renal cell carcinoma (aRCC). We found that neither expression of the commonly assessed biomarker programmed cell death ligand 1 (PD-L1) nor tumor mutational burden differentiated PFS in either study arm. Similarly, the presence of FcɣR single nucleotide polymorphisms was unimpactful. We identified important biological features associated with differential PFS between the treatment arms, including new immunomodulatory and angiogenesis gene expression signatures (GESs), previously undescribed mutational profiles and their corresponding GESs, and several HLA types. These findings provide insight into the determinants of response to combined PD-1/PD-L1 and angiogenic pathway inhibition and may aid in the development of strategies for improved patient care in aRCC.


Figures

Extended Data Fig. 1:
Extended Data Fig. 1:. Progression-free survival (PFS) according to (a) CD8+ T cells in the invasive margin, (b) total tumor area and (c) at the tumor center.
Kaplan-Meier analysis was done to evaluate the association of PFS and the presence of CD8+ cells within regions of the tumor (Cox proportional hazards model with one-sided log-rank test). NE, not estimable.
Extended Data Fig. 2:
Extended Data Fig. 2:. Representative images of CD8 expression by immunohistochemistry in (a, b) CD8+ samples and (c, d) CD8 samples.
a, c, Black boxes denote magnified regions of interest displayed in b and d; scale bars = 2 mm. b, d, Scale bars = 100 μm.
Extended Data Fig. 3:
Extended Data Fig. 3:. Progression-free survival according to CD8+ T cells following ImmuneNet deconvolution.
Cox proportional hazards model was used and P values.
Extended Data Fig. 4:
Extended Data Fig. 4:. Heatmap of correlation of WGCNA clusters vs consensus WGCNA clusters.
The heatmap depicts Pearson correlation of signature scores between the 25 original WGCNA clusters and the 23 consensus WGCNA clusters. It demonstrates that 20 of the clusters can be robustly found by both methods. These 20 clusters have been annotated by hypergeometric tests for the top enriched pathways, respectively, and they indeed have the highest correlation to the cluster with a matching annotation by the other method. Three clusters by the consensus method and five clusters by WGCNA (at the bottom right of the heatmap) do not have a matching cluster using the other method, representing contributions from multiple other clusters/biological processes. Importantly, the 26-gene JAVELIN Renal 101 Immuno signature identified by the WGCNA method is highly correlated with the immune response cluster by the consensus method (correlation=0.95, P value <2.2e-16), confirming the robustness of the WGCNA findings.
Extended Data Fig. 5:
Extended Data Fig. 5:. Volcano plot of association of coexpression signatures with PFS in the combination arm.
Cox proportional hazards model was used and P values. Q values were derived from multiple hypothesis adjustment using FDR.
Extended Data Fig. 6:
Extended Data Fig. 6:. Progression-free survival according to metabolic pathways: (a) oxygen transport, (b) lipid metabolism, (c) organic acid metabolism and (d) glucocorticoid metabolism.
Cox proportional hazards model was used and P values. No multiple hypothesis adjustment was made.
Extended Data Fig. 7:
Extended Data Fig. 7:. Correlation between DUX4 signature and expression of HLA-A, -B, and -C.
The triangle symbol in the box represents the mean value. The horizontal line in the box represents the median. Upper and lower box lines represent the third and first quartiles, respectively. Two-sided P value is from Wilcoxon rank-sum test. Analysis value is converted to log2.
Extended Data Fig. 8:
Extended Data Fig. 8:. HLA types associated with differential progression-free survival.
Cox proportional hazards model was used, and the Other alleles group was the reference group. Two-sided Wald test was used for P values. No multiple hypothesis adjustment was made.
Extended Data Fig. 8:
Extended Data Fig. 8:. HLA types associated with differential progression-free survival.
Cox proportional hazards model was used, and the Other alleles group was the reference group. Two-sided Wald test was used for P values. No multiple hypothesis adjustment was made.
Extended Data Fig. 9:
Extended Data Fig. 9:. Effect of Fcγ receptor gene polymorphisms on progression-free survival.
*Cox proportional hazards model with wild type as the reference group was used to calculate HR and 95% CI. An HR < 1 indicates better survival in the mutant group, while an HR > 1 indicates better survival in the wild type group. †Two-sided log-rank test was performed to compare between wild type and mutant groups.
Extended Data Fig. 10:
Extended Data Fig. 10:. Impact of PTEN mutation in combination with other mutations of interest on progression-free survival (PFS) in the (left) avelumab + axitinib and (right) sunitinib arm.
Kaplan-Meier analysis was done to evaluate the association of PFS and the presence of PTEN mutations in combination with other mutations of interest (Cox proportional hazards model).
Figure 1.
Figure 1.
Progression-free survival (PFS) according to (a) programmed cell death ligand 1 (PD-L1) expression and (b) median invasive margin surface area by immunohistochemistry (Cox proportional hazards model with two-sided log rank test). HR, hazard ratio; NE, not estimable.
Figure 2.
Figure 2.
Progression-free survival (PFS) according to (a) 26-gene JAVELIN Renal 101 Immuno signature, (b) validation of the signature in an independent dataset, and (c) PFS according to JAVELIN Renal 101 Angio signature (Cox proportional hazard model with two-sided log rank test). HR, hazard ratio; NE, not estimable.
Figure 3.
Figure 3.
Progression-free survival (PFS) in JAVELIN Renal 101 patients according to expression of gene signatures. Angio, angiogenesis; Hi, high; Seq, sequencing; Teff, effector T-cell. * Cox proportional hazards model with < Median as the reference group was used to calculate hazard ratio (HR) and 95% CI. HR < 1 indicates better survival in the ≥ median group, while HR > 1 indicates better survival in the < median group. † Two-sided log-rank test was performed to compare overall median cutoff groups.
Figure 4.
Figure 4.
Progression-free survival (PFS) according to (a and b) protein-altering mutations in prioritized/selected genes and (c) all genes assessed. HR, hazard ratio; NE, not estimable; Seq, sequencing. * Cox proportional hazards model with wild type as the reference group used to calculate hazard ratio (HR) and 95% CI. HR <1 indicates better survival in the mutant group, while HR >1 indicates better survival in the wild-type group. † Two-sided log-rank test was performed to compare between wild type/mutant groups. (c) Cox proportional hazards model was used to test dependence of PFS on gene mutational status. Wild type is the reference group and two-sided Wald test was used. Following multiplicity adjustment, no gene reached statistical significance. Green dots represent prioritized genes, as described in the methods.
Figure 5.
Figure 5.
(a) Distribution of mutations among trial population, (b) progression-free survival (PFS) according to the presence of double mutations and (c) germline vs somatic mutations, (d) volcano plot of gene expression profiles comparing those from patients with ≥ 2 of any of the mutations vs those with wild-type alleles, and (e) PFS according to UTS2 expression. (b) P value is from one-sided log-rank testing; exact P value is 0.000005335. For hazard ratio (HR), wild type is reference. (c) P value is from log-rank testing. For HR, germline is reference. (d) P values are calculated by Wald test in DESeq2. Q-values were derived by multiple hypothesis adjustment using FDR. (e) For HR, < median is reference. P values are from two-sided log-rank testing. HR and 95% CI were calculated using the Cox proportional hazards model. NE, not estimable.

Comment in

References

    1. Heery CR, O’Sullivan-Coyne G, Madan RA, et al.Avelumab for metastatic or locally advanced previously treated solid tumours (JAVELIN Solid Tumor): a phase 1a, multicohort, dose-escalation trial. The Lancet Oncology. 2017;18(5):587–598. doi:10.1016/S1470-2045(17)30239-5 - DOI - PMC - PubMed
    1. Motzer RJ, Penkov K, Haanen J, et al.Avelumab plus Axitinib versus Sunitinib for Advanced Renal-Cell Carcinoma. N Engl J Med. 2019;380(12):1103–1115. doi:10.1056/NEJMoa1816047 - DOI - PMC - PubMed
    1. McDermott DF, Huseni MA, Atkins MB, et al.Clinical activity and molecular correlates of response to atezolizumab alone or in combination with bevacizumab versus sunitinib in renal cell carcinoma. Nature Medicine. 2018;24(6):749. doi:10.1038/s41591-018-0053-3 - DOI - PMC - PubMed
    1. The Cancer Genome Atlas Research Network. Comprehensive molecular characterization of clear cell renal cell carcinoma. Nature. 2013;499(7456):43–49. doi:10.1038/nature12222 - DOI - PMC - PubMed
    1. Ayers M, Lunceford J, Nebozhyn M, et al.IFN-γ-related mRNA profile predicts clinical response to PD-1 blockade. J Clin Invest. 2017;127(8):2930–2940. doi:10.1172/JCI91190 - DOI - PMC - PubMed

Publication types

MeSH terms

Associated data

LinkOut - more resources