. 2020 Nov;26(11):1726-1732.
doi: 10.1038/s41591-020-1033-y. Epub 2020 Sep 7.

Genomic copy number predicts esophageal cancer years before transformation

Affiliations

Genomic copy number predicts esophageal cancer years before transformation

Sarah Killcoyne et al. Nat Med. 2020 Nov.

Abstract

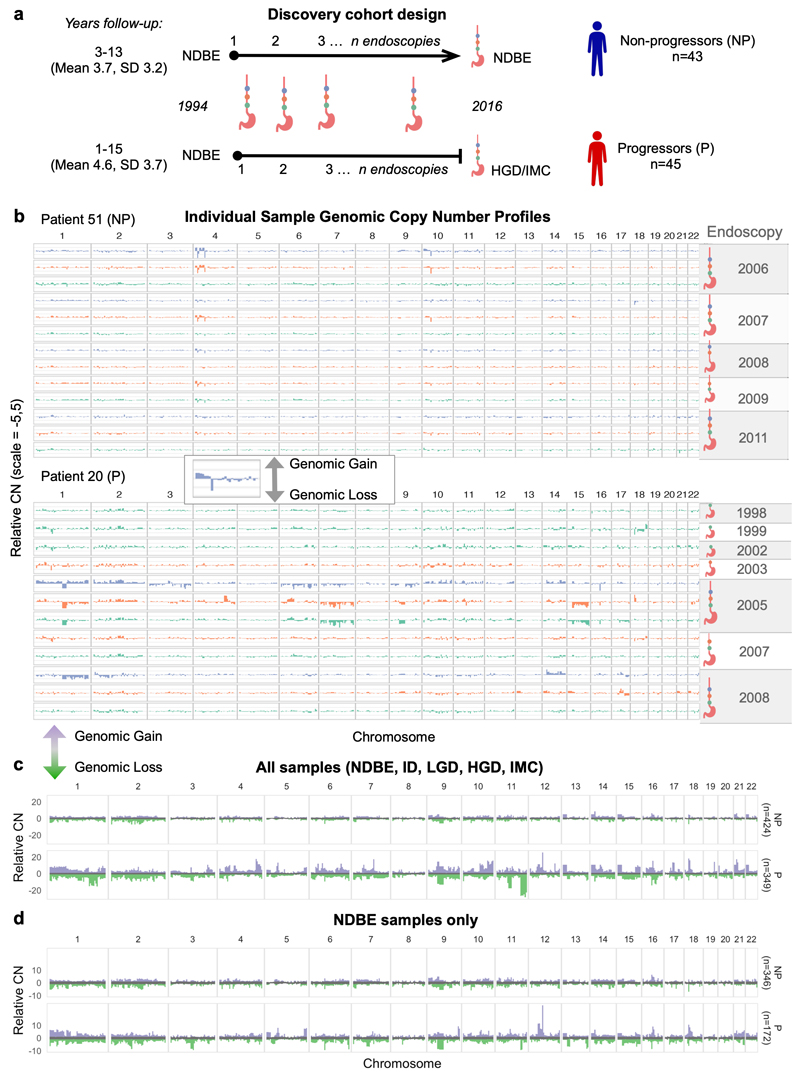
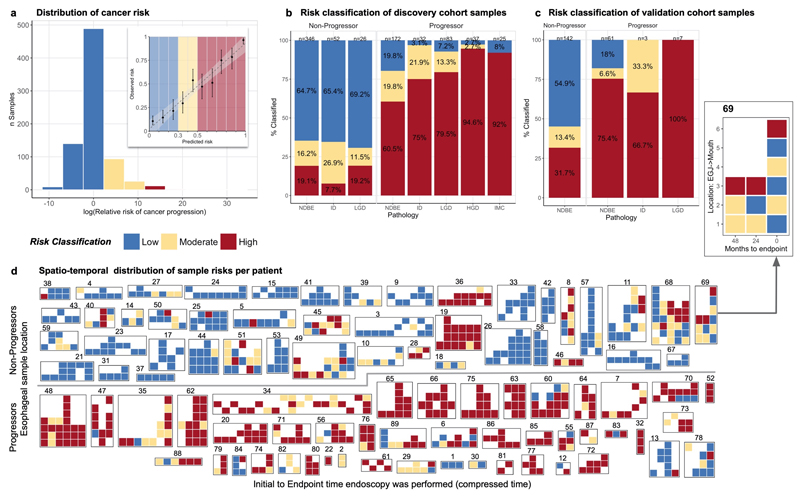
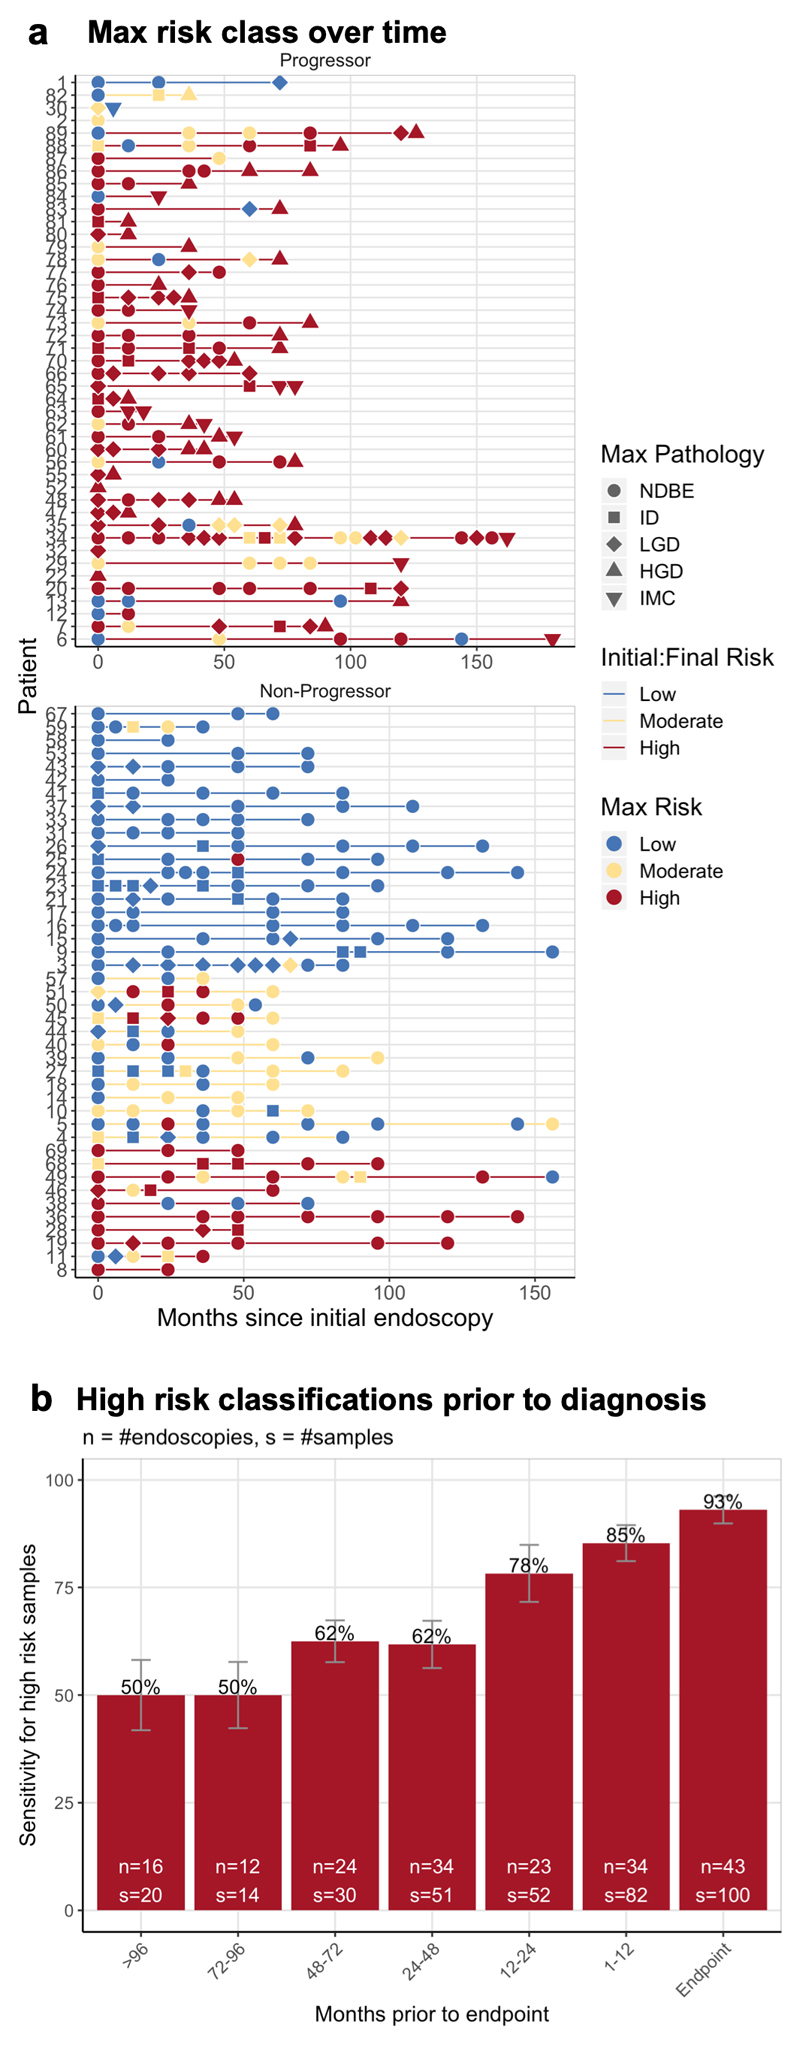
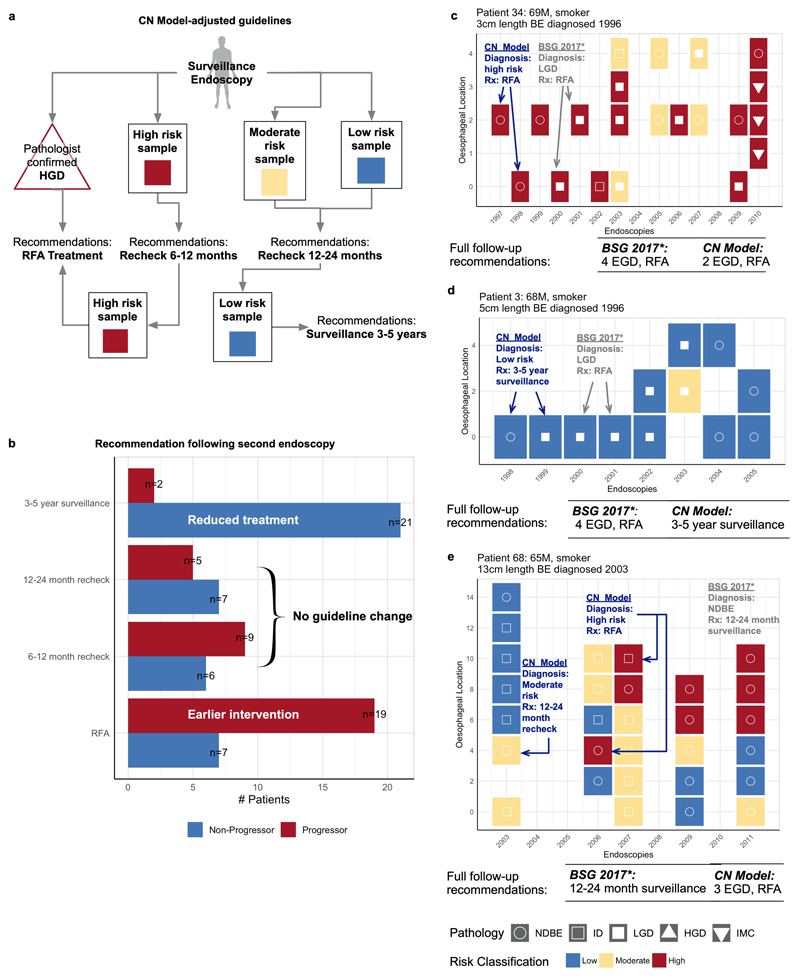
Recent studies show that aneuploidy and driver gene mutations precede cancer diagnosis by many years1-4. We assess whether these genomic signals can be used for early detection and pre-emptive cancer treatment using the neoplastic precursor lesion Barrett's esophagus as an exemplar5. Shallow whole-genome sequencing of 777 biopsies, sampled from 88 patients in Barrett's esophagus surveillance over a period of up to 15 years, shows that genomic signals can distinguish progressive from stable disease even 10 years before histopathological transformation. These findings are validated on two independent cohorts of 76 and 248 patients. These methods are low-cost and applicable to standard clinical biopsy samples. Compared with current management guidelines based on histopathology and clinical presentation, genomic classification enables earlier treatment for high-risk patients as well as reduction of unnecessary treatment and monitoring for patients who are unlikely to develop cancer.


Figures

Figure 1
Figure 1. Copy number profiles in Barrett’s Esophagous vary over space and time.
a. Shows the case-control cohort design for the discovery patient cohort (n=88). Non-progressor patients had a minimum follow-up of 3 years, progressor patients had a minimum one year follow-up and all patients start at NDBE. Archival samples were collected from every available endoscopy over time, and along the length of the BE segment. b-d Bar plots showing the adjusted CN values across the genome in 5Mb windows, with relative (within each sample) gains shown in the positive y-axis, and relative losses shown in the negative y-axis. b. Genomic CN profiles of individual samples for a progressor patient (P, top) and a non-progressor patient (NP, bottom). The colors across the chromosomes in each sample are based on the location relative to the stomach it was taken in the esophagus (sample nearest to the esophageal-gastric junction at the bottom, up the BE segment) and the ideograms to the right of the plots show the samples that belong to a single endoscopy indicated by the year. Note the variability in the CN profiles within samples from the progressor patient in chromosomes 14 and 17 in contrast to the shared pattern across the non-progressor patient in those regions. c-d, distribution of relative CN values at each genomic segment across all samples in the progressor and non-progressor patient groups. The grey in the middle is the median ± 1SD, indicating a likely diploid genome value. Purple and green show the range of relative gains and losses, respectively. In c all samples regardless of pathology are plotted and a large variation in the CN between progressor and non-progressor patients is clear (i.e. chromosomes 1, 4, 9, 11). In d only NDBE samples from both patient groups are plotted and the progressor patients still show a much larger CN signal despite being pathologically indistinguishable.
Figure 2
Figure 2. Genomic predictions of Barrett’s esophagus progression.
a. Histogram of the relative risk (RR) of cancer progression across the cohort based on the leave-one-patient out predictions. The highest RR is more than 30x greater risk of progression (dark reds) while the lowest RR is at a 10x lower risk (dark blues). Inset: shows the calibration of the predicted (x-axis) and observed (y-axis) probability of progression, evaluated in deciles. The ‘low’ (blue) and ‘high’ (red) risks are enriched for non-progressor and progressor patients respectively. b. Sample risk classifications in the discovery cohort of 88 patients (n=773 samples) plotted per pathology (e.g. NDBE, ID, LGD, HGD, IMC). These show that our model is able to predict progression before pathological changes are visible in NDBE samples and that c. these predictions are consistent in the independent validation cohort of 76 patients (n=213 samples). d. Illustration of risk classes across all samples in the discovery cohort (n=773). The row above the line shows progressor patients, while the row below the line are non-progressor patients. Each group of tiles denotes samples from a single patient, indicated by patient number above. On the x-axis endoscopies are plotted from the baseline on the left, to the final available endoscopy on the right. The y-axis indicates the relative location of the sample starting from the esophageal-gastric junction at the bottom up the length of the BE segment. The pop-out patient 69 shows example axis labels, all heatmaps include axis labels and pathology are included in Supplementary Figure 11.
Figure 3
Figure 3. Cancer risk over time.
a. Per-endoscopy mean aggregated risks plotted per-patient (y-axis) over time (x-axis) in the months since the initial endoscopy. The top plot shows patients who progressed, and we see that in most patients we consistently classified their samples as ‘high’ risk, similarly in the non-progressors we consistently predict the a low-risk group. The interesting patients are the non-progressors who have consistently been ‘high’ risk. Follow-up continues on these patients and it is possible that they may ultimately progress to HGD/IMC. b. Looks at only the progressive patients and shows that CN can identify 50% of high risk patients more than 8 years prior to HGD or cancer.
Figure 4
Figure 4. CN profiling facilitates earlier treatment and reduced monitoring.
a. Provides a schematic overview of surveillance guidelines based on the CN model risk classes. It is important to note that these guidelines would apply at each endoscopy, and that they use information from the previous endoscopy to determine the treatment or surveillance. b. Uses this schematic to characterize the discovery cohort patients after their second endoscopy (many years prior to dysplastic transformation). The blue bar at the top indicates the number of non-progressor patients who would have reduced treatment needs over time, while the red bar at the bottom shows those progressor patients who would have had earlier intervention. The bars in the middle two groups would be the same as current guidelines. c-e. Individual patients with each sample plotted at the time of endoscopy. Samples are colored based on their risk class. Relevant clinical information is included above each endoscopy plot including the length of the BE segment and patient age at diagnosis. The recommendations for each patient based on the 2015 BE management guidelines are shown on each patient tile. Below the patients are the overall follow-up recommendations for the current guidelines and the CN model.

Comment in

References

    1. Gerstung M, et al. The evolutionary history of 2,658 cancers. Nature. 2020;578:122–128. - PMC - PubMed
    1. Mitchell TJ, et al. Timing the Landmark Events in the Evolution of Clear Cell Renal Cell Cancer: TRACERx Renal. Cell. 2018 doi: 10.1016/j.cell.2018.02.020. - DOI - PMC - PubMed
    1. Lee JJ-K, et al. Tracing Oncogene Rearrangements in the Mutational History of Lung Adenocarcinoma. Cell. 2019 doi: 10.1016/j.cell.2019.05.013. - DOI - PubMed
    1. Abelson S, et al. Prediction of acute myeloid leukaemia risk in healthy individuals. Nature. 2018;559:400–404. - PMC - PubMed
    1. Gregson EM, Bornschein J, Fitzgerald RC. Genetic progression of Barrett’s oesophagus to oesophageal adenocarcinoma. Br J Cancer. 2016;115:403–410. - PMC - PubMed

Publication types

MeSH terms

LinkOut - more resources