. 2020 Oct;2(10):1025-1033.
doi: 10.1038/s42255-020-00275-6. Epub 2020 Sep 7.

Hypothalamic perineuronal net assembly is required for sustained diabetes remission induced by fibroblast growth factor 1 in rats

Affiliations

Hypothalamic perineuronal net assembly is required for sustained diabetes remission induced by fibroblast growth factor 1 in rats

Kimberly M Alonge et al. Nat Metab. 2020 Oct.

Abstract

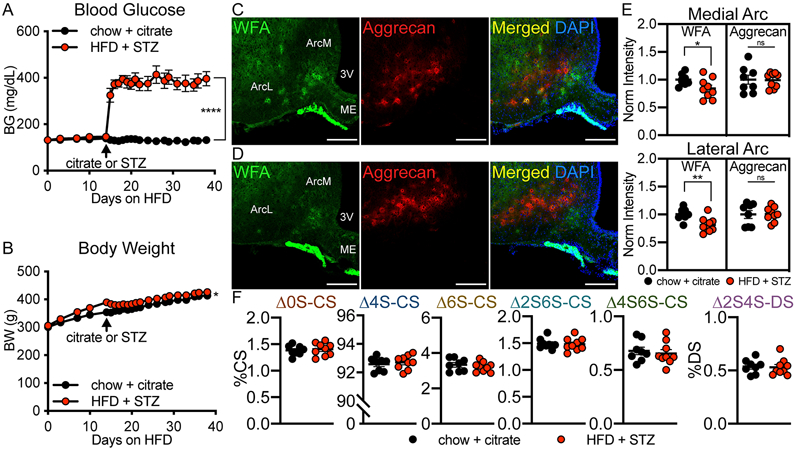
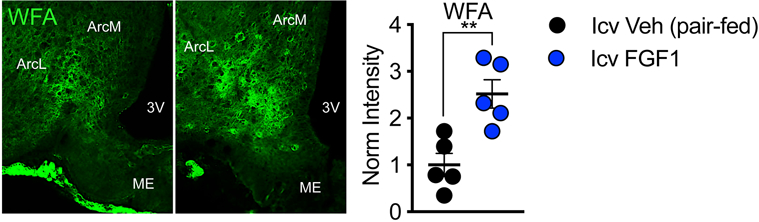
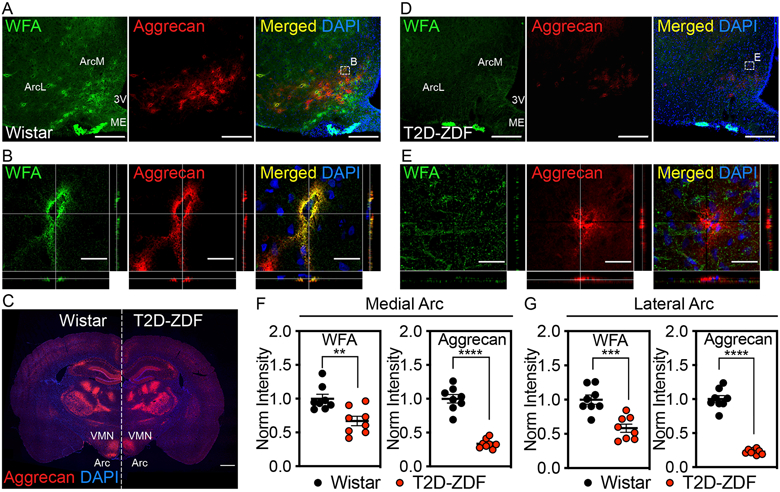
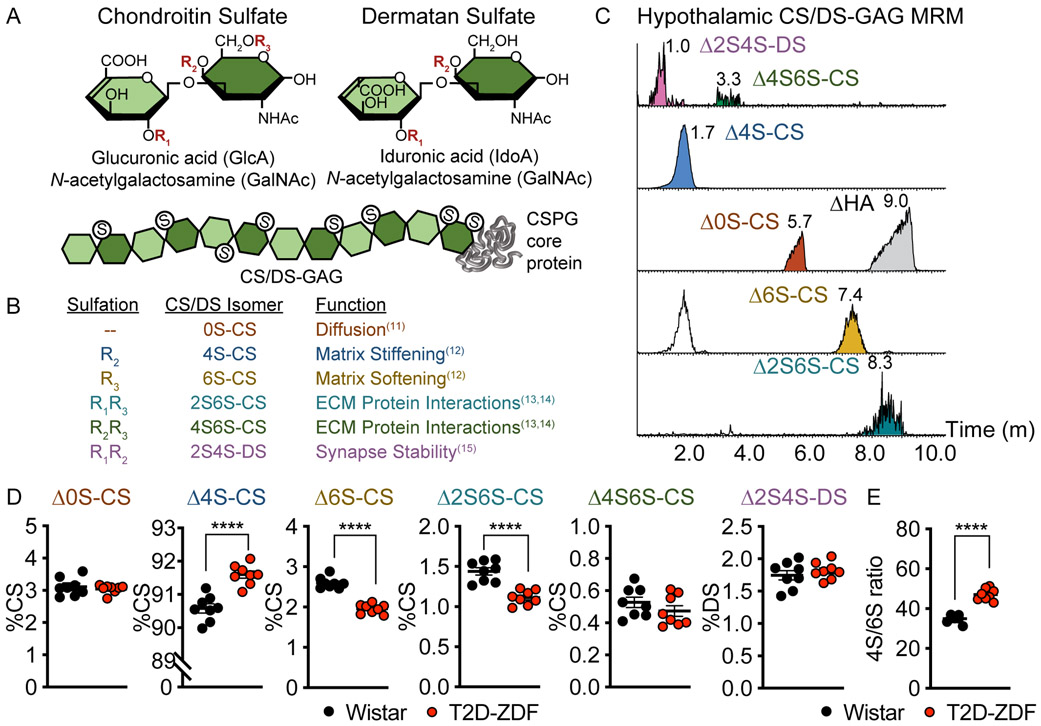
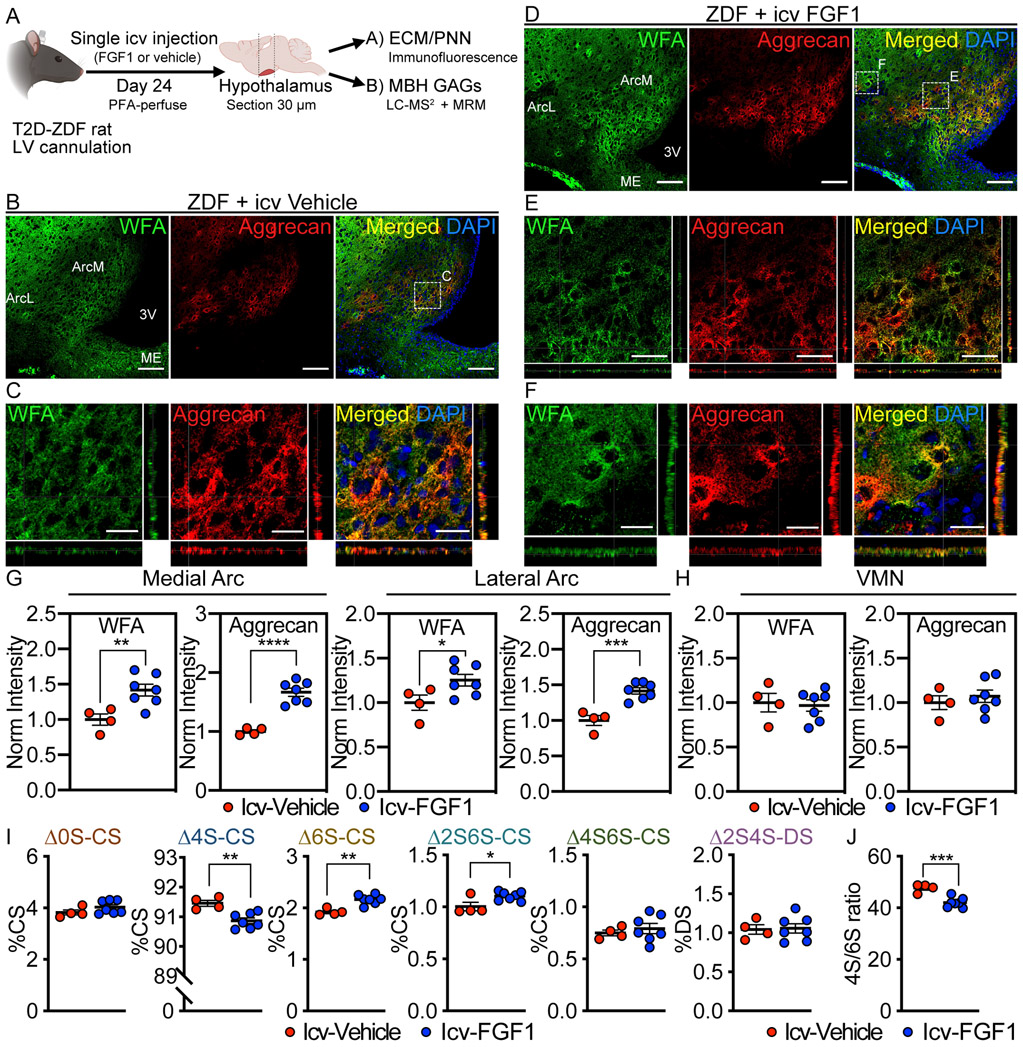
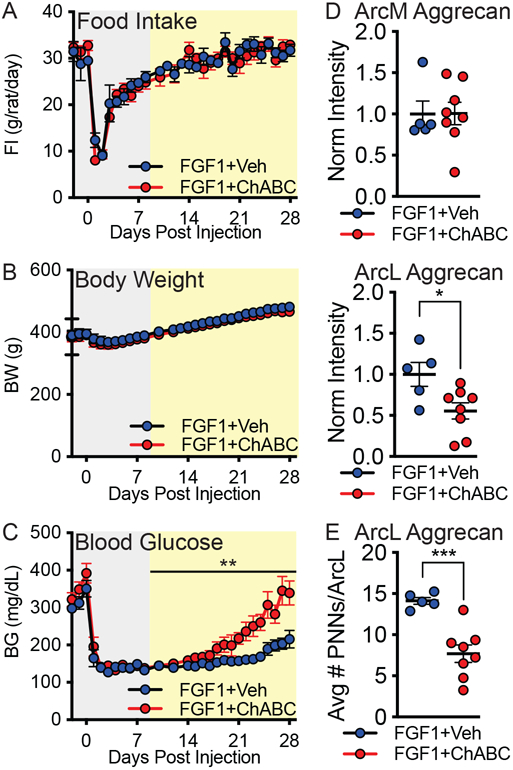
We recently showed that perineuronal nets (PNNs) enmesh glucoregulatory neurons in the arcuate nucleus (Arc) of the mediobasal hypothalamus (MBH)1, but whether these PNNs play a role in either the pathogenesis of type 2 diabetes (T2D) or its treatment remains unclear. Here we show that PNN abundance within the Arc is markedly reduced in the Zucker diabetic fatty (ZDF) rat model of T2D, compared with normoglycaemic rats, correlating with altered PNN-associated sulfation patterns of chondroitin sulfate glycosaminoglycans in the MBH. Each of these PNN-associated changes is reversed following a single intracerebroventricular (icv) injection of fibroblast growth factor 1 (FGF1) at a dose that induces sustained diabetes remission in male ZDF rats. Combined with previous work localizing this FGF1 effect to the Arc area2-4, our finding that enzymatic digestion of Arc PNNs markedly shortens the duration of diabetes remission following icv FGF1 injection in these animals identifies these extracellular matrix structures as previously unrecognized participants in the mechanism underlying diabetes remission induced by the central action of FGF1.


Conflict of interest statement

Conflict of Interest: Support to M.W.S. was partly funded by Novo Nordisk A/C. All other authors declare no conflict of interest.

Figures

Extended Data Fig. 1
Extended Data Fig. 1. Diabetic Wistar rats have reduced PNN CS-GAG structures in the arcuate nucleus.
Wistar rats were rendered diabetic by 2 wk of high fat diet (HFD) followed by a single injection of low-dose streptozotocin (STZ) (30 mg/kg sc) or citrate control and (A) blood glucose and (B) body weight were monitored for 24 d after treatment. Immunofluorescent detection of WFA (PNN CS-GAGs) and aggrecan (PNN CSPG) in coronal sections of rat hypothalamus (30 μm) from (C) normoglycemic citrate Wistar controls and (D) agematched, hyperglycemic HFD/STZ Wistar rats. Scale bar: 200 μm. (E) Quantification of the mean fluorescence intensity of PNNs averaged from medial hypothalamic sections (−2.2 to −2.8 mm posterior from bregma) for ArcM and ArcL areas from citrate and HFD/STZ Wistar rats and normalized to the citrate control mean fluorescence intensity averages. (F) HFD/STZ Wistar rats exhibit no change in the relative percentages of CS disaccharides compared to age-matched, citrate controls. In vivo manipulation (A-B), immunofluorescence analyses (C-E), and CS/DS-GAG LC-MS2 analyses were performed on the same cohort of rats (n=8-9 rats/group; mean ± SEM). *P < 0.05, **P < 0.01, ****P < 0.0001, versus citrate controls; (A-B) Linear mixed-effects model analysis with Geisser-Greenhouse correction, and (E-F) Student’s t-test (unpaired, two-sided); (A) p=<0.0001, (B) p=0.0364, (E) WFA, ArcL p=0.0061; WFA, ArcM p=0.0467. Arc, arcuate nucleus; ArcM, medial Arc; ArcL, lateral Arc; ME, median eminence; sc, subcutaneous; 3V, 3rd ventricle.
Extended Data Fig. 2
Extended Data Fig. 2. Effect of a single icv injection of FGF1 on Arc PNN assembly in Wistar rats.
Immunofluorescence imaging of Arc PNN CS-GAGs in Wistar rats 24 h after icv treatment with FGF1 (3 μg) or vehicle, where the vehicle treated controls were pair-fed to the FGF1 group. Quantification of the mean fluorescence intensity of PNNs averaged from medial hypothalamic sections for total Arc (Arc-M+L) areas (n=5 rats/group; mean ± SEM). **P < 0.01, compared to icv vehicle controls; Student’s t-test (unpaired, two-sided); (A) p=0.0046. Arc, arcuate nucleus; ME, median eminence; 3V, 3rd ventricle.
Figure 1.
Figure 1.. Diabetic ZDF rats have reduced PNN structures in the arcuate nucleus.
Immunofluorescent detection of WFA, a lectin that binds to the CS-GAG glycan component of PNNs, and aggrecan, a PNN-associated CSPG core protein, in coronal sections of rat hypothalamus (30 μm) from (A-C) normoglycemic Wistar controls and (C-E) age-matched, hyperglycemic ZDF rats. (A, D) Low-magnification view of WFA+ / aggrecan+ PNNs throughout the ArcM and ArcL areas of the mediobasal hypothalamus. Scale bar: 200 μm. (B, E) Higher-magnification orthogonal views of WFA+ / aggrecan+ PNN enmeshments. Scale bar: 25 μm. (C) Tiled panoramic image of aggrecan from a coronal section from a (left) normoglycemic Wistar control and a (right) age-matched diabetic ZDF rat shows selective loss of PNN labeling in the Arc of ZDF rats. Scale bar: 1 mm. Quantification of the mean fluorescence intensity of PNNs averaged from medial hypothalamic sections (−2.2 to −2.8 mm posterior from bregma) for (F) medial Arc and (G) lateral Arc areas from normoglycemic Wistar and diabetic ZDF rats and normalized to the Wistar mean fluorescence intensity averages (n=8 rats/group; mean ± SEM). **P < 0.01, ***P < 0.001, ****P < 0.0001 versus Wistar controls; Student’s t-test (unpaired, two-sided); (F) WFA-ArcM p=0.0.0036, aggrecan-ArcM p=<0.0001, WFA-ArcL p=0.0004, aggrecan-ArcL p=<0.0001. Two separate cohorts of diabetic ZDF and normoglycemic Wistar rats were analyzed, and the results were reproducible between studies. Arc, arcuate nucleus; ArcL, lateral Arc; ArcM, medial Arc; ME, median eminence; VMN, ventromedial nucleus; 3V, 3rd ventricle.
Figure. 2.
Figure. 2.. Diabetic ZDF rats exhibit abnormal hypothalamic CS/DS-GAG sulfation patterns.
(A) Schematic of chondroitin sulfate (CS) and dermatan sulfate (DS) sulfation positions. During biosynthesis, repeating CS disaccharide units can be nonsulfated (0S-S), monosulfated (4S- and 6S-CS), disulfated (2S6S- and 4S6S-CS) or epimerized and disulfated to produce dermatan sulfate (2S4S-DS). (B) The proportion of non-, mono-, and di-sulfated isomers influences the function of the underlying ECM / PNN matrices. (C-E) Isolation of CS/DS disaccharides from hyperglycemic ZDF and normoglycemic Wistar MBH tissue by ChABC can by quantitatively analyzed by LC-MS2 coupled with MRM analysis. (C) Representative MRM analysis of MBH CS/DS disaccharides from a normoglycemic Wistar rat identifies each isomer using specific channels. The release of hyaluronan (∆HA) by ChABC is also observed in the ∆0S-CS channel. (D) Diabetic ZDF rats exhibit changes in the relative percentages of ∆4S-, ∆6S-, and ∆2S6S-CS that alter the hypothalamic CS/DS-GAG sulfation pattern and the (E) 4S/6S CS ratio compared to age-matched, normoglycemic Wistar controls (n=8 rats/group; mean ± SEM); ****P < 0.0001 versus Wistar controls; Student’s t-test (unpaired, two-sided); (D) ∆4S-CS p=<0.0001, ∆6S-CS p=<0.0001, ∆2S6S-CS p=<0.0001; (E) p=<0.0001. ChABC, Chondroitinase ABC; LC, liquid chromatography; MBH, mediobasal hypothalamus; MRM, multiple reaction monitoring; MS2, tandem mass spectrometry.
Figure 3.
Figure 3.. Effect of a single icv injection of FGF1 on Arc PNN assembly and composition in ZDF rats.
(A) Schematic depicting time course for central FGF1 treatment and associated PNN matrix assembly and CS/DS-GAG sulfation pattern analysis. Immunofluorescent detection of WFA (CS-GAG) and aggrecan (CSPG) in coronal sections of rat hypothalamus (30 μm) from ZDF rats treated with (B-C) icv vehicle or (D-F) icv FGF1 (3 μg). (B, D) Low-magnification view of Arc PNNs. Scale bar: 100 μm. (C, E-F) Higher-magnification orthogonal views of PNN enmeshments in the Arc imaged with higher laser intensity to maximize sensitivity. Scale bars: (E) 50 μm (C, F) 25 μm. (G-H) Quantification of the mean fluorescence intensity of PNNs averaged from medial hypothalamic sections (−2.2 to −2.8 mm posterior from bregma) for (G) medial Arc and lateral Arc areas and (H) VMN from either icv vehicle or icv FGF1 treated ZDF rats, and normalized to the icv vehicle control group. (I-J) Icv FGF1 normalizes the MBH CS/DS-GAG (I) sulfation pattern and (J) 4S/6S CS ratio compared to icv vehicle controls. Immunofluorescence analyses (A-H) and CS/DS-GAG analyses (I-J) were performed on the same cohort of rats (n=4-7 rats/group; mean ± SEM); *P < 0.05, **P < 0.01, ***P < 0.001, ****P < 0.0001 versus icv vehicle controls; Student’s t-test (unpaired, two-sided); (G) WFA-ArcM p=0.0091, aggrecan-ArcM p=<0.0001, WFA-ArcL p=0.0436, aggrecan-ArcM p=0.0005; (I) ∆4S-CS p=0.0033, ∆6S-CS p=0.0013, ∆2S6S-CS p=0.0242; (J) p=0.0012. Two separate CS/DS-GAG isolations and mass spectrometry analyses were performed on the same cohort of icv vehicle vs icv FGF1 treated ZDF rats, and results were reproduced. Arc, arcuate nucleus; ArcL, lateral Arc; ArcM, medial Arc; MBH, mediobasal hypothalamus; ME, median eminence; VMN, ventromedial nucleus; 3V, 3rd ventricle.
Figure 4.
Figure 4.. Impact of Chondroitinase ABC digestion of Arc PNNs on sustained blood glucose lowering induced by icv FGF1.
ZDF rats were treated with icv FGF1 targeting the lateral ventricle, followed immediately by a bilateral microinjection of ChABC or heat-inactivated ChABC (vehicle) targeting the MBH within the same surgical session. Levels of (A) food intake, (B) body weight, and (C) blood glucose were measured daily for 28 d following the surgical intervention. Data were analyzed separately for the acute-phase (gray) and post-acute phase (yellow) response to FGF1 treatment, since the former is known to be driven largely by reduced food intake. (D) Quantification of mean aggrecan fluorescence intensity in medial Arc and lateral Arc regions of the MBH (−2.2 to −2.4 mm posterior from bregma) and normalized to the hypothalamic average for the vehicle control group. (E) Quantification of the total number of aggrecan+ PNN matrices in the lateral Arc region averaged from medial hypothalamic sections. In vivo manipulation (A-C) and immunofluorescence analyses (D-E) were performed on the same cohort of rats (n=5-9 rats/group; mean ± SEM). Statistics: *P < 0.05, **P < 0.01, ****P < 0.0001; (D-E) Student’s t-test (unpaired, two-sided); (D) p=0.0242, (E) p=0.0008. (A-C) Group comparisons were analyzed using AUC and the change over time, and post-acute blood glucose time series data were analyzed using a random intercept and slope linear mixed model (please see Statistical Analysis for complete details); (C) p=0.009. Arc, arcuate nucleus; ArcL, lateral Arc; ArcM, medial Arc; BG, blood glucose; BW, body weight; FI, food intake.

Comment in

References

    1. Mirzadeh Z, et al. Perineuronal net formation during the critical period for neuronal maturation in the hypothalamic arcuate nucleus. Nat Metab 1, 212–221 (2019). - PMC - PubMed
    1. Scarlett JM, et al. Central injection of fibroblast growth factor 1 induces sustained remission of diabetic hyperglycemia in rodents. Nat Med 22, 800–806 (2016). - PMC - PubMed
    1. Scarlett JM, et al. Peripheral Mechanisms Mediating the Sustained Antidiabetic Action of FGF1 in the Brain. Diabetes 68, 654–664 (2019). - PMC - PubMed
    1. Brown JM, et al. The Hypothalamic Arcuate Nucleus-Median Eminence is a Target for Sustained Diabetes Remission Induced by Fibroblast Growth Factor 1. Diabetes, db190025 (2019). - PMC - PubMed
    1. Blumcke I, Eggli P & Celio MR Relationship between astrocytic processes and “perineuronal nets” in rat neocortex. Glia 15, 131–140 (1995). - PubMed

Methods References

    1. Wang X, et al. Variability in Zucker diabetic fatty rats: differences in disease progression in hyperglycemic and normoglycemic animals. Diabetes Metab Syndr Obes 7, 531–541 (2014). - PMC - PubMed
    1. Slaker ML, Harkness JH & Sorg BA A standardized and automated method of perineuronal net analysis using Wisteria floribunda agglutinin staining intensity. IBRO Reports 1, 54–60 (2016). - PMC - PubMed
    1. Elias CF, et al. Leptin Differentially Regulates NPY and POMC Neurons Projecting to the Lateral Hypothalamic Area. Neuron 23, 775–786 (1999). - PubMed
    1. Elias CF, et al. Chemical characterization of leptin-activated neurons in the rat brain. J Comp Neurol 423, 261–281 (2000). - PubMed
    1. Schindelin J, et al. Fiji: an open-source platform for biological-image analysis. Nat Methods 9, 676–682 (2012). - PMC - PubMed

Publication types

MeSH terms