. 2021 Jan 1:244:117834.
doi: 10.1016/j.atmosenv.2020.117834. Epub 2020 Sep 3.

The contribution of global aviation to anthropogenic climate forcing for 2000 to 2018

Affiliations

The contribution of global aviation to anthropogenic climate forcing for 2000 to 2018

D S Lee et al. Atmos Environ (1994). .

Abstract

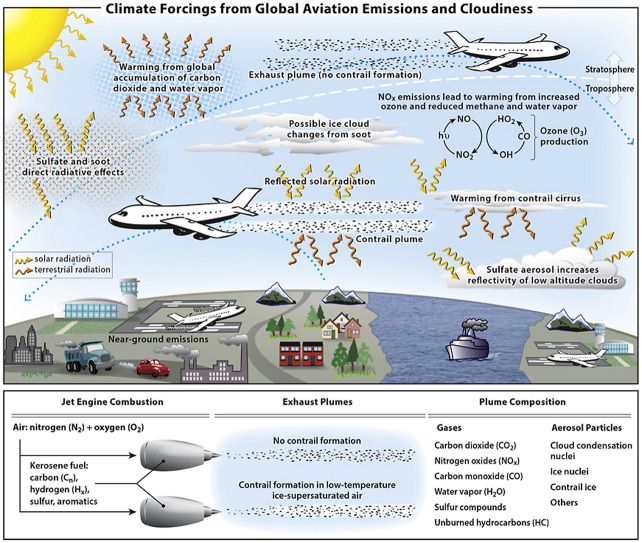
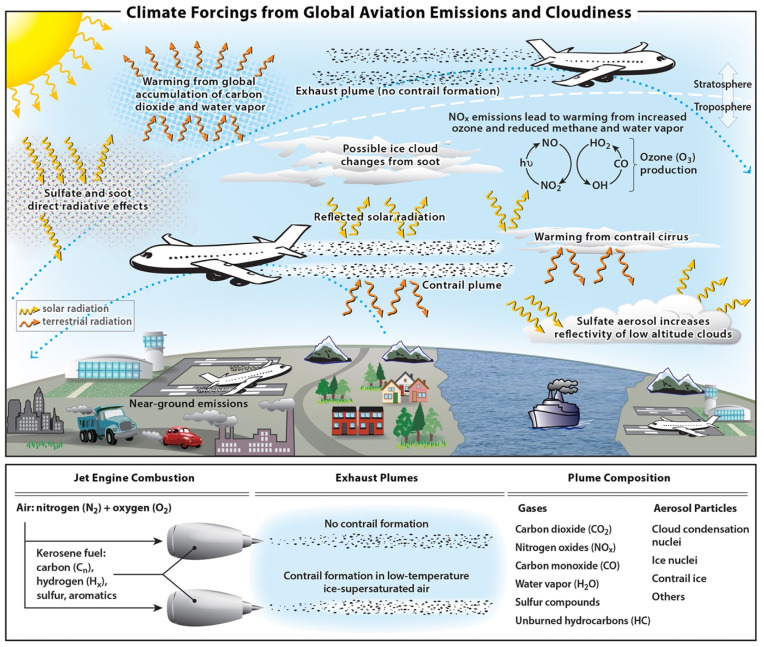
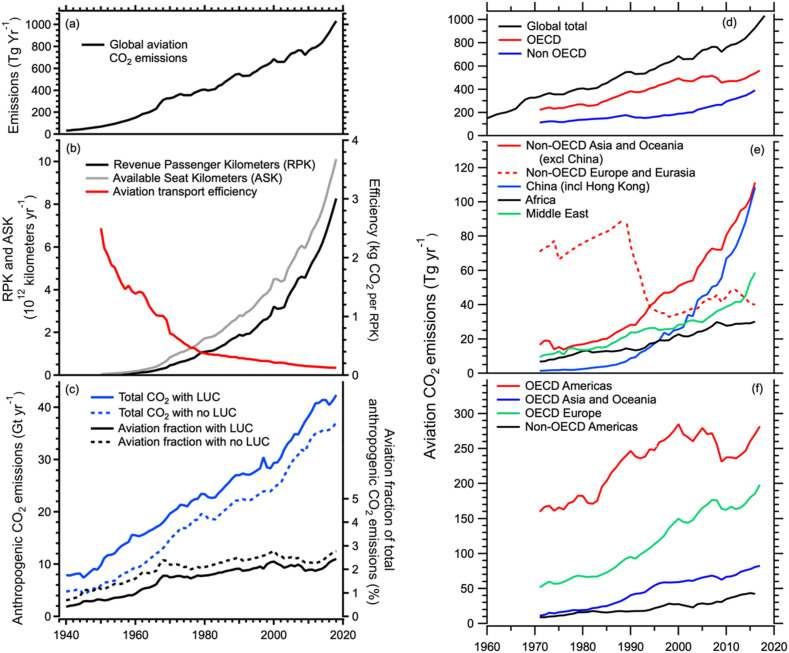
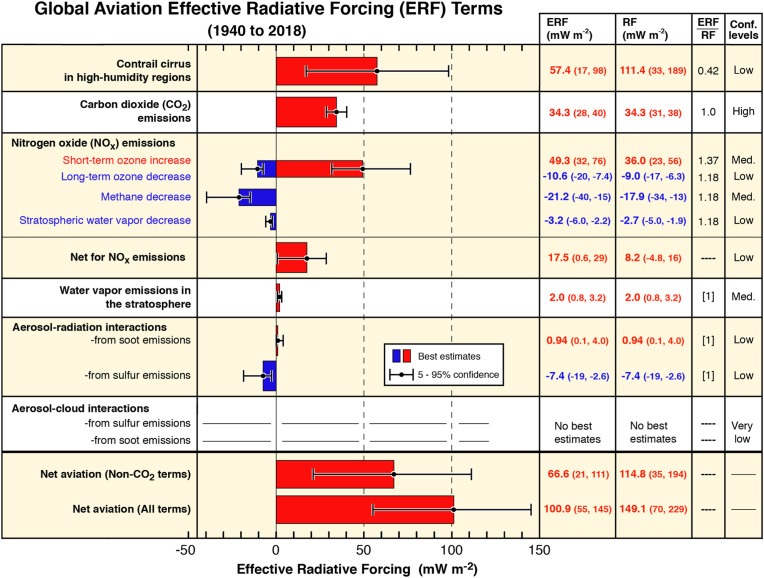
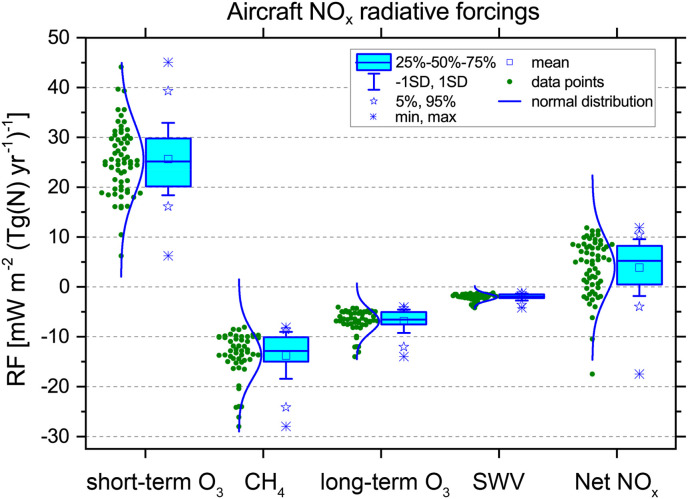
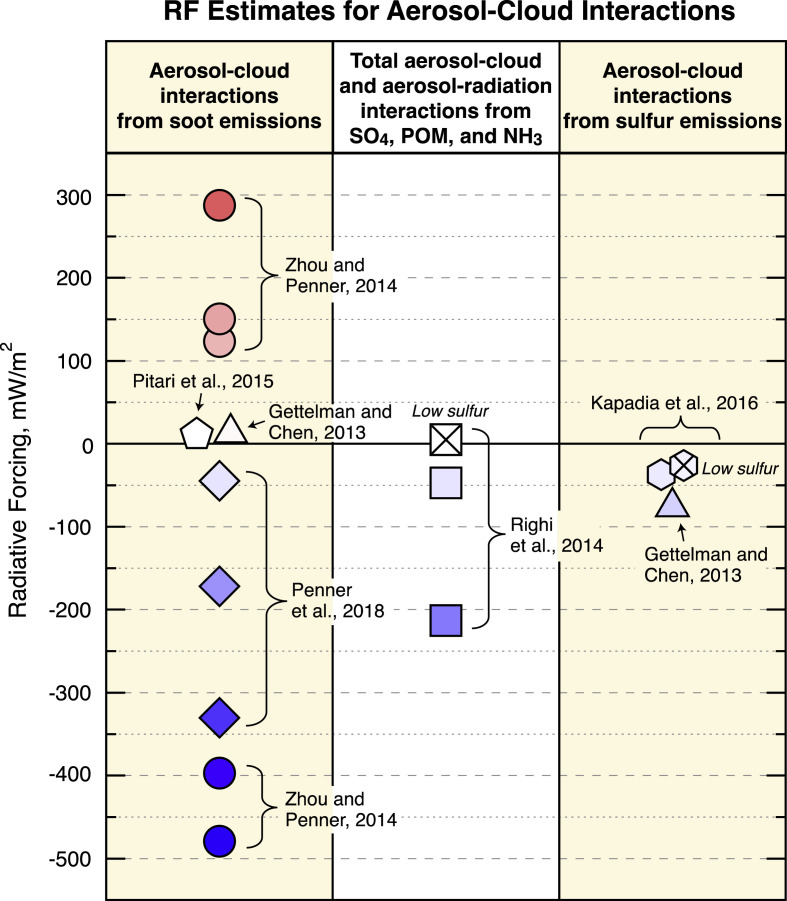
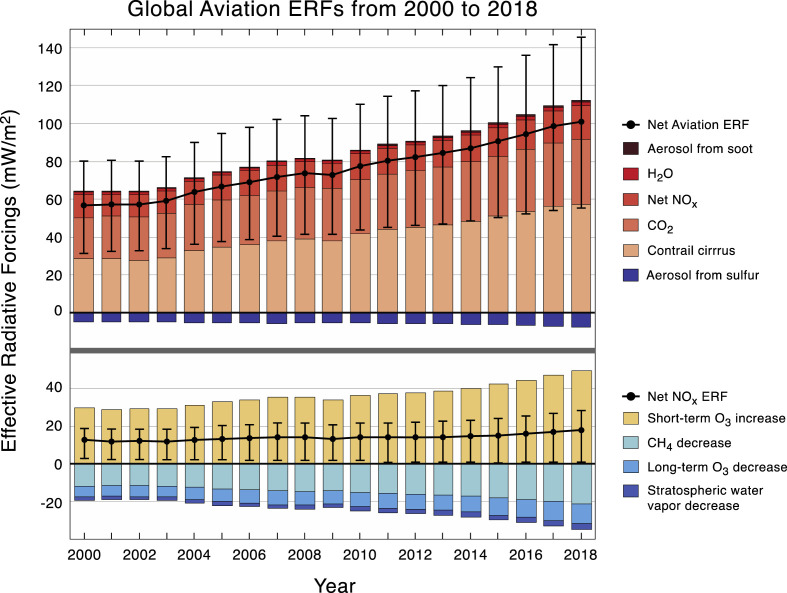
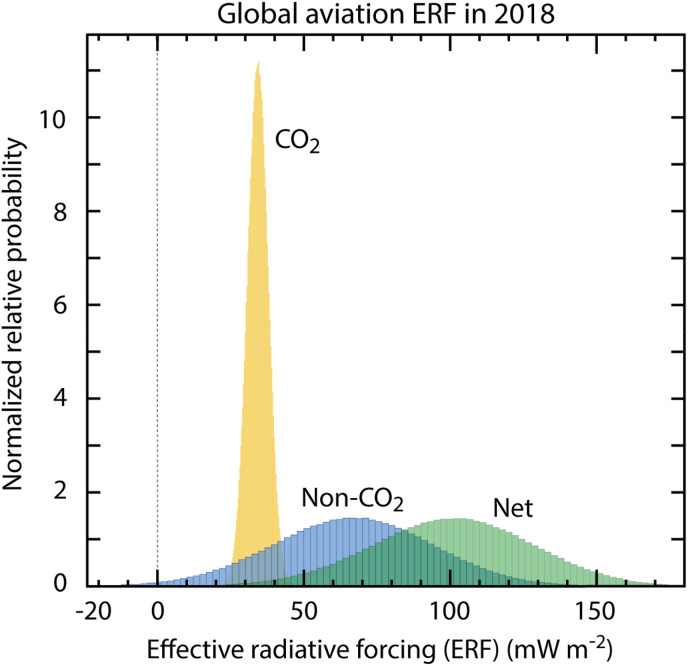
Global aviation operations contribute to anthropogenic climate change via a complex set of processes that lead to a net surface warming. Of importance are aviation emissions of carbon dioxide (CO2), nitrogen oxides (NOx), water vapor, soot and sulfate aerosols, and increased cloudiness due to contrail formation. Aviation grew strongly over the past decades (1960-2018) in terms of activity, with revenue passenger kilometers increasing from 109 to 8269 billion km yr-1, and in terms of climate change impacts, with CO2 emissions increasing by a factor of 6.8 to 1034 Tg CO2 yr-1. Over the period 2013-2018, the growth rates in both terms show a marked increase. Here, we present a new comprehensive and quantitative approach for evaluating aviation climate forcing terms. Both radiative forcing (RF) and effective radiative forcing (ERF) terms and their sums are calculated for the years 2000-2018. Contrail cirrus, consisting of linear contrails and the cirrus cloudiness arising from them, yields the largest positive net (warming) ERF term followed by CO2 and NOx emissions. The formation and emission of sulfate aerosol yields a negative (cooling) term. The mean contrail cirrus ERF/RF ratio of 0.42 indicates that contrail cirrus is less effective in surface warming than other terms. For 2018 the net aviation ERF is +100.9 milliwatts (mW) m-2 (5-95% likelihood range of (55, 145)) with major contributions from contrail cirrus (57.4 mW m-2), CO2 (34.3 mW m-2), and NOx (17.5 mW m-2). Non-CO2 terms sum to yield a net positive (warming) ERF that accounts for more than half (66%) of the aviation net ERF in 2018. Using normalization to aviation fuel use, the contribution of global aviation in 2011 was calculated to be 3.5 (4.0, 3.4) % of the net anthropogenic ERF of 2290 (1130, 3330) mW m-2. Uncertainty distributions (5%, 95%) show that non-CO2 forcing terms contribute about 8 times more than CO2 to the uncertainty in the aviation net ERF in 2018. The best estimates of the ERFs from aviation aerosol-cloud interactions for soot and sulfate remain undetermined. CO2-warming-equivalent emissions based on global warming potentials (GWP* method) indicate that aviation emissions are currently warming the climate at approximately three times the rate of that associated with aviation CO2 emissions alone. CO2 and NOx aviation emissions and cloud effects remain a continued focus of anthropogenic climate change research and policy discussions.

Keywords: Aviation; CO2; Climate; Contrail cirrus; NOx; Radiative forcing.


Conflict of interest statement

The authors declare that they have no known competing financial interests or personal relationships that could have appeared to influence the work reported in this paper.

Figures

Image 1
Graphical abstract
Fig. 1
Fig. 1
Schematic overview of the processes by which aviation emissions and increased cirrus cloudiness affect the climate system. Net positive RF (warming) contributions arise from CO2, water vapor, NOx, and soot emissions, and from contrail cirrus (consisting of linear contrails and the cirrus cloudiness arising from them). Negative RF (cooling) contributions arise from sulfate aerosol production. Net warming from NOx emissions is a sum over warming (short-term ozone increase) and cooling (decreases in methane and stratospheric water vapor, and a long-term decrease in ozone) terms. Net warming from contrail cirrus is a sum over the day/night cycle. These contributions involve a large number of chemical, microphysical, transport and, radiative processes in the global atmosphere. The quantitative ERF values associated with these processes are shown in Fig. 3 for 2018.
Fig. 2
Fig. 2
Data related to the growth of aviation traffic and CO2 emissions from 1940 to 2018. Panel (a): Global aviation CO2 emissions. Underlying fuel usage data for 1940 to 1970 are derived from Sausen and Schumann (2000) and for 1970–2016 from International Energy Agency (UKDS, 2016) data, which include international bunker fuels. For 2017/18, the values are scaled from information from the International Air Transport Association (see Appendix A). The average annual increase of global emissions from 1960 to 2018 is 15 Tg CO2 yr−1 and the corresponding decadal average growth rates are 8.0, 2.2, 3.0, 2.3 and 1.1% yr−1, yielding an overall average of 3.3% yr−1. Panel (b): Global aviation traffic in RPK and ASK from airlines.org (http://airlines.org/dataset/world-airlines-traffic-and-capacity/), and the transport efficiency of global aviation in kg CO2 per RPK. The passenger load factor defined as RPK/ASK increased from about 60% in 1960 to 82% in 2018. Panel (c): Total anthropogenic CO2 emissions and the aviation fractions of this total with and without the inclusion of CO2 emissions from land use change (LUC) from the Global Carbon Budget 2018 (Le Quéré, 2018). Panel (d)–(f): Additional aviation emissions data by region and year. The yearly sums of OECD and non-OECD values in (d) equal the respective global total values. The regional values in (e) and (f) also sum to equal the yearly global total values. Note different vertical scales (http://www.oecd.org/about/membersandpartners/) (UKDS, 2016) (Country listings in SD Spreadsheet).
Fig. 3
Fig. 3
Best-estimates for climate forcing terms from global aviation from 1940 to 2018. The bars and whiskers show ERF best estimates and the 5–95% confidence intervals, respectively. Red bars indicate warming terms and blue bars indicate cooling terms. Numerical ERF and RF values are given in the columns with 5–95% confidence intervals along with ERF/RF ratios and confidence levels. ERF and RF values are shown for other years in Table 2, Table 3, Fig. 6 and the SD spreadsheet. RF values are multiplied by the respective ERF/RF ratio to yield ERF values. ERF/RF values designated as [1] indicate that no estimate is available yet. The basis for confidence levels is presented in Table 4b, Table 4a.
Fig. 4
Fig. 4
Results from an ensemble of 18 models from 20 studies for aviation NOx impacts: short-term O3 increases; CH4 reductions, CH4-induced long-term reductions of O3, CH4-induced reductions of stratospheric water vapor (SWV) and Net NOx. Each data point represents a value of RF per unit emission (mW m−2 (Tg N yr−1)−1) as normalized from a published study (see SD). CH4-induced O3 and SWV are calculated using standardized methodology (see text for details). Note that the displayed values do not include correction factors to account for the non-steady-state CH4 responses to NOx emissions and the new CH4 RF parameterization. These adjustments are applied in forming the best estimates as discussed in Appendix D.
Fig. 5
Fig. 5
Summary of RF estimates for aerosol-cloud interactions for aviation aerosol as calculated in the SD spreadsheet for a variety of published results normalized to 2018 air traffic and 600 ppm fuel sulfur. The results are shown for soot; total particulate organic matter (POM), sulfate and ammonia (NH3); and sulfate aerosol from the indicated studies. The color shading gradient in the symbols indicates increasing positive or negative magnitudes. No best estimate was derived in the present study for any aerosol-cloud effect due to the large uncertainties. In previous studies, the estimates for the soot aerosol-cloud effect are associated with particularly large uncertainty in magnitude and uncertainty in the sign of the effect (Penner et al., 2009, 2018; Zhou and Penner, 2014). As part of the present study, an author (JEP) re-evaluated these earlier studies and concluded that the Penner et al. (2018) results supersede the earlier Penner et al. (2009) and Zhou and Penner (2014) results because of assumptions regarding updraft velocities during cloud formation. In addition, a bounding sensitivity case in which all aviation soot acts as an IN in Penner et al. (2018) is not included here.
Fig. 6
Fig. 6
Timeseries of calculated ERF values and confidence intervals for annual aviation forcing terms from 2000 to 2018. The top panel shows all ERF terms and the bottom panel shows only the NOx terms and net NOx ERF. All values are available in the SD spreadsheet, in Table 2, Table 3, and in Fig. 3 for 2018 values. The net values are not arithmetic sums of the annual values because the net ERF, as shown in Fig. 3 for 2018, requires a Monte Carlo analysis that properly includes uncertainty distributions and correlations (see text).
Fig. 7
Fig. 7
Probability distribution functions (PDFs) for aviation ERFs in 2018 based on the results in Fig. 3 and Table 2. PDFs are shown for separately for CO2, the sum of non-CO2 terms, and the net aviation ERF. Since the area of each distribution is normalized to the same value, relative probabilities can be intercompared. Uncertainties are expressed by a distribution about the best-estimate value that is normal for CO2 and contrail cirrus, and lognormal for all other components. A one-million-point Monte Carlo simulation run was used to calculate all PDFs.
Fig. D.1
Fig. D.1
Matrix of pair-wise scatter plots of RF values from NOx terms: short-term O3, CH4, CH4-induced O3, SWV and net NOx (i.e., the sum of all 4 components), all represented as normalized RFs (mW m−2 (Tg(N)yr−1)−1) from the ensemble studies (see details in text). The red line is the linear fit, the ellipse shows the 95% confidence level and histograms present frequencies.
Fig. D.2
Fig. D.2
(a) Past and future anthropogenic emissions of CO, CH4, NOx, NMVOC, N2O and aircraft NOx (IIASA RCP Database: http://www.iiasa.ac.at/web-apps/tnt/RcpDb/). Dots represent conditions for ‘constant 2000’ and ‘constant 2050’ simulations. (b) Evolution of the global CH4 burden in TROPOS for transient aircraft NOx emissions combining historical emissions (1950–2000) and RCP-4.5 emissions (2000–2050); and constant emissions for the years 2000 and 2050. (c) Global CH4 lifetime due to aircraft NOx emissions in TROPOS for transient emissions combining historical emissions (1950–2000) and RCP-4.5 emissions (2000–2050); and constant emissions for the years 2000 and 2050. (d) Global CH4 lifetime reduction due to aircraft NOx emissions in TROPOS for transient emissions combining historical emissions (1950–2000) and RCP-4.5 emissions (2000–2050); and constant emissions for the years 2000 and 2050. The dashed lines represent 2000 and 2050 equilibrium values (light and dark blue) and 2000 and 2050 transient values (red). (e) Global CH4 burden reduction due to aircraft NOx emissions in TROPOS for transient emissions combining historical emissions (1950–2000) and RCP-4.5 emissions (2000–2050); and constant emissions for the years 2000 and 2050. The dashed lines represent 2000 and 2050 equilibrium values (light and dark blue) and 2000 and 2050 transient values (red). (f) Global CH4 burden reduction due to aircraft NOx emissions in TROPOS for transient emissions combining historical emissions (1950–2000) and RCP-4.5 emissions (2000–2050); and constant emissions for the year 2018. The dashed lines represent 2018 equilibrium (green) and transient values (red).

References

    1. Airbus . 2017. Global Market Forecast 2017–2036. Airbus, France.
    1. Allen M.R., Fuglestvedt J.S., Shine K.P., Reisinger A., Pierrehumbert R.T., Forster P.M. New use of global warming potentials to compare cumulative and short¬lived climate pollutants. Nat. Clim. Change. 2016;6(8):773–776. doi: 10.1038/nclimate2998. - DOI
    1. Allen M.R., Shine K.P., Fuglestvedt J.S., Millar R.J., Cain M., Frame D.J., Macey A.H. A solution to the misrepresentations of CO2-equivalent emissions of short-lived climate pollutants under ambitious mitigation. npj Clim. Atmos. Sci. 2018;1 doi: 10.1038/s41612-018-0026-8. 16. - DOI
    1. Agarwal A., Speth R.L., Fritz T.M., Jacob S.D., Rindlisbacher T., Iovinelli R., Owen B., Miake-Lye R.C., Sabnis J.S., Barrett S.R.H. SCOPE11 method for estimating aircraft black carbon mass and particle number emissions. Environ. Sci. Technol. 2019;53:1364–1373. doi: 10.1021/acs.est.8b04060. - DOI - PubMed
    1. Alfsen K.H., Berntsen T. An efficient and accurate carbon cycle model for use in simple climate mdels. https://core.ac.uk/reader/52082516 CICERO, Oslo, Norway.