. 2020 Jul 15;20(4):e34.
doi: 10.4110/in.2020.20.e34. eCollection 2020 Aug.

Effects of Cryopreservation and Thawing on Single-Cell Transcriptomes of Human T Cells

Affiliations

Effects of Cryopreservation and Thawing on Single-Cell Transcriptomes of Human T Cells

Jeong Seok Lee et al. Immune Netw. .

Abstract

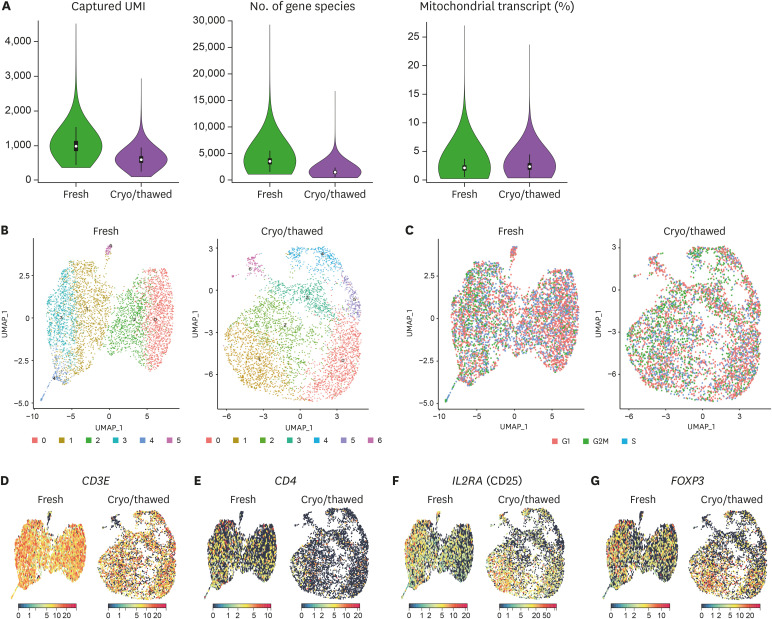
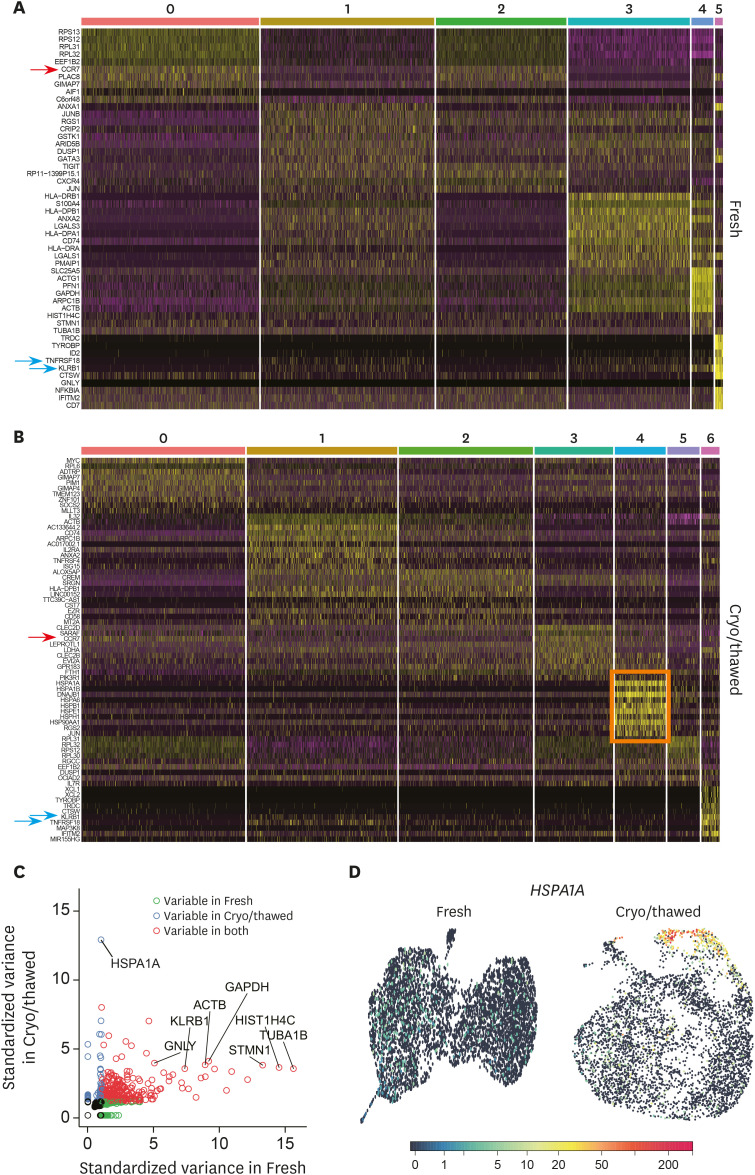
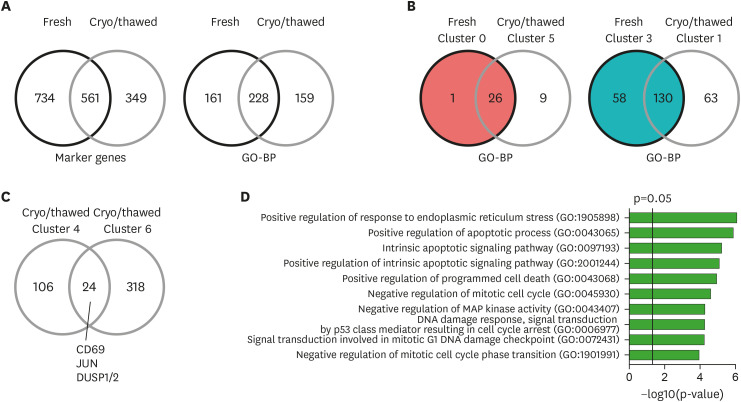
Cryopreservation and thawing of PBMCs are inevitable processes in expanding the scale of experiments in human immunology. Here, we carried out a fundamental study to investigate the detailed effects of PBMC cryopreservation and thawing on transcriptomes. We sorted Tregs from fresh and cryopreserved/thawed PBMCs from an identical donor and performed single-cell RNA-sequencing (scRNA-seq). We found that the cryopreservation and thawing process minimally affects the key molecular features of Tregs, including FOXP3. However, the cryopreserved and thawed sample had a specific cluster with up-regulation of genes for heat shock proteins. Caution may be warranted in interpreting the character of any cluster of cells with heat shock-related properties when cryopreserved and thawed samples are used for scRNA-seq.

Keywords: Cryopreservation; Single-cell analysis; T-lymphocytes, regulatory; Transcriptome.


Conflict of interest statement

Conflict of Interest: The authors declare no potential conflicts of interest.

Figures

Figure 1
Figure 1. Single-cell transcriptome of Tregs from fresh and cryopreserved/thawed PBMCs. (A) Assessment of the quality of scRNA-seq results. Captured UMI (left), number of gene species (middle), and proportion of mitochondrial transcript (right) in the fresh sample and cryopreserved/thawed sample. Data are given as the median value and 1st–3rd quartile range for each parameter. (B) UMAPs of 4,990 cells for the fresh sample and 4,495 cells for the cryopreserved/thawed sample, colored by cluster. (C) Normalized expression of cell cycle genes on UMAP plots, colored by stage of the cell cycle. (D-G) Normalized expression of representative marker genes from Tregs on UMAP plots. CD3E (CD3) (D), CD4 (E), IL2RA (CD25) (F), and FOXP3 (FoxP3) (G).
Figure 2
Figure 2. Cluster-specific up-regulated genes in fresh and cryopreserved/thawed cells. (A) Heatmaps presenting up-regulated genes from each cluster for the fresh sample and (B) the cryopreserved/thawed sample. The arrows indicate the commonly up-regulated genes in the clusters from both fresh and cryopreserved/thawed samples. The pink box indicates cluster 4 in the cryopreserved/thawed sample, with multiple up-regulated heat shock protein genes. (C) Plots of the variable genes from the fresh or cryopreserved/thawed samples, or both. (D) UMAP plot of the representative expression pattern for HSPA1A.
Figure 3
Figure 3. Identification of unique transcriptional signatures in cryopreserved/thawed cells. (A) Venn diagram of marker genes up-regulated in any cluster (left), and of GO-BP enriched in any cluster (right) from the fresh and cryopreserved/thawed cells. (B) Venn diagrams of gene expression similarities between cluster 0 of the fresh sample and cluster 5 of the cryopreserved/thawed sample (left), and between cluster 3 of the fresh sample and cluster 1 of the cryopreserved/thawed sample (right) based on the enriched GO-BP. (C) Venn diagram of marker genes up-regulated in clusters 4 and 6 in the cryopreserved/thawed cells. (D) Bar plot showing enrichment p-values for the top 10 GO-BP enriched in commonly up-regulated genes (n=24) from both cluster 4 and 6 in the cryopreserved/thawed cells.

References

    1. Cossarizza A, Chang HD, Radbruch A, Akdis M, Andrä I, Annunziato F, Bacher P, Barnaba V, Battistini L, Bauer WM, et al. Guidelines for the use of flow cytometry and cell sorting in immunological studies. Eur J Immunol. 2017;47:1584–1797. - PMC - PubMed
    1. Whitcomb BW, Perkins NJ, Albert PS, Schisterman EF. Treatment of batch in the detection, calibration, and quantification of immunoassays in large-scale epidemiologic studies. Epidemiology. 2010;21(Suppl 4):S44–S50. - PMC - PubMed
    1. Kim CG, Jang M, Kim Y, Leem G, Kim KH, Lee H, Kim TS, Choi SJ, Kim HD, Han JW, et al. VEGF-A drives TOX-dependent T cell exhaustion in anti-PD-1-resistant microsatellite stable colorectal cancers. Sci Immunol. 2019;4:eaay0555. - PubMed
    1. Kim HD, Song GW, Park S, Jung MK, Kim MH, Kang HJ, Yoo C, Yi K, Kim KH, Eo S, et al. Association between expression level of PD1 by tumor-infiltrating CD8(+) T cells and features of hepatocellular carcinoma. Gastroenterology. 2018;155:1936–1950.e17. - PubMed
    1. Barcelo H, Faul J, Crimmins E, Thyagarajan B. A practical cryopreservation and staining protocol for immunophenotyping in population studies. Curr Protoc Cytom. 2018;84:e35. - PMC - PubMed