. 2020 Dec;9(4):454-487.
doi: 10.1016/j.hlpt.2020.08.019. Epub 2020 Sep 3.

The COVID-19 pandemic in Italy: Policy and technology impact on health and non-health outcomes

Affiliations

The COVID-19 pandemic in Italy: Policy and technology impact on health and non-health outcomes

Chiara Berardi et al. Health Policy Technol. 2020 Dec.

Abstract

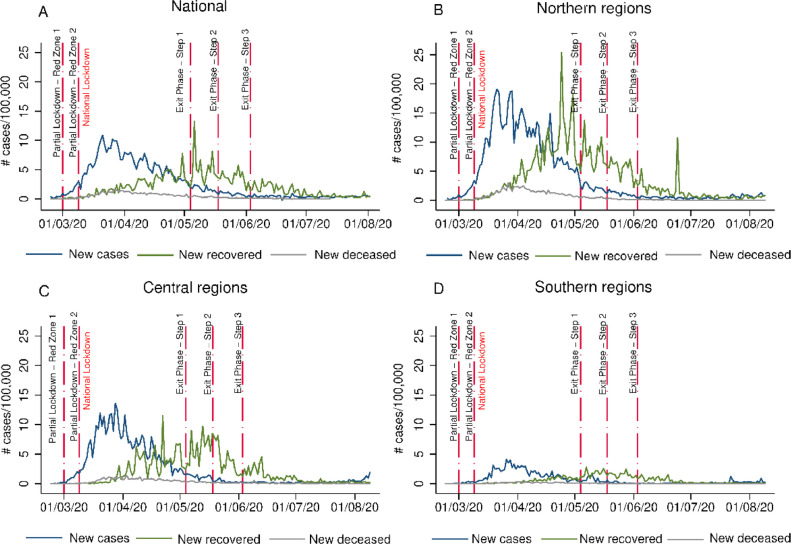
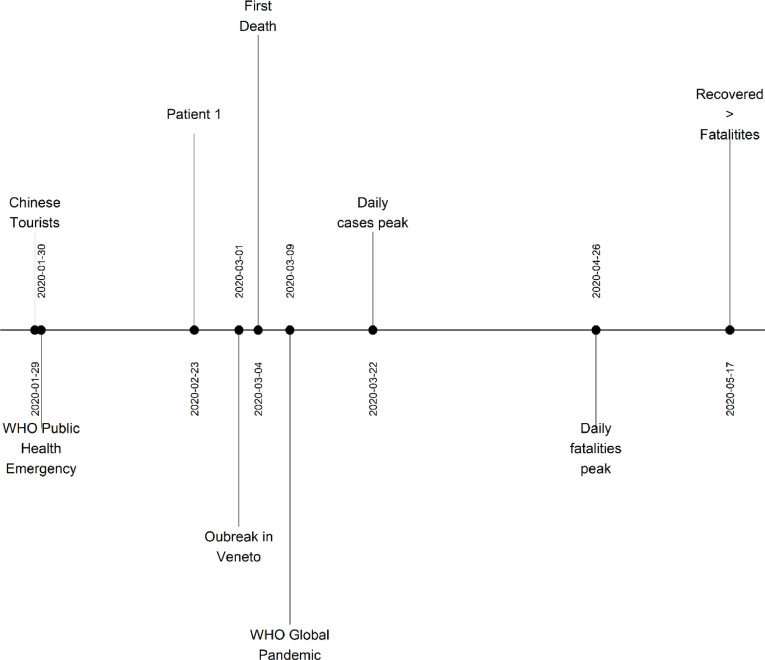
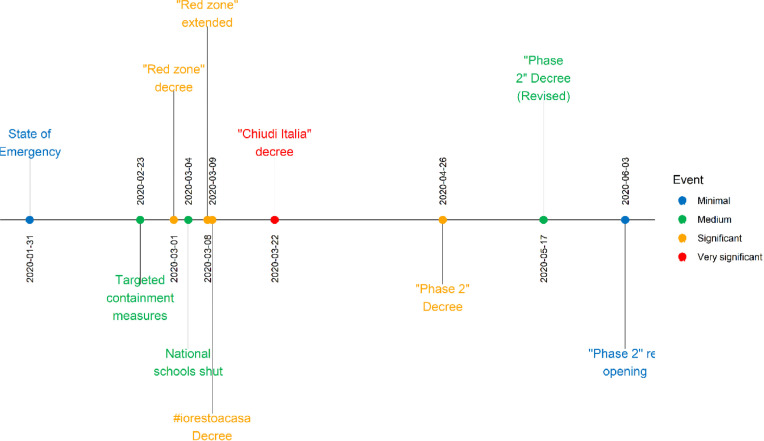
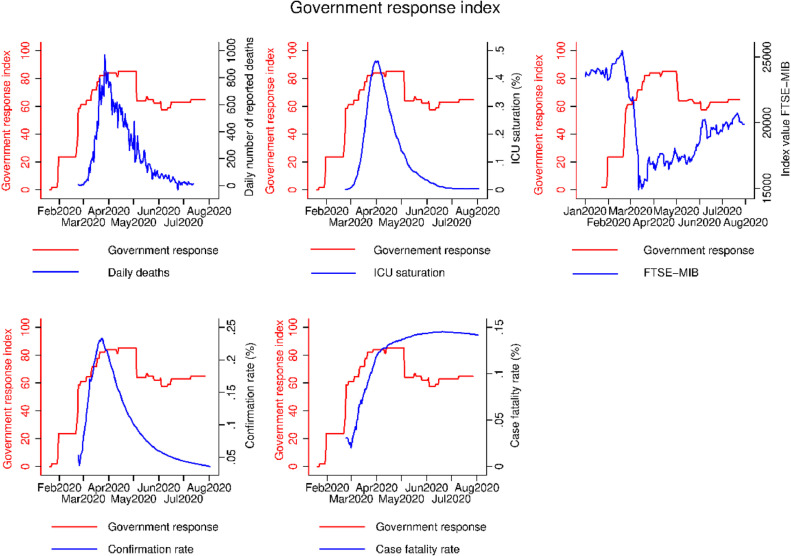
Background: Italy was the first Western country to experience a major coronavirus outbreak and consequently faced large-scale health and socio-economic challenges. The Italian government enforced a wide set of homogeneous interventions nationally, despite the differing incidences of the virus throughout the country.

Objective: The paper aims to analyse the policies implemented by the government and their impact on health and non-health outcomes considering both scaling-up and scaling-down interventions.

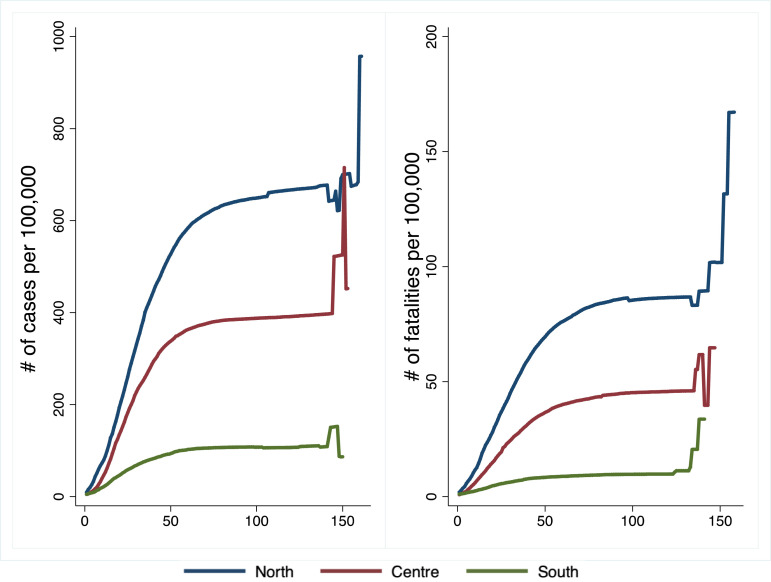
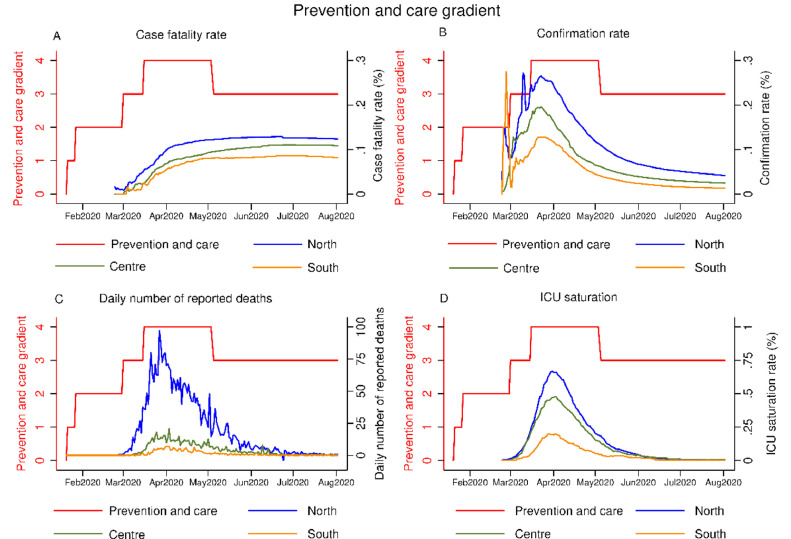
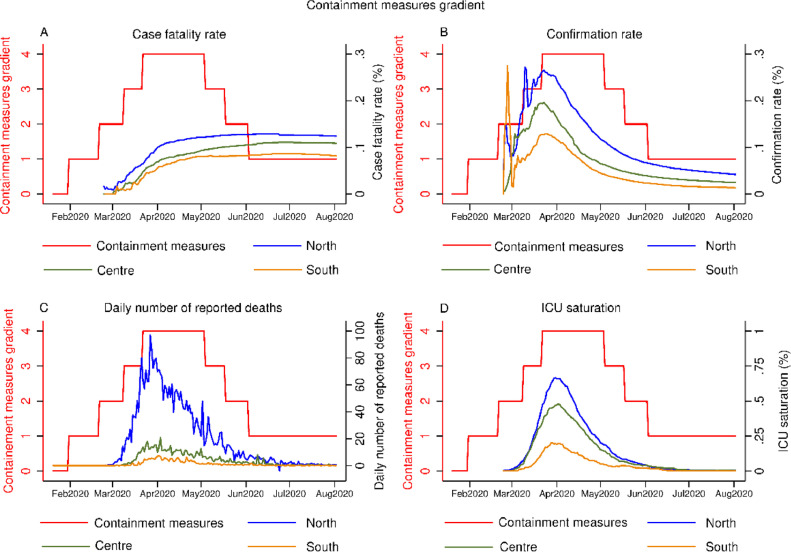
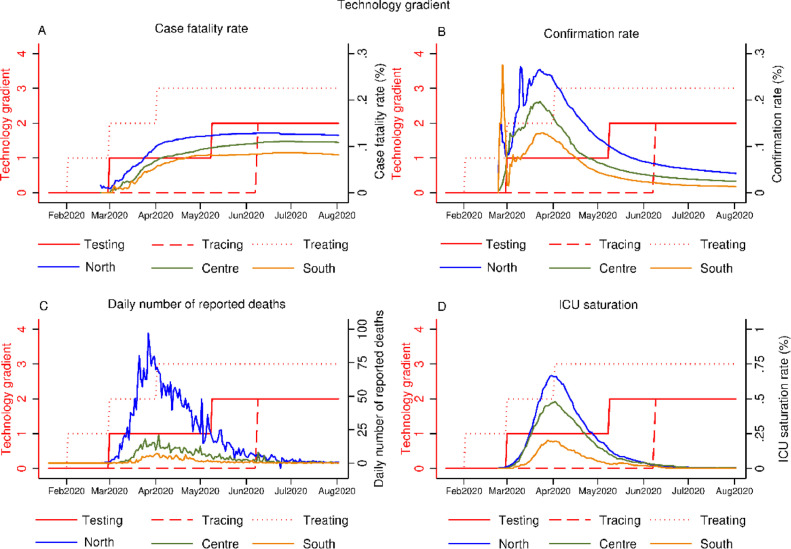
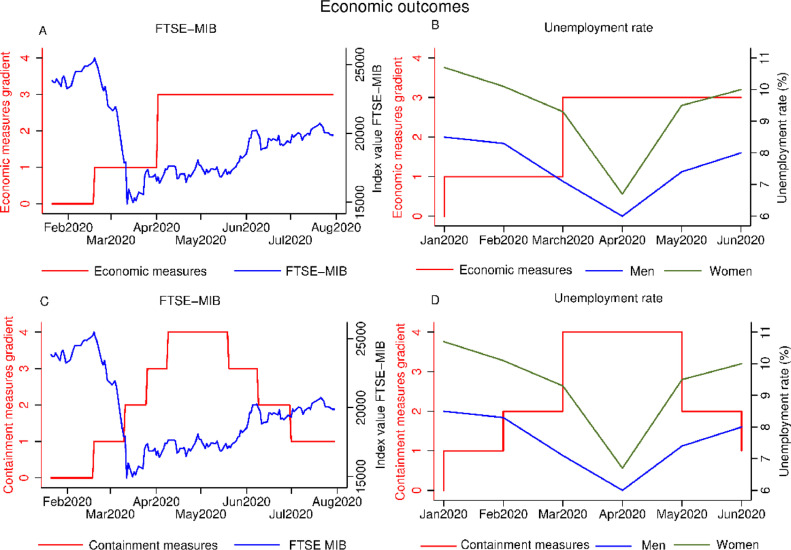
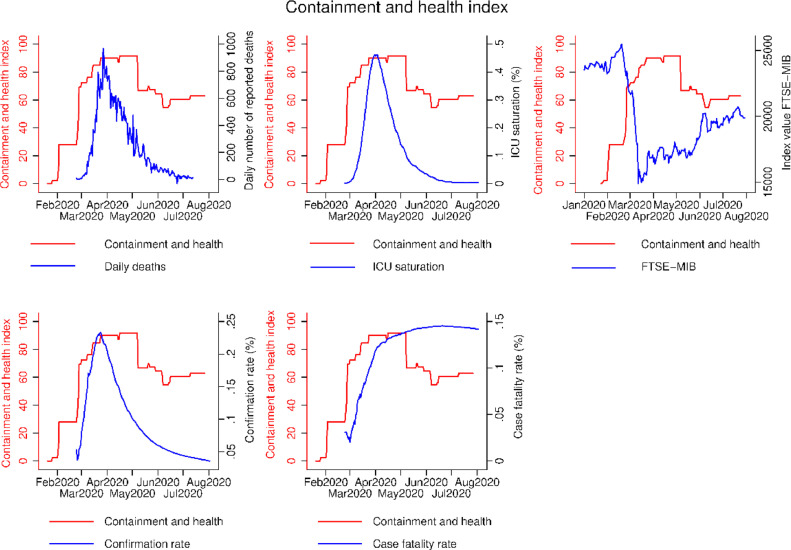
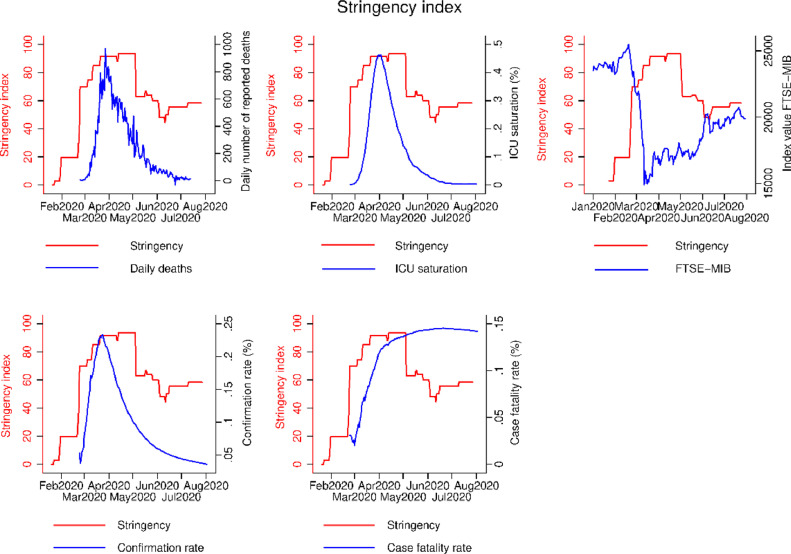
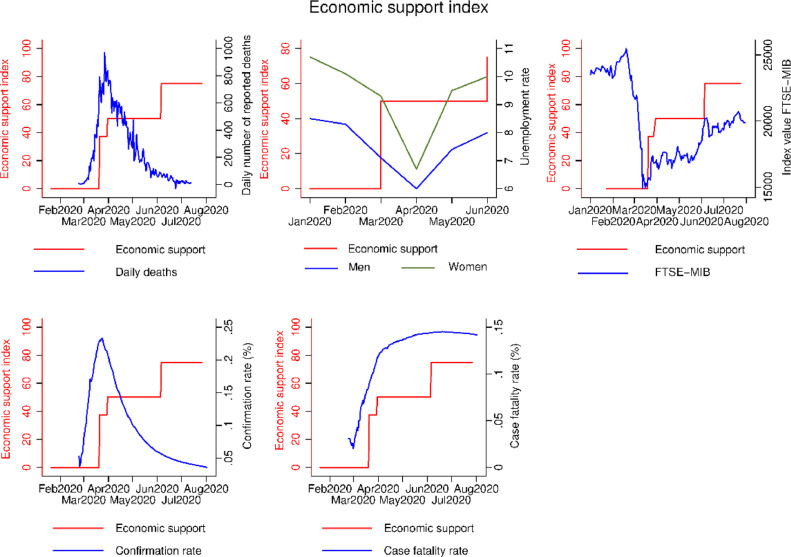
Methods: To categorise the policy interventions, we rely on the comparative and conceptual framework developed by Moy et al. (2020). We investigate the impact of policies on the daily reported number of deaths, case fatality rate, confirmation rate, intensive care unit saturation, and financial and job market indicators across the three major geographical areas of Italy (North, Centre, and South). Qualitative and quantitative data are gathered from mixed sources: Italian national and regional institutions, National Health Research and international organisations. Our analysis contributes to the literature on the COVID-19 pandemic by comparing policy interventions and their outcomes.

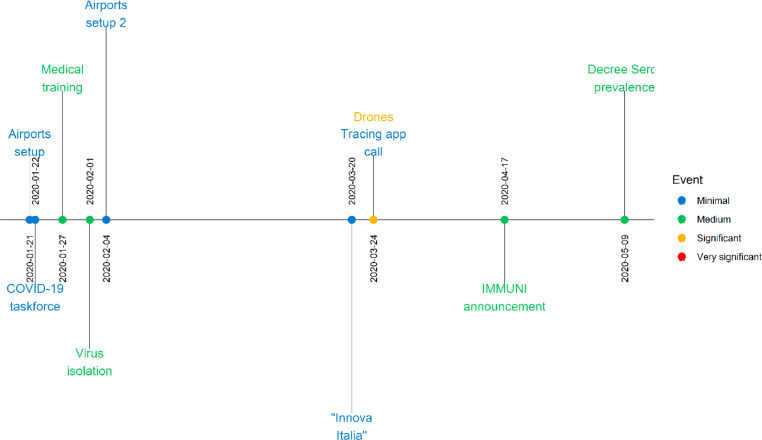
Results: Our findings suggest that the strictness and timing of containment and prevention measures played a prominent role in tackling the pandemic, both from a health and economic perspective. Technological interventions played a marginal role due to the inadequacy of protocols and the delay of their implementation.

Conclusions: Future government interventions should be informed by evidence-based decision making to balance, the benefits arising from the timing and stringency of the interventions against the adverse social and economic cost, both in the short and long term.

Keywords: Health policy; Health technology; Healthcare; Pandemic.


Figures

Fig. 1
Fig. 1
Distribution of epidemiological trend: daily variation of cases, recovered and deceases per 100,000 population at the national level and geographical area level (Northern, Central, Southern Regions).
Roadmap 1
Roadmap 1
Epidemiological milestones.
Roadmap 2
Roadmap 2
Policy interventions to contain the spread of the virus. Note: classification is based on Table A4 in the appendix. The significance gradient ranges from no restriction to enforced lockdown.
Roadmap 3
Roadmap 3
Policies for prevention and care & technological interventions. Note: classification is based on Table A5 & A6 in the appendix. For prevention and cure the significance gradient ranges form no interventions to all resources devoted to the public healthcare system. For technology the invasiveness gradient ranges from no interventions to centralised GPS contact tracing.
Roadmap 4
Roadmap 4
Economic Policies. Note: classification is based on Table A7 in the appendix. The significant gradient ranges from no changes to the status quo to strong public intervention in the financial and economic system.
Fig. A1
Fig. A1
Deaths distribution by age corrected for the age, (14th March 2020–23rd June 2020).
Fig. A2
Fig. A2
Incidence per gender, (12th March 2020–4th August 2020)
Fig. A3
Fig. A3
Comparison of the epidemiological trends: 1) Panel A: cases from the first 50th; 2) Panel B: deaths from the first 10th (Northern, Central, Southern Regions), (24th February 2020–2nd August 2020). Note: Northern regions: Piedmont, Aosta Valley, Lombardy, P.A. Bolzano, P.A. Trento, Veneto, Friuli-Venezia Giulia, Liguria, Emilia-Romagna; Central regions: Tuscany, Marche, Umbria, Lazio, Abruzzo. Southern regions: Molise, Campania, Basilicata, Apulia, Calabria, Sicily, Sardinia. Source: Personal elaboration on Ministry of Health data.
Fig. A4
Fig. A4
Number of tests per 100,000 inhabitants at regional level.
Fig. A5
Fig. A5
Monthly trade flows (import and export) in millions of Euro.
Fig. A6
Fig. A6
Retail sales value trend variation compared to the previous year, by product sector.
Fig. A7
Fig. A7
Comparison of the ICU beds saturation rate with the capacity before and after the COVID-19. Note: the red line coincides with the total saturation of the ICU capacity (100%) in the region considered. The x-axis reports the saturation rate 1 = 100%; 2 = 200%; 3 = 300%.
Fig. A8
Fig. A8
Prevention and care interventions gradient and case fatality rate (panel A), confirmation rate (panel B), daily number of reported deaths (panel C), ICU saturation (%) (panel D) by geographical areas.
Fig. A9
Fig. A9
Containment measures gradient and case fatality rate (panel A), confirmation rate (panel B), daily number of reported deaths (panel C), ICU saturation (%) (panel D) by geographical areas.
Fig. A10
Fig. A10
Technology intervention gradient and case fatality rate (panel A), confirmation rate (panel B), daily number of reported deaths (panel C), ICU saturation (%) (panel D).
Fig. A11
Fig. A11
Performance of FTSE MIB index and the response to major events.
Fig. A12
Fig. A12
Economic measures gradient and index value FTSE MIB (panels A, C) and unemployment rate (panels B, D).
Fig. A13
Fig. A13
The Oxford COVID-19 Government Response Tracker (OxCGRT): containment and health index.
Fig. A14
Fig. A14
The Oxford COVID-19 Government Response Tracker (OxCGRT): Stringency index.
Fig. A15
Fig. A15
The Oxford COVID-19 Government Response Tracker (OxCGRT): economic support index.
Fig. A16
Fig. A16
The Oxford COVID-19 Government Response Tracker (OxCGRT): government response index.

References

    1. Hale T., Hangrist N., Kira B., Petherick A., Phillips T., Webster S. Variation in government responses to COVID-19. Version 60 Blavatnik School of Government Working Paper. 2020.
    1. Ferguson N., Laydon D., Nedjati Gilani G., Imai N., Ainslie K., Baguelin M., et al. Report 9: impact of non-pharmaceutical interventions (NPIs) to reduce COVID19 mortality and healthcare demand. 2020.
    1. Klonowska K., Bindt P. Hague Centre for Strategic Studies; 2020. The COVID-19 pandemic two waves of technological responses in the european union.
    1. Camera dei Deputati. Misure sanitarie per fronteggiare l'emergenza coronavirus2020[Available from: https://temi.camera.it/leg18/temi/misure-sanitarie-per-fronteggiare-lll-....
    1. Brogi F.G., Barbara; Barcaroli, Giulio. Covid-19 in Italy: actual infected population, testing strategy and imperfect compliance. 2020.

LinkOut - more resources