. 2020 Nov;36(11):1242-1258.
doi: 10.1007/s12264-020-00573-9. Epub 2020 Sep 7.

Characterization of the Expression of the ATP-Gated P2X7 Receptor Following Status Epilepticus and during Epilepsy Using a P2X7-EGFP Reporter Mouse

Affiliations

Characterization of the Expression of the ATP-Gated P2X7 Receptor Following Status Epilepticus and during Epilepsy Using a P2X7-EGFP Reporter Mouse

James Morgan et al. Neurosci Bull. 2020 Nov.

Abstract

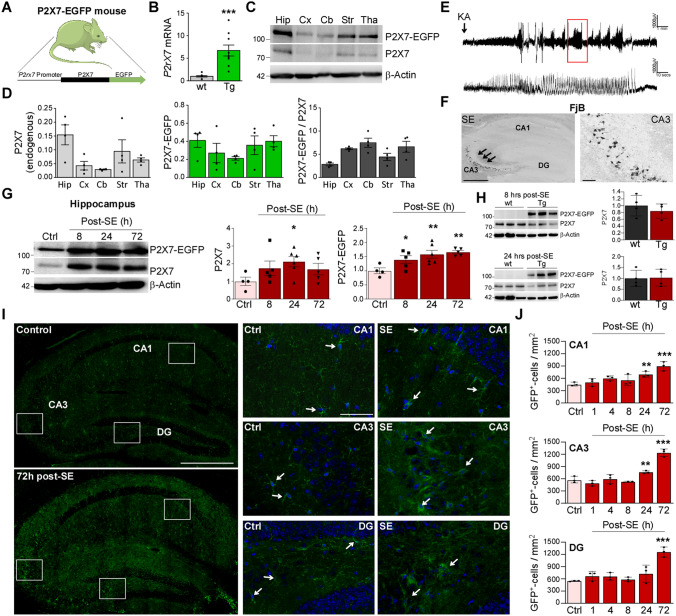
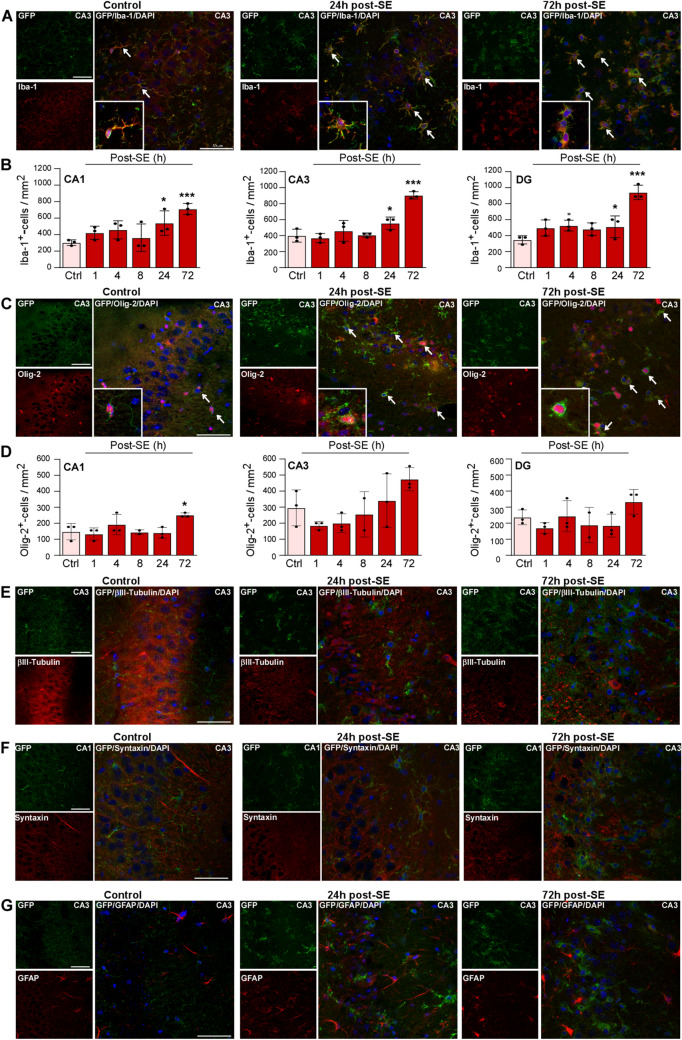
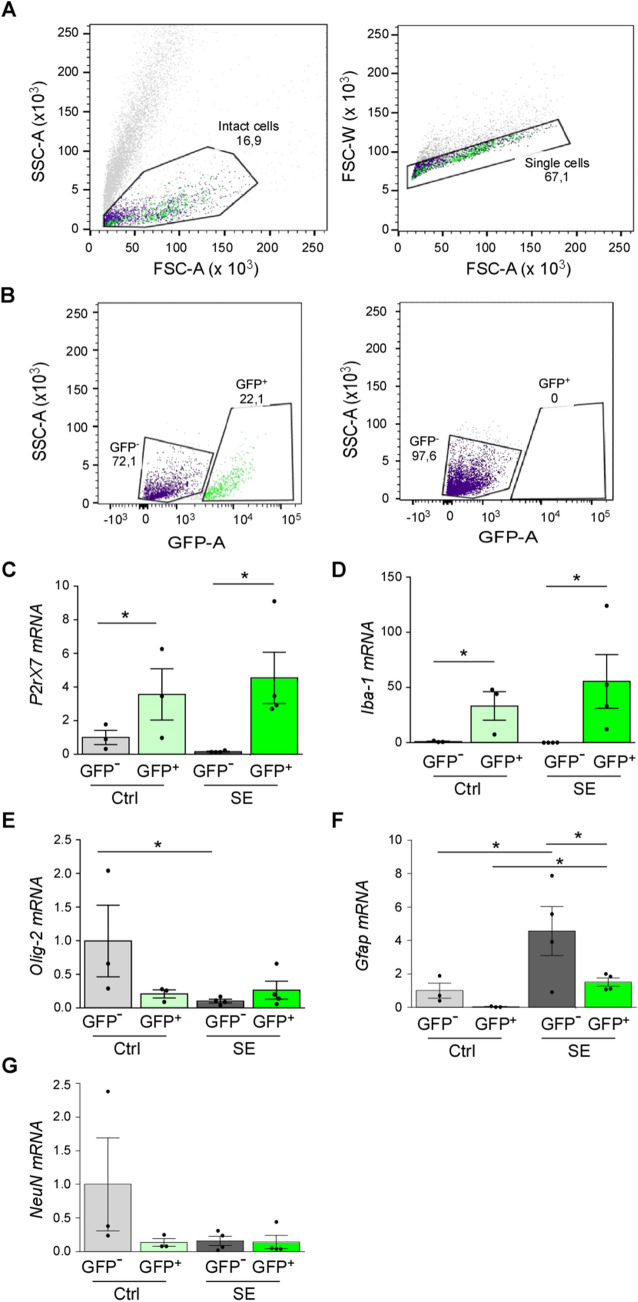
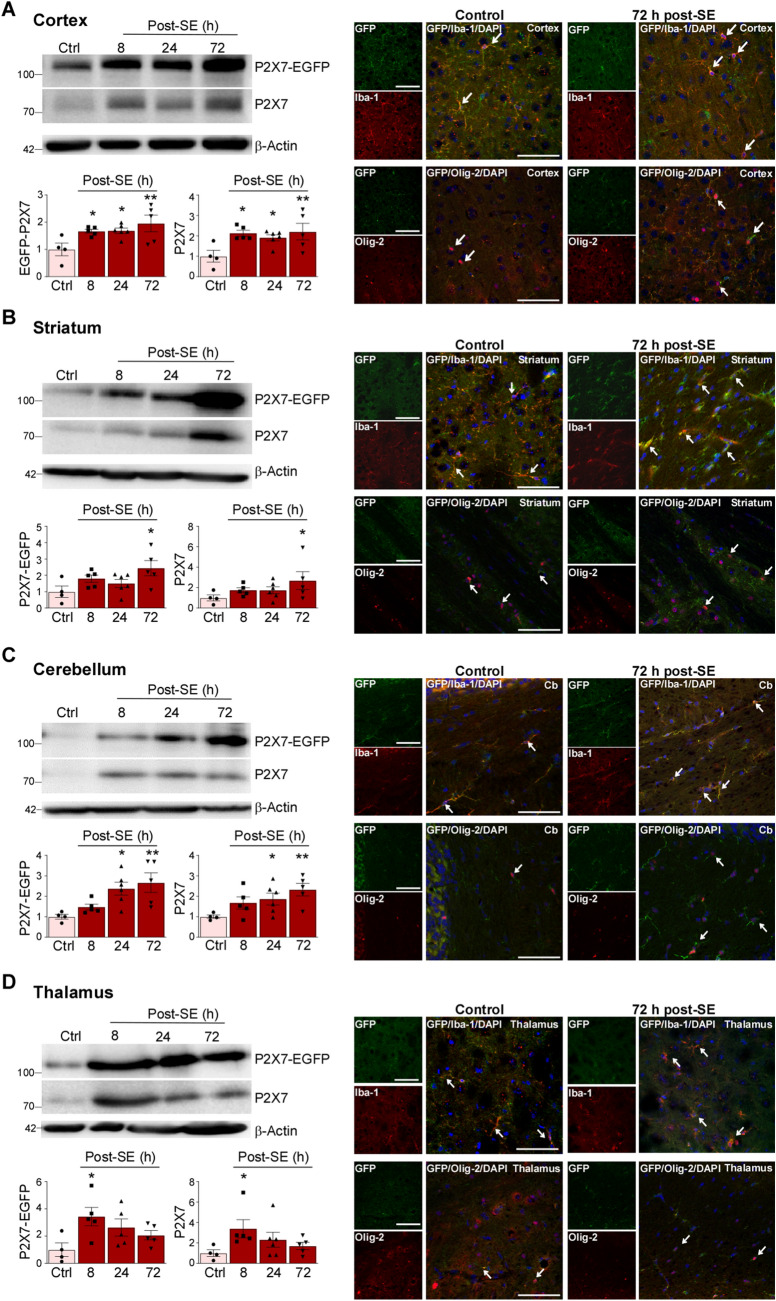
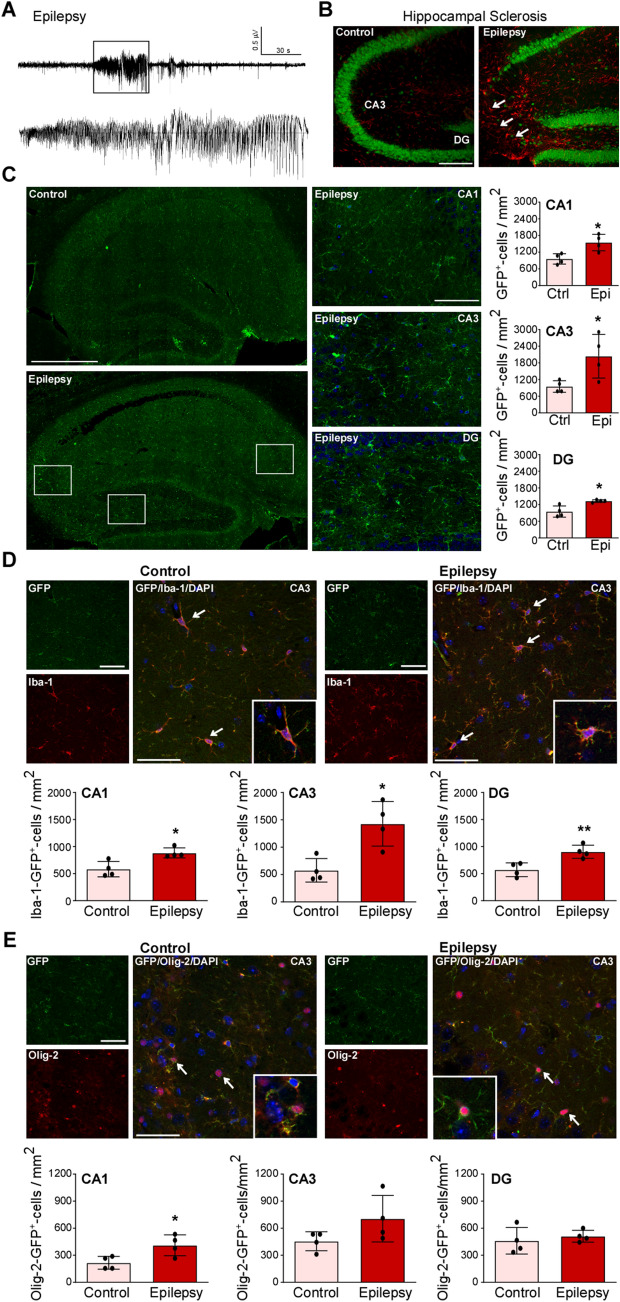
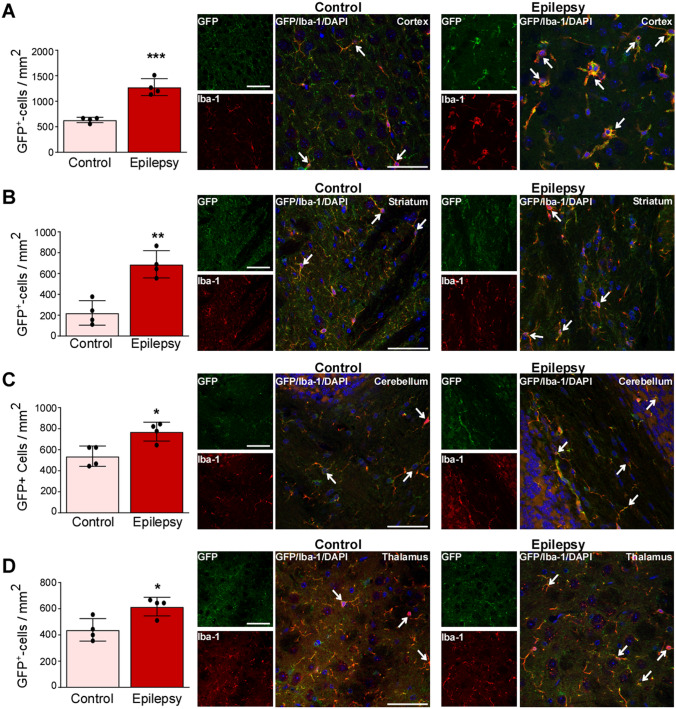
Mounting evidence suggests that the ATP-gated P2X7 receptor contributes to increased hyperexcitability in the brain. While increased expression of P2X7 in the hippocampus and cortex following status epilepticus and during epilepsy has been repeatedly demonstrated, the cell type-specific expression of P2X7 and its expression in extra-hippocampal brain structures remains incompletely explored. In this study, P2X7 expression was visualized by using a transgenic mouse model overexpressing P2X7 fused to the fluorescent protein EGFP. The results showed increased P2X7-EGFP expression after status epilepticus induced by intra-amygdala kainic acid and during epilepsy in different brain regions including the hippocampus, cortex, striatum, thalamus and cerebellum, and this was most evident in microglia and oligodendrocytes. Co-localization of P2X7-EGFP with cell type-specific markers was not detected in neurons or astrocytes. These data suggest that P2X7 activation is a common pathological hallmark across different brain structures, possibly contributing to brain inflammation and neurodegeneration following acute seizures and during epilepsy.

Keywords: Cell type-specific expression; Epilepsy; Green fluorescence protein; P2X7; Purinergic signaling; Status epilepticus.


Conflict of interest statement

All authors claim that there are no conflicts of interest.

Figures

Fig. 1
Fig. 1
Increased P2X7-EGFP in the hippocampus after status epilepticus. A Schematic showing the transgenic approach to overexpress P2X7. Transgenic P2X7 is C-terminally fused to the fluorescent protein EGFP and expressed under the transcriptional control of the BAC-derived P2rX7 promoter. B Histogram showing a ~ 6-fold increase of P2rX7 mRNA levels in P2X7-EGFP mice when compared to wild-type (5.714 ± 1.232, P = 0.0003; n = 9 (wild-type (wt)) and P2X7-EGFP-overexpressing mice (Tg)). C Representative Western blots (n = 1 per lane) showing P2X7-EGFP expression of endogenous P2X7 (~ 72 kDa) and transgenic P2X7-EGFP-EGFP (~ 95 kDa) in the hippocampus (Hip), cortex (Cx), cerebellum (Cb), striatum (Str), and thalamus (Tha) in a P2X7-EGFP mouse. β-Actin is used as a guide to loading. D Histograms showing P2X7-EGFP is expressed ~ 4–6 times higher according to the brain structure analyzed when compared to endogenous P2X7 (n = 4 per group). E Representative EEG traces starting at the time of KA injection until treatment with anticonvulsant lorazepam 40 min later show high-amplitude high-frequency spiking during SE in P2X7-EGFP mice. F Representative FjB staining (5 × magnification) confirms typical neuropathology 24 h post-SE in P2X7-EGFP mice with damage mainly restricted to the CA3 subfield of the ipsilateral hippocampus (scale bars, 50 µm). G Representative Western blots (n = 1 per lane) and histograms showing increased P2X7-EGFP expression post-SE in the ipsilateral hippocampus [Ctrl vs 8 h, 1.000 ± 0.1035 vs 1.394 ± 0.1393, P = 0.046; Ctrl vs 24 h, 1.000 ± 0.1035 vs 1.584 ± 0.1403, P = 0.0042; Ctrl vs 72 h: 1.000 ± 0.1035 vs 1.659 ± 0.0584, P = 0.0023; n = 4 (Control), 5 (8 and 72 h post-SE) and 6 (24 h post-SE)]. Of note, the relative expression increases in P2X7-EGFP are similar to those in endogenous P2X7 (Ctrl vs 24 h, 1.000 ± 0.2359 vs 2.115 ± 0.2901, P = 0.03). β-Actin is used as a guide to loading. H Western blots (n = 1 per lane) and corresponding histograms showing no differences in the endogenous levels of P2X7 8 h and 24 h after SE between wild-type and P2X7-EGFP mice [n = 3 (wt) and 4 (P2X7-EGFP (TG)]. β-Actin is used as a guide to loading. I Left panels, representative tiled photomicrographs (40 × magnification) showing GFP-positive cells in the entire ipsilateral hippocampus in vehicle-injected control mice and mice 72 h post-SE (note increased immunoreactivity against GFP in the hippocampus of mice subjected to SE; right panels, higher magnification of each hippocampal subfield CA1, CA3, and DG (scale bars, 50 µm). J Histograms showing more GFP-positive cells in all three hippocampal subfields post-SE when compared to control-injected P2X7-EGFP mice (CA1 Ctrl vs 24 h, 459.3 ± 26.71 vs 696.3 ± 41.24, P = 0.0079, Ctrl vs 72 h, 459.3 ± 26.71 vs 896.3 ± 64.58, P < 0.0001; CA3 Ctrl vs 24 h, 577.8 ± 46.26 vs 763.0 ± 19.60, P = 0.0106, Ctrl vs 72 h, 577.8 ± 46.26 vs 1237.0 ± 53.42, P < 0.0001; DG Ctrl vs 72 h, 581.1 ± 7.407 vs 1259.0 ± 70.66, P < 0.0001; n = 3 per group). SE, status epilepticus; Ctrl, Control; *P < 0.05, **P < 0.01, ***P < 0.001.
Fig. 2
Fig. 2
Co-localization of P2X7-EGFP with microglia and oligodendrocytes post-status epilepticus. A Representative photomicrographs (40 × magnification) showing co-localization of GFP (green) with the microglial marker Iba-1 (red) in controls and mice subjected to SE in the CA3 subfield (note that microglia showing long processes in vehicle-injected controls change to an amoeboid appearance at 24 h and 72 h post-SE) (scale bar, 50 µm). B Histograms showing more Iba-1- and GFP-positive cells post-SE in all three hippocampal subfields (CA1 Ctrl vs 24 h, 303.7 ± 19.60 vs 540.7 ± 85.43, P = 0.0224, Ctrl vs 72 h, 303.7 ± 19.60 vs 711.1 ± 38.49, P = 0.0007; CA3 Ctrl vs 24 h, 400.0 ± 46.26 vs 555.6 ± 44, P = 0.0286, Ctrl vs 72 h, 400.0 ± 46.26 vs 903.7 ± 26.71, P < 0.0001; DG Ctrl vs 4 h, 348.1 ± 29.63 vs 525.9 ± 39.20, P = 0.034, Ctrl vs 24 h, 348.1 ± 29.63 vs 511.1 ± 78.04, P = 0.0488, Ctrl vs 72 h, 348.1 ± 29.63 vs 940.7 ± 51.85, P < 0.0001; n = 3 per group). C Representative images (40 × magnification) showing co-localization of GFP (green) with the oligodendrocyte marker Olig-2 (red) in controls and mice subjected to SE in the CA3 subfield (note that oligodendrocytes, similar to microglia, show long processes in vehicle-injected controls which change to an amoeboid appearance at 24 h and 72 h post-SE) (scale bar, 50 µm). D Histograms showing more Olig-2- and GFP-positive cells post-SE in CA1 (Ctrl vs 72 h, 148 ± 29.63 vs 251.9 ± 7.407, P = 0.0115; n = 3 per group). There are no significant differences between treatment groups for the subfields CA3 and DG (n = 3 per group). E No co-localization between the neuronal marker βIII-tubulin (red) and GFP (green) under control conditions and post-SE (scale bar, 50 µm). F No co-localization of the synaptic marker syntaxin (red) and GFP (green) under control conditions and post-SE (scale bar, 50 µm). G No co-localization between the astrocyte marker GFAP (red) and GFP (green) under control conditions and post-SE (scale bar, 50 µm). *P < 0.05, ***P < 0.001.
Fig. 3
Fig. 3
Fluorescence activated cell sorting in P2X7-EGFP mice. A The forward scatter (FSC) vs the side scatter (SSC) gate was used to exclude dead cells and the FSC-A (area) vs the FSC-H (height) gate was used to identify single cells. B The GFP-A (area) vs the SSC-A (area) gate was used to discriminate GFP-positive from GFP-negative cells. Hippocampal tissue from wild-type mice was used as a negative control to set up the gate. CG Histograms showing mRNA levels for (C) P2rx7 (Control: GFP, 1.000 ± 0.4244 vs post-SE, GFP+, 4.548 ± 1.526, P = 0.049; post-SE: GFP, 0.1575 ± 0.02780, GFP+, 4.548 ± 1.526, P = 0.01), (D) Iba-1 (Control: GFP, 0.9967 ± 0.3919 vs post-SE: GFP+, 55.51 ± 24.30, P = 0.03; post-SE: GFP, 0.1100 ± 0.01080, GFP+, 55.51 ± 24.30, P = 0.02), (E) Olig-2 (Control: GFP, 0.9967 ± 0.5325 vs post-SE: GFP, 0.1025 ± 0.02689, P = 0.02), (F) Gfap (Control: GFP, 1.000 ± 0.4539 vs post-SE: GFP, 4.573 ± 1.466, P = 0.02; Control: GFP+, 0.03667 ± 0.01667 vs post-SE: GFP, 4.573 ± 1.466, P = 0.005; post-SE: GFP+, 1.510 ± 0.2416 vs GFP, 4.573 ± 1.466, P = 0.03), and (G) NeuN in GFP and GFP+ FACS-separated cells from vehicle-injected controls (Ctrl) and mice 24 h post-SE (n = 3 (Control) and 4 (SE). *P < 0.05, **P < 0.01, ***P < 0.001.
Fig. 4
Fig. 4
Increased P2X7 expression in extra-hippocampal areas. AD Representative Western blots (n = 1 per lane) and histograms showing increased P2X7 expression (endogenous and P2X7-EGFP) post-SE [P2X7-EGFP, cx: Ctrl vs 8 h, 1.000 ± 0.2322 vs 1.667 ± 0.07172, P = 0.03, Ctrl vs 24 h, 1.000 ± 0.2322 vs 1.684 ± 0.09757, P = 0.03, Ctrl vs 72 h, 1.000 ± 0.2322 vs 1.953 ± 0.3028, P = 0.004; ST Ctrl vs 72 h, 1.000 ± 0.3470 vs 2.438 ± 0.4644, P = 0.01; TH Ctrl vs 8 h, 1.000 ± 0.4977 vs 3.435 ± 0.6794, P = 0.01; CB Ctrl vs 24 h, 1.000 ± 0.1172 vs 2.368 ± 0.3129, P = 0.01, Ctrl vs 72 h, 1.000 ± 0.1172 vs 2.665 ± 0.4765, P = 0.003. Endogenous P2X7 cx, Ctrl vs 8 h, 1.000 ± 0.2918 vs 2.126 ± 0.1471, P = 0.01, Ctrl vs 24 h, 1.000 ± 0.2918 vs 1.908 ± 0.1482, P = 0.03, Ctrl vs 72 h, 1.000 ± 0.2918 vs 2.205 ± 0.4071, P = 0.007; ST Ctrl vs 72 h, 1.000 ± 0.2936 vs 2.681 ± 0.8728, P = 0.04; TH Ctrl vs 8 h, 1.000 ± 0.3256 vs 3.387 ± 0.8902, P = 0.03; CB Ctrl vs 24 h, 1.000 ± 0.08098 vs 1.865 ± 0.2904, P = 0.049, Ctrl vs 72 h, 1.000 ± 0.08098 vs 2.326 ± 0.3095, P = 0.006; n = 4 (Control), 5 (8 and 72 h post-SE), and 6 (24 h post-SE) and representative images displaying P2X7-EGFP mainly localized to Iba-1-positive microglia and Olig-2-positive oligodendrocytes 72 h post- SE in (A) cortex, (B) striatum, (C) cerebellum, and (D) thalamus (n = 3 per group). β-Actin is used as a guide to loading. Scale bars, 50 µm. *P < 0.05, **P < 0.01.
Fig. 5
Fig. 5
Increased P2X7-EGFP expression in the hippocampus during chronic epilepsy. A Representative EEG trace depicting high-frequency high-amplitude spiking during an epileptic seizure recorded from cortical electrodes in P2X7-EGFP mice at day 10 post-SE. B Representative photomicrographs (20 × magnification) showing reactive astrocytes (GFAP, red) and loss of NeuN-positive neurons (green) in the ipsilateral CA3 subfield in epileptic P2X7-EGFP mice 14 days post-SE [note decreased neuronal density in the ipsilateral CA3 subfield (arrows)]. C Left panels, representative tiled photomicrographs (40 ×) showing GFP-positive cells throughout the ipsilateral hippocampus in vehicle-injected controls and mice 14 days post-SE; right panels, higher magnification of each hippocampal subfield (CA1, CA3 and DG) from epileptic P2X7-EGFP mice and histograms showing more GFP-positive cells in each hippocampal subfield 14 days post-SE (CA1 Ctrl vs Epileptic, 959.3 ± 94.11 vs 1548 ± 148.2, P = 0.0153; CA3 Ctrl vs Epileptic, 950.0 ± 104.4 vs 2039.0 ± 392.1, P = 0.0364; DG Ctrl vs Epileptic, 950.0 ± 100.4 vs 1328.0 ± 22.91, P = 0.0105; n = 4 per group). Scale bars, 50 µm. D Representative images (40 × , CA3) and histograms showing more Iba-1-positive and GFP-positive cells in all three hippocampal subfields in epileptic P2X7-EGFP mice 14 days post-SE (CA1 Ctrl vs Epileptic, 583.3 ± 71.07 vs 883.3 ± 46.59, P = 0.0124; CA3 Ctrl vs Epileptic, 577.8 ± 107.7 vs 1428.0 ± 203.7, P = 0.0102; DG Ctrl vs Epileptic, 572.2 ± 63.75 vs 905.6 ± 60.43, P = 0.009; n = 4 per group). Scale bars, 50 µm. E Representative images (40 × , CA1) and histograms showing more Olig-2-positive and GFP-positive cells in the CA1 subfield in epileptic P2X7-EGFP mice 14 days post-SE (CA1 Ctrl vs Epileptic, 216.7 ± 35.57 vs 411.1 ± 57.74, P = 0.0285; n = 4 per group). No differences between groups were found in CA3 and DG (n = 4 per group). Scale bars, 50 µm. *P < 0.05, **P < 0.01, ***P < 0.001.
Fig. 6
Fig. 6
Increased microglial and oligodendrocyte expression of P2X7-EGFP during chronic epilepsy. AD Histograms and representative images (40 ×) showing more GFP-positive cells in epileptic P2X7-EGFP mice, mainly localized to Iba-1-positive microglia and Olig-2-postitive oligodendrocytes in (A) cortex (Ctrl vs Epileptic, 633.3 ± 26.45 vs 1278.0 ± 82.40, P = 0.0003; n = 4 per group), (B) striatum (Ctrl vs Epileptic, 611.1 ± 29.40 vs 844.4 ± 32.71, P = 0.0018; n = 4 per group), (C) cerebellum (Ctrl vs Epileptic, 538.9 ± 48.33 vs 755.6 ± 58.79, P = 0.0349; n = 4 per group), and (D) thalamus (Ctrl vs Epileptic, 438.9 ± 42.91 vs 616.7 ± 35.57, P = 0.0189; n = 4 per group). Scale bars, 50 µm. *P < 0.05, **P < 0.01, ***P < 0.001.

Similar articles

Cited by

References

    1. Engel T, Alves M, Sheedy C, Henshall DC. ATPergic signalling during seizures and epilepsy. Neuropharmacology. 2016;104:140–153. - PubMed
    1. Burnstock G. Purinergic signalling: Therapeutic developments. Front Pharmacol. 2017;8:661. - PMC - PubMed
    1. Burnstock G. Introduction to purinergic signalling in the brain. Adv Exp Med Biol. 2020;1202:1–12. - PubMed
    1. Moshe SL, Perucca E, Ryvlin P. Tomson T. Epilepsy: new advances. Lancet. 2015;385:884–898. - PubMed
    1. Bialer M, White HS. Key factors in the discovery and development of new antiepileptic drugs. Nat Rev Drug Discov. 2010;9:68–82. - PubMed

Substances