

Mitochondrial respiration is required to provide amino acids during fermentative proliferation of fission yeast
- PMID: 32896087
- PMCID: PMC7645267
- DOI: 10.15252/embr.202050845
Mitochondrial respiration is required to provide amino acids during fermentative proliferation of fission yeast
Abstract
When glucose is available, many organisms repress mitochondrial respiration in favour of aerobic glycolysis, or fermentation in yeast, that suffices for ATP production. Fission yeast cells, however, rely partially on respiration for rapid proliferation under fermentative conditions. Here, we determined the limiting factors that require respiratory function during fermentation. When inhibiting the electron transport chain, supplementation with arginine was necessary and sufficient to restore rapid proliferation. Accordingly, a systematic screen for mutants growing poorly without arginine identified mutants defective in mitochondrial oxidative metabolism. Genetic or pharmacological inhibition of respiration triggered a drop in intracellular levels of arginine and amino acids derived from the Krebs cycle metabolite alpha-ketoglutarate: glutamine, lysine and glutamic acid. Conversion of arginine into these amino acids was required for rapid proliferation when blocking the respiratory chain. The respiratory block triggered an immediate gene expression response diagnostic of TOR inhibition, which was muted by arginine supplementation or without the AMPK-activating kinase Ssp1. The TOR-controlled proteins featured biased composition of amino acids reflecting their shortage after respiratory inhibition. We conclude that respiration supports rapid proliferation in fermenting fission yeast cells by boosting the supply of Krebs cycle-derived amino acids.
Keywords: S. pombe; arginine; cellular metabolism; fermentation; respiration.
© 2020 The Authors. Published under the terms of the CC BY 4.0 license.
Conflict of interest statement
The authors declare that they have no conflict of interest.
Figures
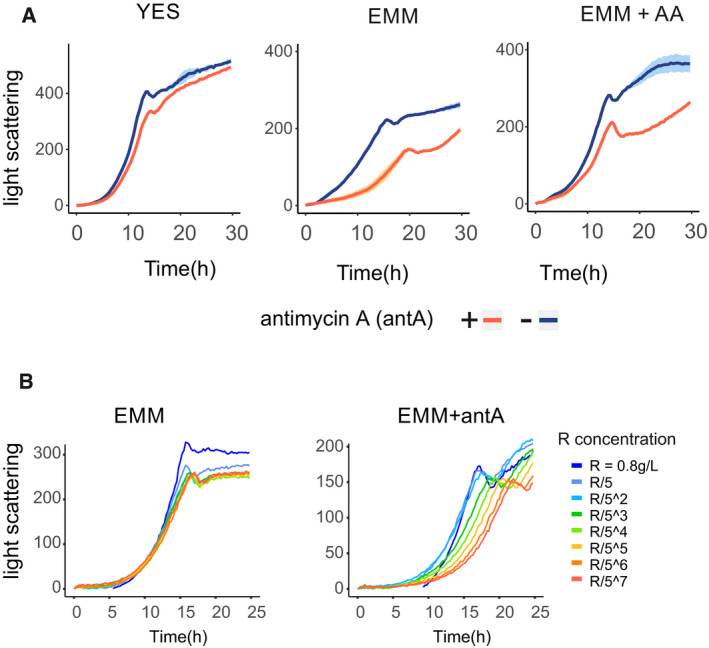
Growth curves of yeast cultures in rich (YES) or defined (EMM) media, and in defined media supplemented with mix of soluble amino acids (EMM + AA). In each experiment, media were supplemented or not with antimycin A (blue or red curves respectively). Data presented as the mean of three technical repeats (main line) with shades indicating the standard deviation.
Dose‐dependent effect of arginine. Growth curves of yeast cultures in defined media with or without antimycin A (EMM or EMM + antA), supplemented with different amounts of arginine (as indicated in the legend).
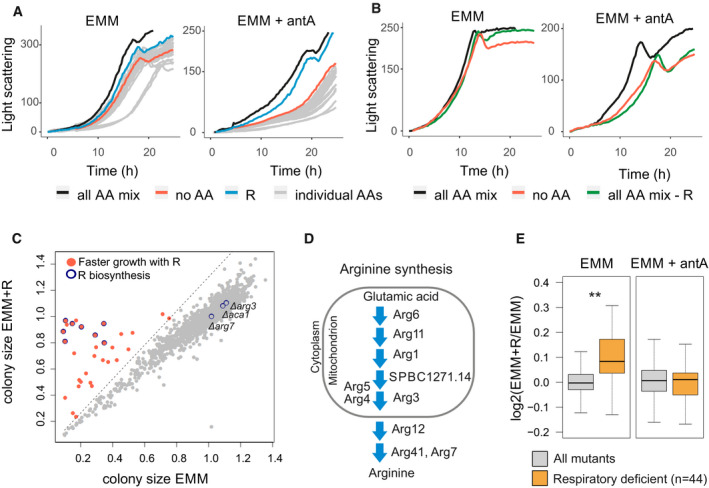
Growth curves of Schizosaccharomyces pombe cultures in minimal medium without (EMM) or with antimycin A (EMM + antA). Cultures were supplemented with either the complete amino‐acid mix (all AA mix, black), without any amino acids (no AA, red), with arginine only (R, blue) or with individual amino acids other than arginine (individual AAs, grey).
Growth curves as in (A) for cultures supplemented with complete amino‐acid mix (black), without any amino acids (red) or amino‐acid mix without arginine (green).
Scatter plot of normalised colony sizes of cells grown on EMM against normalised colony sizes of cells grown on EMM supplemented with arginine (EMM + R; Dataset EV1). Mutants that passed our filtering (Materials and Methods) and whose colony size ratios were 30% bigger when supplemented with arginine are shown in red; mutants encoding known genes of the arginine biosynthesis pathway are shown with blue circles.
Scheme of arginine biosynthesis pathway, with protein localisation based on PomBase annotations (Lock et al, 2019).
Box plot of mean colony size ratios of mutants grown with vs without arginine for all mutants (grey) and respiratory deficient mutants (orange, based on previous screens (Malecki & Bähler, 2016) (Welch's t‐test **P < 0.002). The same analysis was performed for mutants grown on EMM (left; four biological repeats, Dataset EV1) or on EMM supplemented with antimycin A (right; two biological repeats, Dataset EV2). Boxplots were created using the R boxplot command with default settings. The central band indicates the median, the upper and lower limits of the box indicate first and third quartiles, and the whiskers show the most extreme data, limited to 1.5‐time interquartile range.
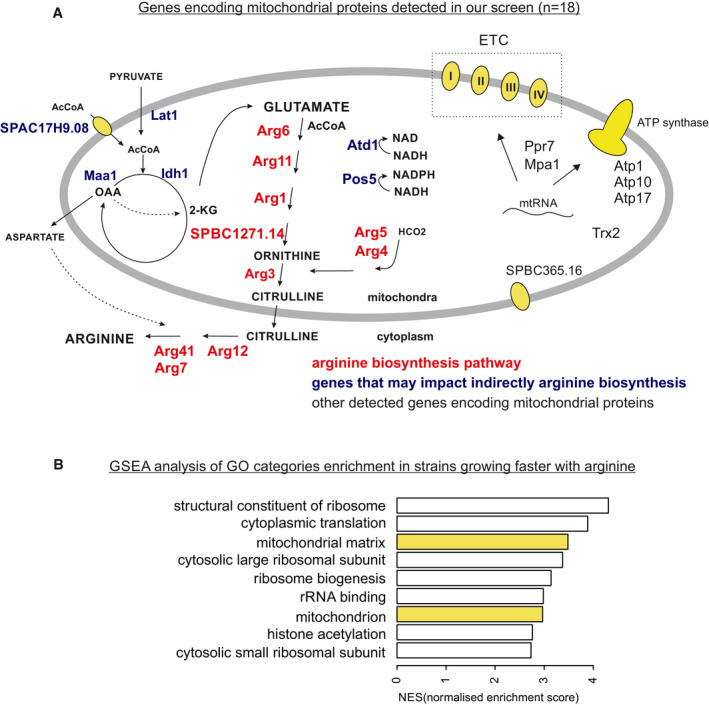
Genes encoding mitochondrial proteins identified in our screen were separated to ones that are part of arginine biosynthesis pathway (red), ones that may indirectly impact both respiration and arginine biosynthesis (blue) and others (black). Additionally, cytoplasmic enzymes involved in arginine biosynthesis are indicated. Short descriptions of cellular functions as well as budding yeast and human orthologues of genes indicated in the figure are provided in Table EV1.
Gene Ontology (GO) enrichments in the result of the screen identified using threshold‐free GSEA analysis (Subramanian et al, 2005). (We show categories enriched among genes whose deletion results in faster growth with arginine; highlighted in yellow are GO categories containing genes encoding mitochondrial proteins).
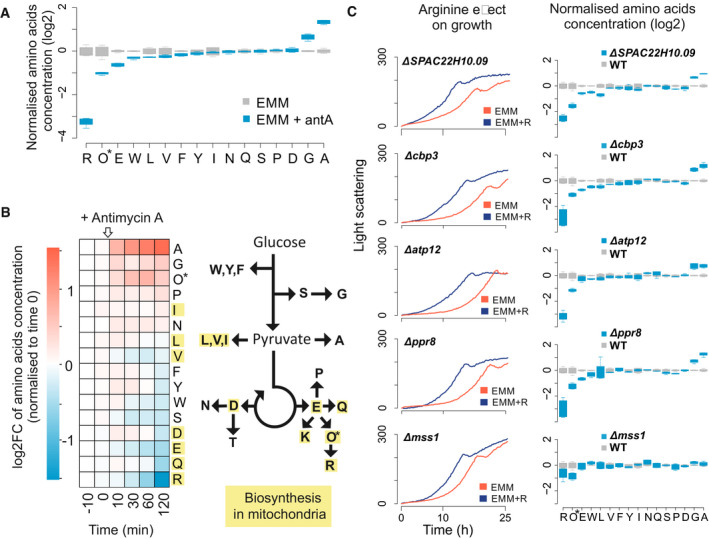
Normalised concentration values of 16 amino acids in cells grown in EMM without (grey) or with (blue) antimycin A. For each condition, four independent samples were analysed. Concentrations are presented relative to the mean value for the given amino acid in EMM medium. *Ornithine (Orn) is abbreviated as O. Boxplots were created using R boxplot command with default settings. The central band indicates the median, the upper and lower limits of the box indicate first and third quartiles, and the whiskers show the most extreme data, limited to 1.5‐time interquartile range.
Amino‐acid concentrations before and after addition of antimycin A to cells exponentially growing in EMM. Left: heat map showing concentration changes (log2 fold change) of each measured amino acid during the time course relative to time point 0 (before antimycin A addition). Right: simplified scheme of amino‐acid biosynthetic pathways. Amino acids for which any biosynthetic enzyme has an annotated mitochondrial location are highlighted in yellow. *Ornithine (Orn) is abbreviated as O.
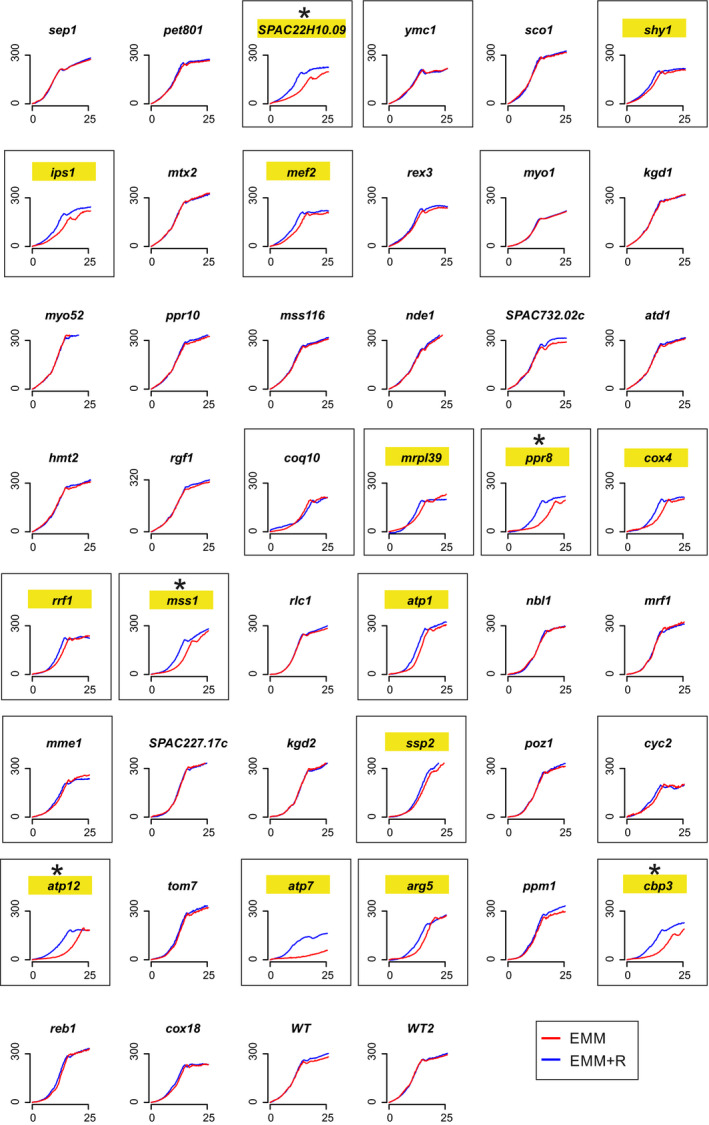
Left panels: cell growth in EMM without (red) or with (blue) arginine supplementation for five selected respiratory mutants as indicated (graphs selected from Fig EV3). Right panels: normalised intracellular amino‐acid concentrations as in (A) for the same five respiratory mutants (blue) and wild‐type control cells (grey). For each mutant and the wild‐type strain, four independent samples were analysed. *Ornithine (Orn) is abbreviated as O. Boxplot features as in (A).
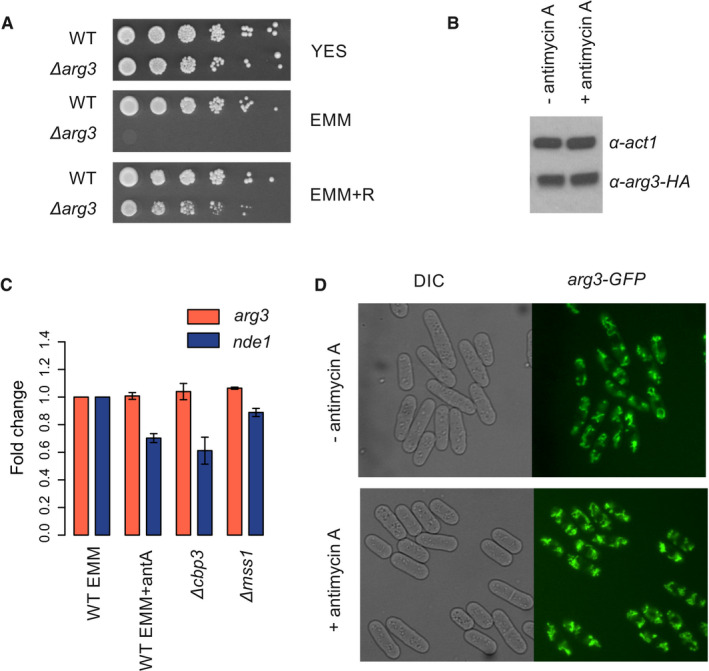
Strain with arg3 gene deletion (Δarg3) in prototroph background exhibits arginine auxotrophy. Wild‐type prototroph (WT) and Δarg3 strains were grown in liquid YES media, washed in EMM and spotted on agar plates with rich (YES) and minimal (EMM) medium, and in minimal medium supplemented with arginine (EMM + R).
Western blot against Arg3‐HA fusion protein. Total proteins were extracted from cells grown exponentially in EMM or EMM with antimycin A. Signal obtained using antibodies against actin (α‐act1) serves as loading control.
Level of arg3 transcript was measured using qPCR method in cells grown in EMM or EMM with antimycin A. Additionally, level of arg3 transcript was measured in respiratory mutants grown in EMM – Δcbp1 and Δmss1. As a control, we measured level of nde1 transcript encoding equivalent of complex I electron transport chain that was shown to be repressed in respiratory mutants (Malecki et al, 2016). Data were normalised to the cdc2 transcript level. Data are presented as mean of two independent repeats ± SD.
Arg3‐GFP fusion localises to mitochondria, we detected similar intensity of GFP signal in cells grown in EMM or EMM with antimycin A.
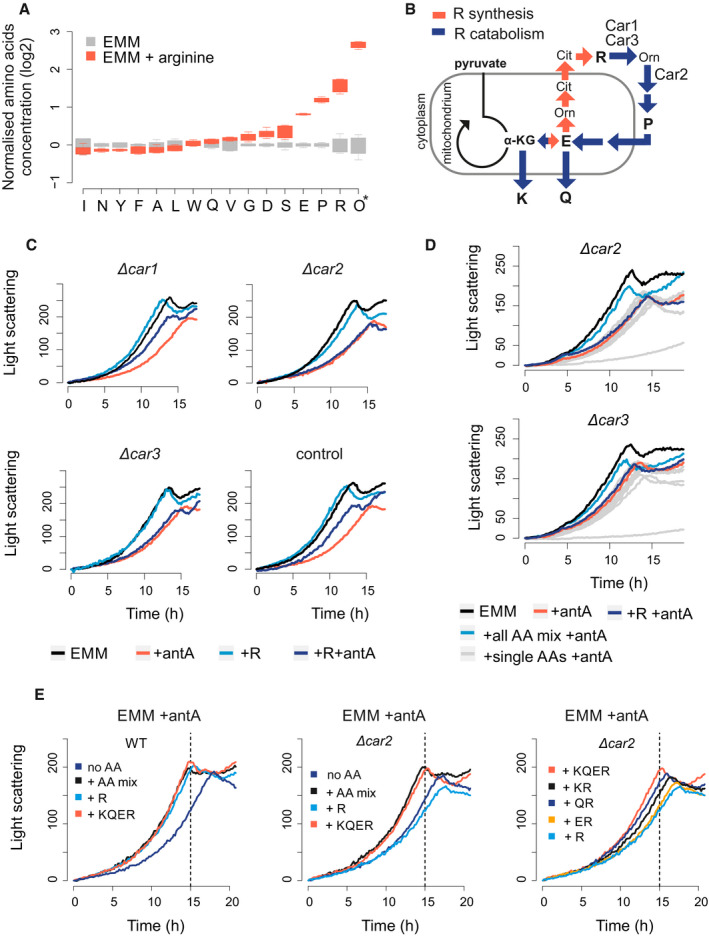
Normalised amino‐acid concentrations in cells grown in EMM without (grey) or with arginine (red). For each condition, four independent samples were analysed. Concentrations are presented relative to the mean value for the given amino acid in EMM medium. *Ornithine (Orn) is abbreviated as O. The central band indicates the median, the upper and lower limits of the box indicate first and third quartiles, and the whiskers show the most extreme data, limited to 1.5‐time interquartile range.
Schematic relationship between alpha‐ketoglutarate (α‐KG) and arginine (R) synthesis (red arrows) and catabolism (blue arrows). Arginine is used to synthesise proline (P), glutamic acid (E), glutamine (Q) and lysine (K). The enzymatic roles of Car1, Car2 and Car3 are indicated.
Growth curves of strains deleted for car1, car2 or car3, and a wild‐type control. Strains were grown in EMM (black), EMM with antimycin A (red), EMM with arginine (light blue) or EMM with both arginine and antimycin A (dark blue) as indicated.
Growth curves of strains deleted for car2 (top) or car3 (bottom). Strains were grown in EMM (black), EMM with antimycin A (red), EMM with arginine and antimycin A (dark blue), EMM with mix of all amino acids and antimycin A (bright blue) and EMM with antimycin A and each individual amino acid from the mix (grey).
Growth curves of wild‐type control (WT) and car2 deletion strain (Δcar2). Strains were grown in EMM media with antimycin A and with either a mix of all amino acids (+ AA mix) or different combinations of lysine (K), glutamine (Q), glutamic acid (E) or arginine (R) as indicated. Dashed line: time point where wild‐type strain saturates in EMM with amino‐acid mix.
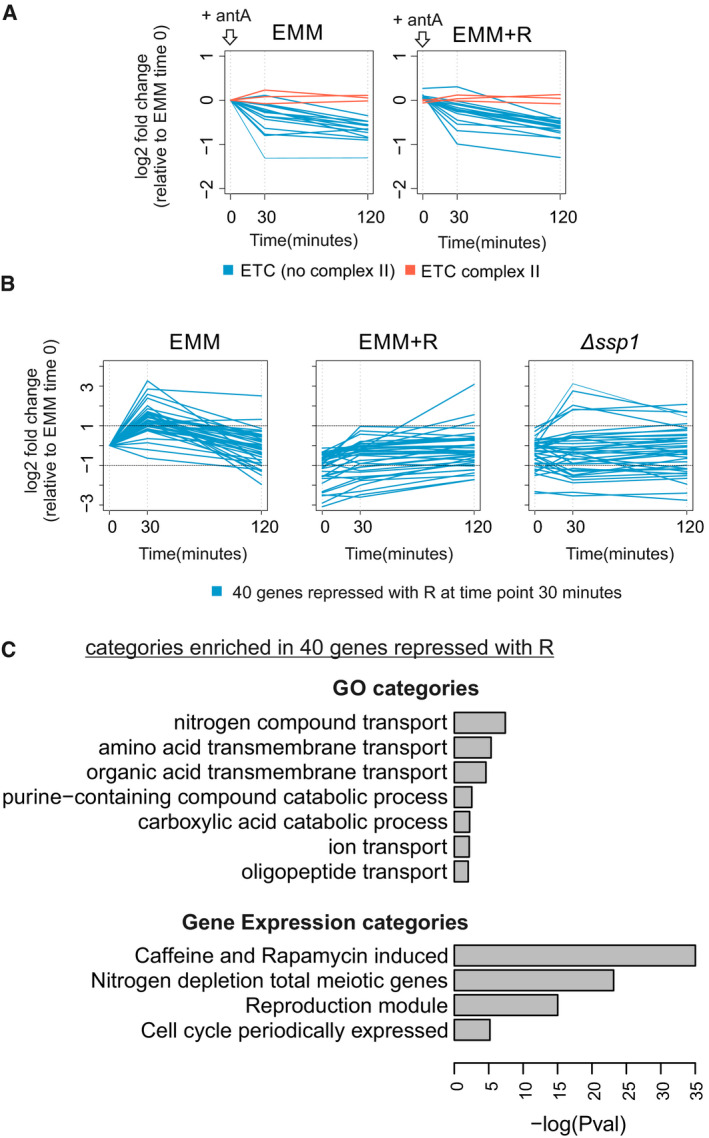
Changes of transcript encoding electron transport chain complex subunits before and 30 and 120 min after antimycin A treatment in minimal media (EMM) and minimal media supplemented with arginine (EMM + R). Subunits of complex II are indicated in red, and other subunits in blue. Values are normalised to EMM time zero.
Profiles of expression of 40 genes repressed in media with arginine at 30 min after antimycin A treatment. Changes of transcript abundances before and 30 and 120 min after antimycin A treatment are shown for the wild‐type cells grown in minimal media with or without arginine and for ssp1 deletion cells grown in minimal media. Values are normalised to EMM time zero.
Selected gene ontology (GO) and gene expression categories significantly over‐ or under‐enriched in genes repressed in media with arginine at 30 min after antimycin A treatment. Analysis performed using online tool AnGeLi (Bitton et al, 2015).
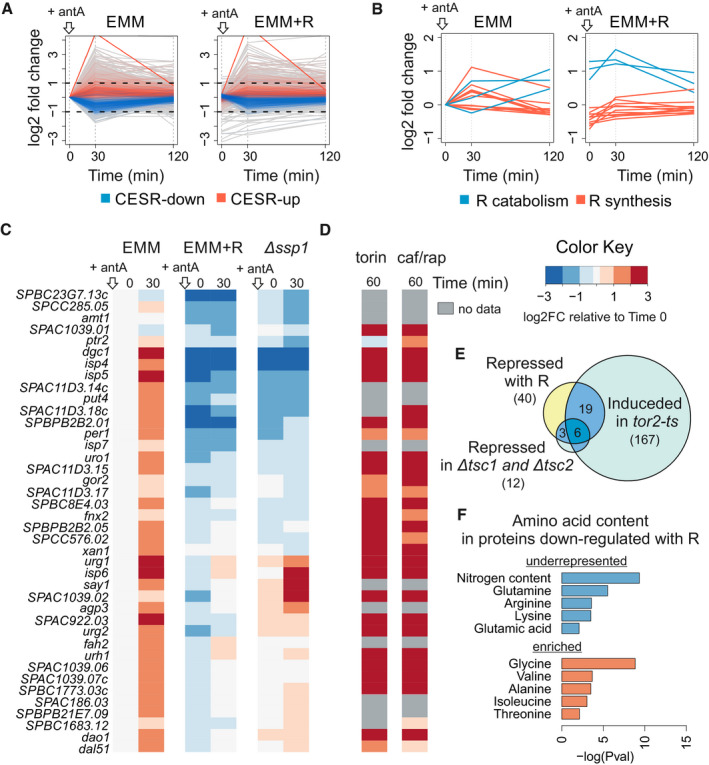
Changes in transcript abundance 30 and 120 min after addition of antimycin A to exponentially growing cells without (EMM) or with arginine (EMM + R). Transcripts annotated as up‐ or down‐regulated core environmental stress response (CESR) are indicated in red and blue, respectively. All data are normalised to EMM time point 0.
Graphs as in (A) showing expression profiles of transcript encoding enzymes for arginine catabolism (blue) or arginine biosynthesis (red).
Heat map of expression changes for transcripts repressed over 2‐fold at 30 min in cells supplemented with arginine (EMM + R) relative to cells without supplementation (EMM). Values for timepoints 0 and 30 min after antimycin A addition are shown for cells grown in EMM, EMM with arginine and ssp1 deletion mutant grown in EMM. The data are normalised to EMM timepoint 0.
Heat map of expression changes of the same genes as in (B) after 1 h of inhibiting TOR kinase with torin1 or caffeine/rapamycin treatment relative to cell before treatment; cells were grown in rich media—YES (data from (Rodríguez‐López et al, 2019)).
Overlaps between genes repressed with arginine supplementation and genes induced in tor2 thermo‐sensitive mutant (P < E‐27) (Matsuo et al, 2007), or repressed in strains deleted for the TOR inhibitors tsc1 and tsc2 (P < E‐16) (Van Slegtenhorst et al, 2004).
Enriched and underrepresented amino acids in proteins encoded by 40 genes that are down‐regulated in media with arginine. Analysis performed using online tool AnGeLi (Bitton et al, 2015).
References
-
- Basan M (2018) Resource allocation and metabolism: the search for governing principles. Curr Opin Microbiol 45: 77–83 - PubMed
Publication types
MeSH terms
Substances
Grants and funding
LinkOut - more resources
Full Text Sources
Molecular Biology Databases
