

Aqueous Cytokine Expression and Higher Order OCT Biomarkers: Assessment of the Anatomic-Biologic Bridge in the IMAGINE DME Study
- PMID: 32896498
- PMCID: PMC9719825
- DOI: 10.1016/j.ajo.2020.08.047
Aqueous Cytokine Expression and Higher Order OCT Biomarkers: Assessment of the Anatomic-Biologic Bridge in the IMAGINE DME Study
Abstract
Purpose: To identify biomarkers for predicting response to anti-vascular endothelial growth factor (VEGF) therapy in diabetic macular edema (DME) and evaluate any links between cytokine expression and optical coherence tomography (OCT) phenotype.
Design: The IMAGINE is a post hoc image analysis and cytokine expression assessment of the Efficacy & Safety Trial of Intravitreal Injections Combined With PRP for CSME Secondary to Diabetes Mellitus (DAVE) randomized clinical trial.
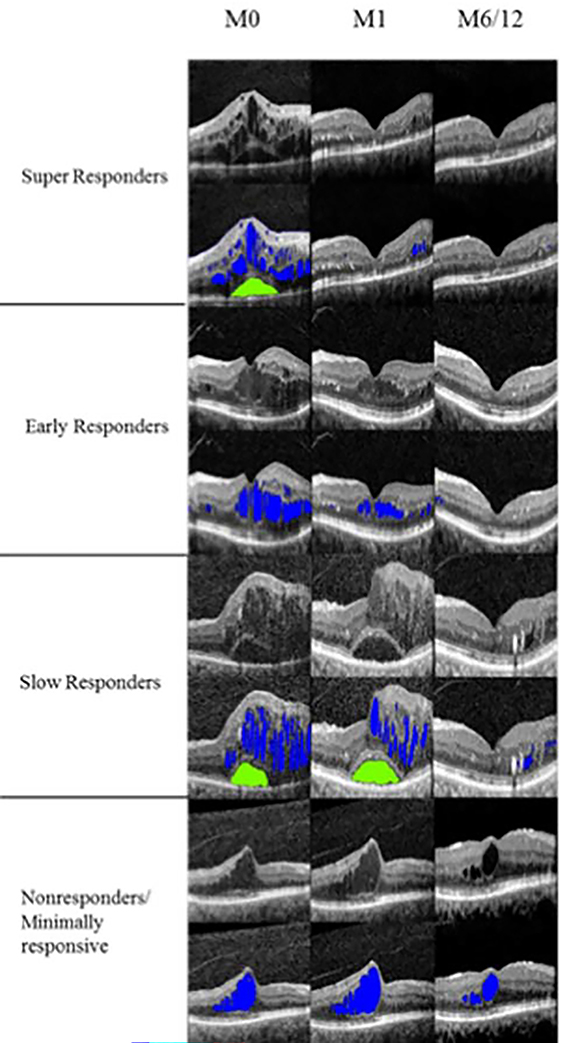
Methods: Subjects were categorized as anatomical responders or nonresponders, and within the responder group as rebounders and non-rebounders based on quantitative, longitudinal OCT criteria. Retinal layer and fluid features were extracted using an OCT machine-learning augmented segmentation platform. Responders were further sub-classified by rapidity of response. Aqueous concentrations of 54 cytokines were measured at multiple timepoints. Expression was compared between responder groups and correlated with OCT imaging biomarkers.
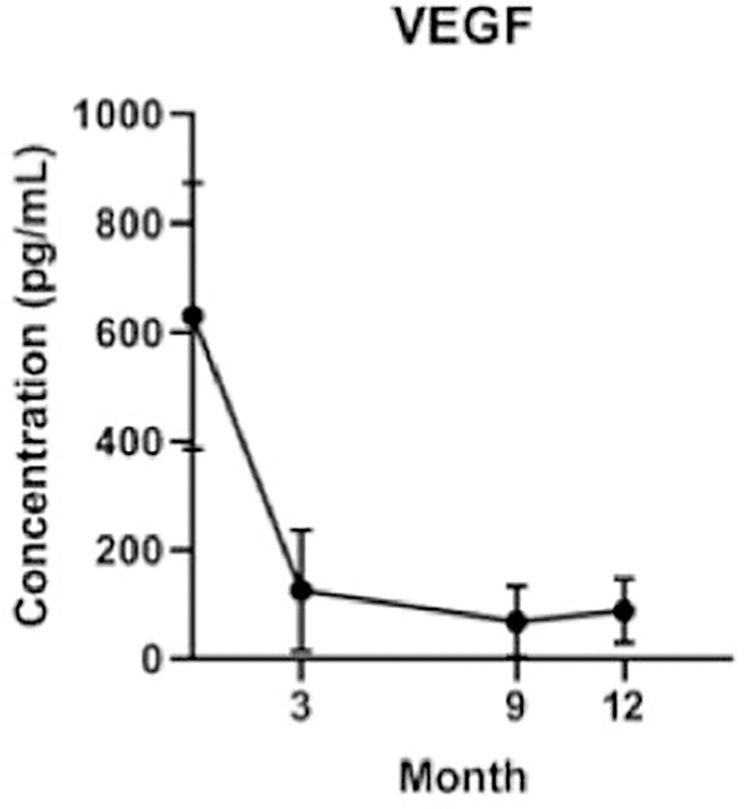
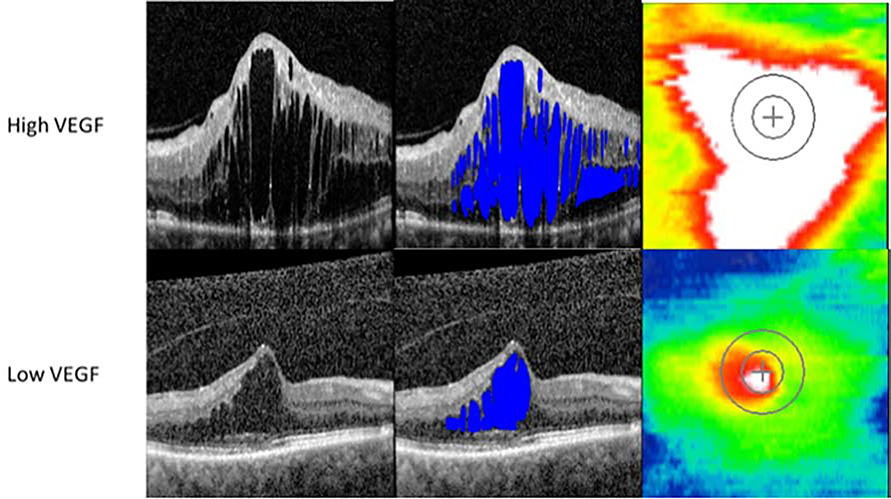
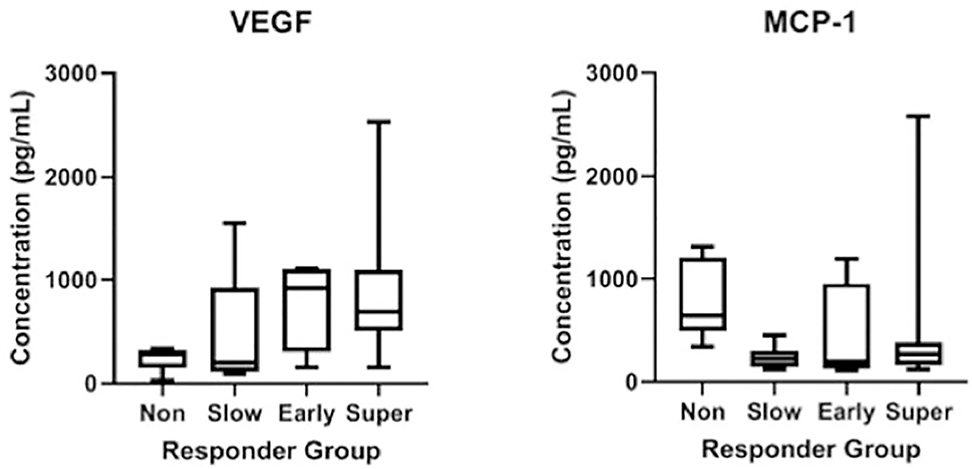
Results: Of the 24 eyes studied, 79% were anatomical responders with 38% super responders, 17% early responders, and 25% slow responders. Twenty-one percent were nonresponders. Super responders had increased baseline vascular endothelial growth factor (VEGF) (880.0 pg/mL vs 245.4 pg/mL; P = .012) and decreased monocyte chemotactic protein-1 (MCP-1) (513.3 pg/mL vs 809.5 pg/mL; P = .0.042) concentrations compared with nonresponders. Interleukin-6 (-24.9 pg/mL vs 442.8 pg/mL; P = .032) concentrations increased among nonresponders during therapy. VEGF concentrations correlated with central subfield thickness (r = 0.49; P = .01). Panmacular retinal volume correlated with increased interleuckin-6 (r = 0.47; P = .02) and decreased MCP-1 (r = -0.45; P = .03). Matrix metallopeptidase-1 correlated with subretinal fluid volume (r = 0.50; P = .01).
Conclusions: OCT imaging biomarkers correlated with both intraocular cytokines and responsiveness to anti-VEGF therapy, which indicated a possible link to underlying pathways and their relevance to DME prognosis. Baseline concentrations of VEGF and MCP-1 are associated with anatomic response to anti-VEGF therapy.
Copyright © 2020 Elsevier Inc. All rights reserved.
Figures
References
-
- Das A, McGuire PG, Rangasamy S. Diabetic Macular Edema: Pathophysiology and Novel Therapeutic Targets. Ophthalmology. 2015;122(7):1375–1394. - PubMed
-
- Wong TY, Cheung CMG, Larsen M, Sharma S, Simó R. Diabetic retinopathy. Nat Rev Dis Primers. 2016;2:16012. - PubMed
-
- Brown DM, Schmidt-Erfurth U, Do DV, et al. Intravitreal Aflibercept for Diabetic Macular Edema: 100-Week Results From the VISTA and VIVID Studies. Ophthalmology. 2015;122(10):2044–2052. - PubMed
-
- Heier JS, Korobelnik J-F, Brown DM, et al. Intravitreal Aflibercept for Diabetic Macular Edema: 148-Week Results from the VISTA and VIVID Studies. Ophthalmology. 2016;123(11):2376–2385. - PubMed
Publication types
MeSH terms
Substances
Grants and funding
LinkOut - more resources
Full Text Sources
Other Literature Sources
Medical
Research Materials
Miscellaneous
