. 2020 Oct:37:101703.
doi: 10.1016/j.redox.2020.101703. Epub 2020 Aug 27.

AIBP protects retinal ganglion cells against neuroinflammation and mitochondrial dysfunction in glaucomatous neurodegeneration

Affiliations

AIBP protects retinal ganglion cells against neuroinflammation and mitochondrial dysfunction in glaucomatous neurodegeneration

Soo-Ho Choi et al. Redox Biol. 2020 Oct.

Abstract

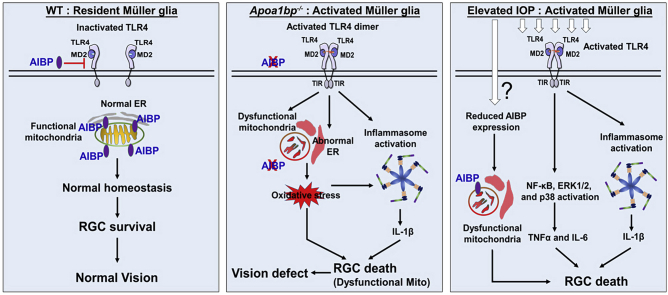
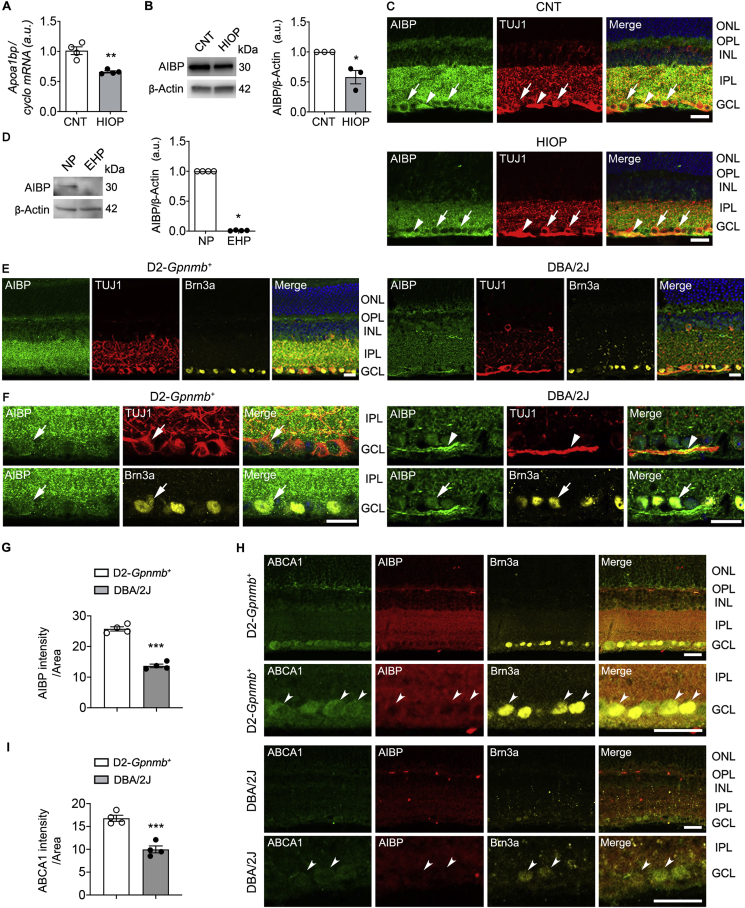
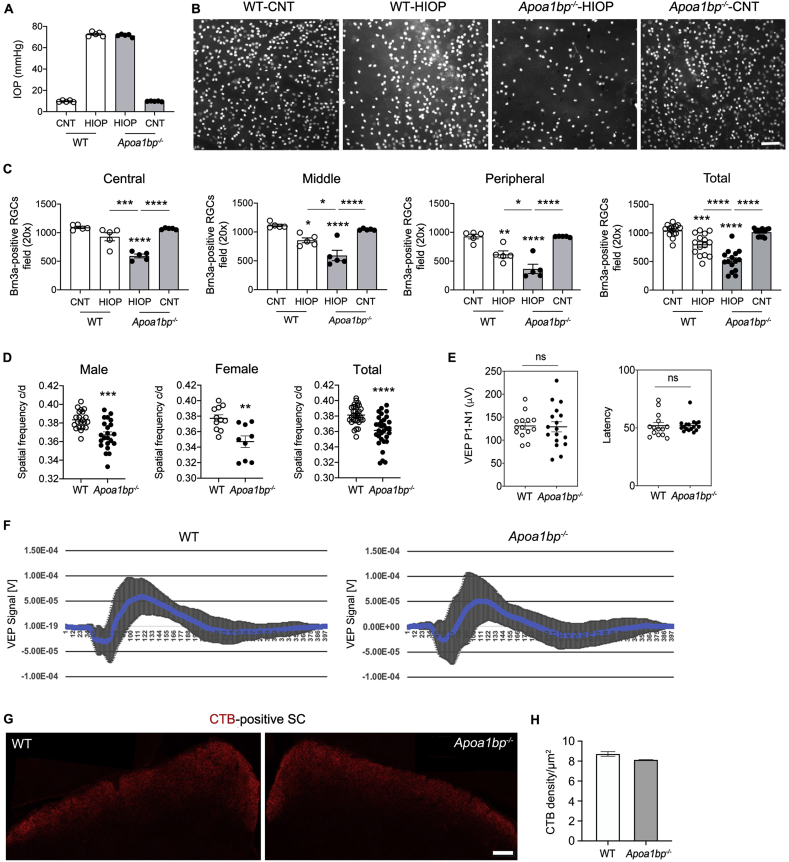
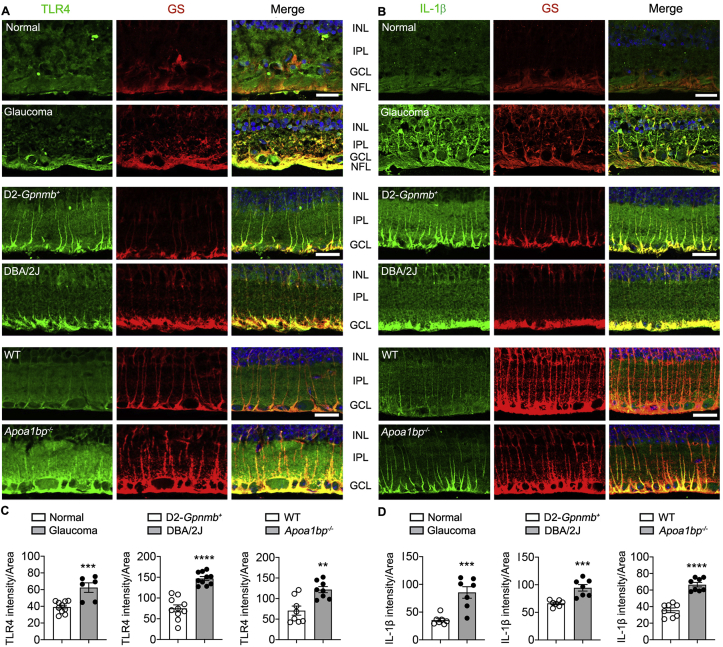
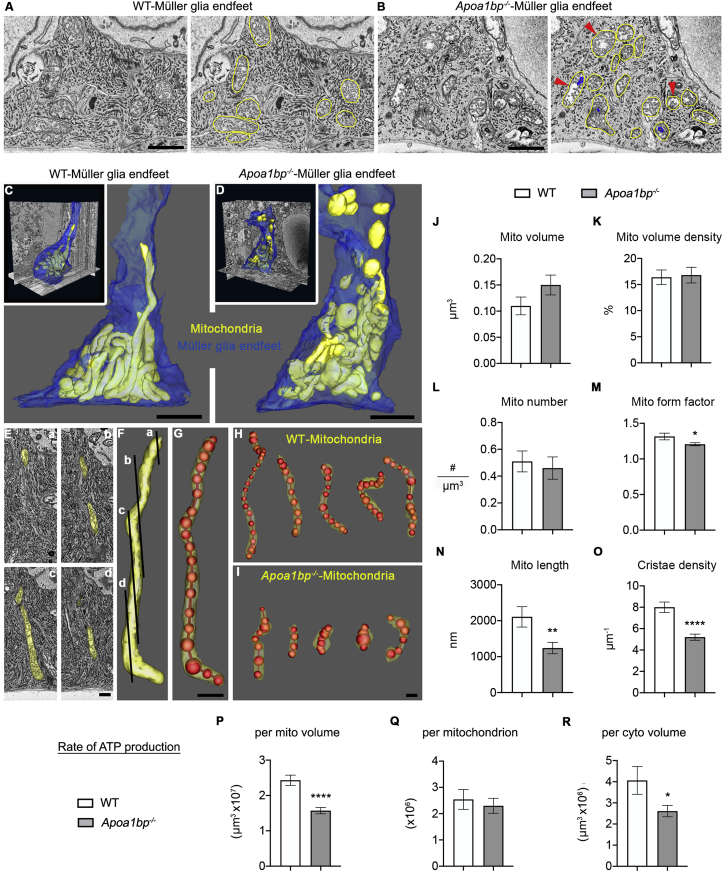
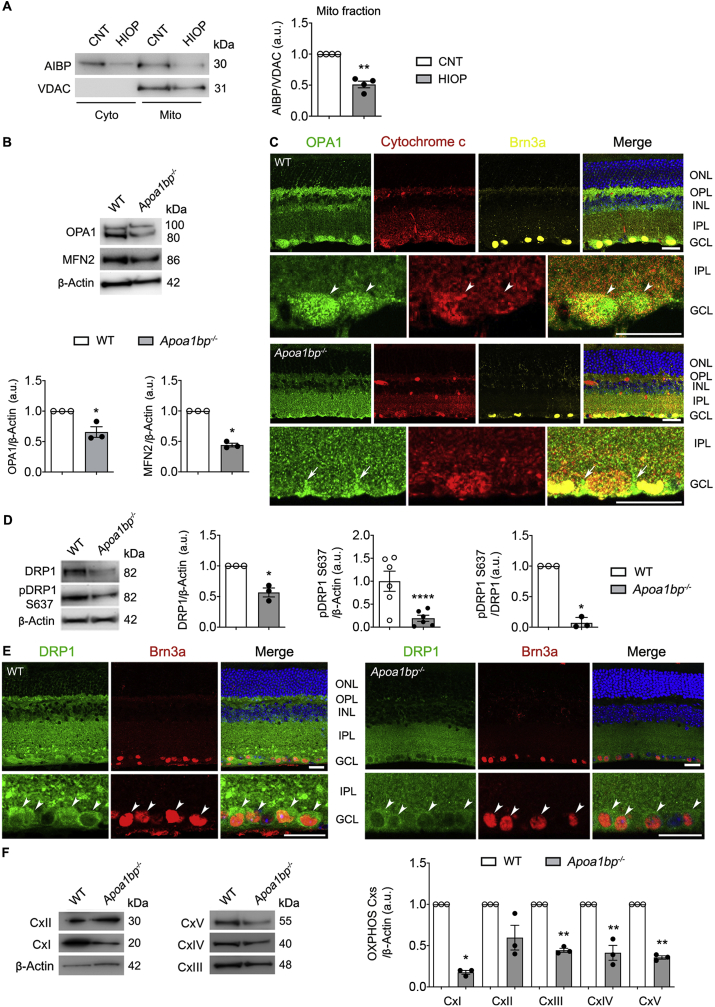
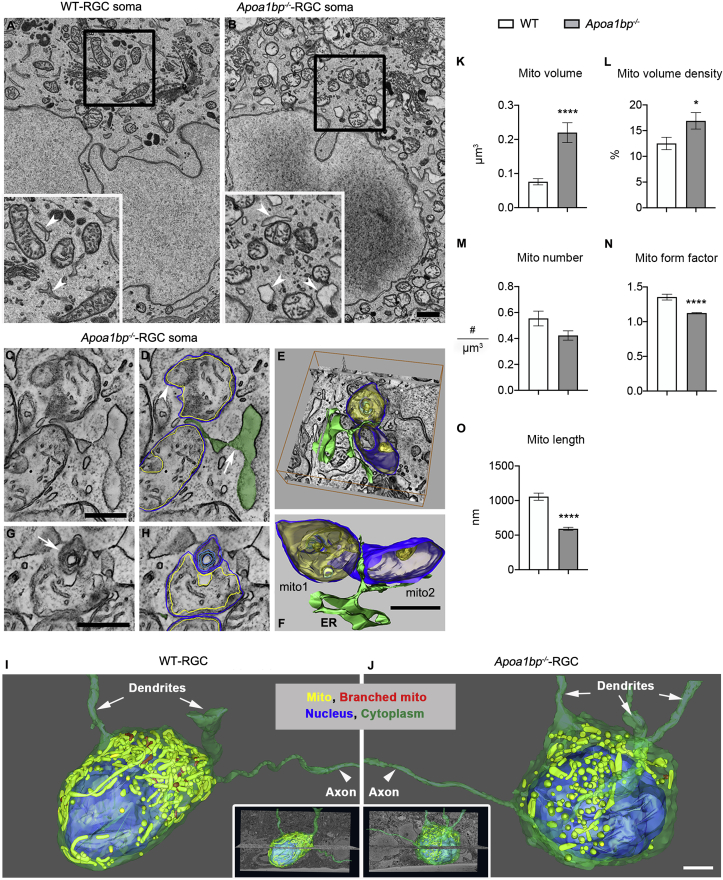
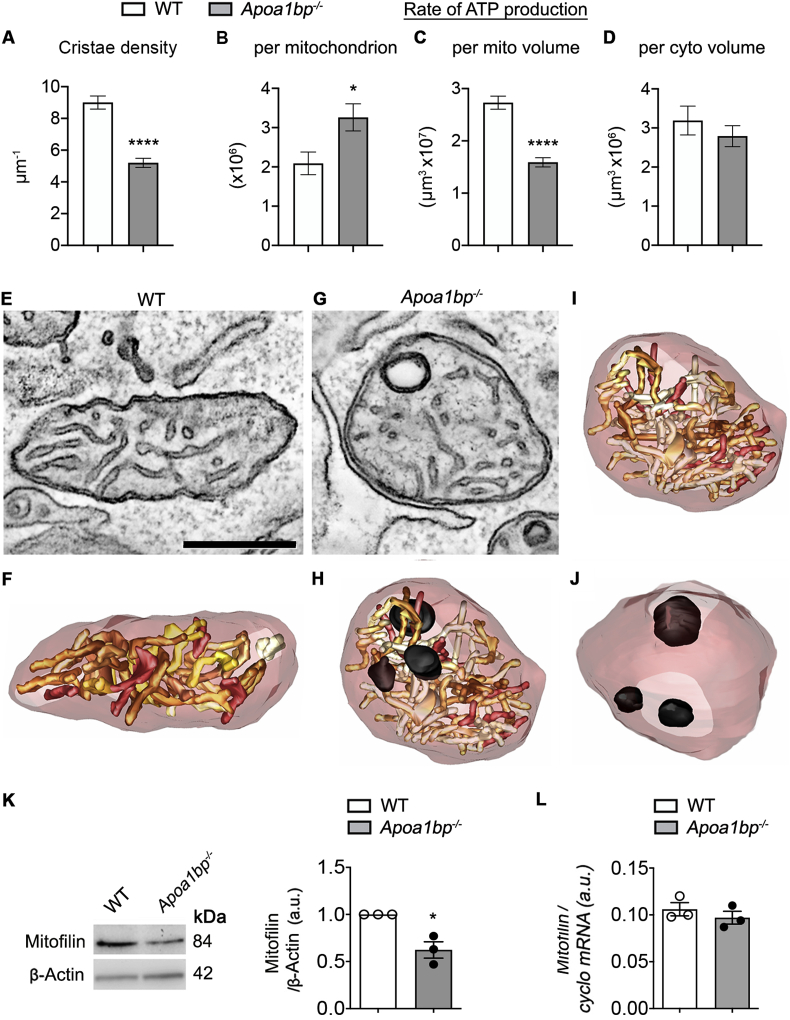
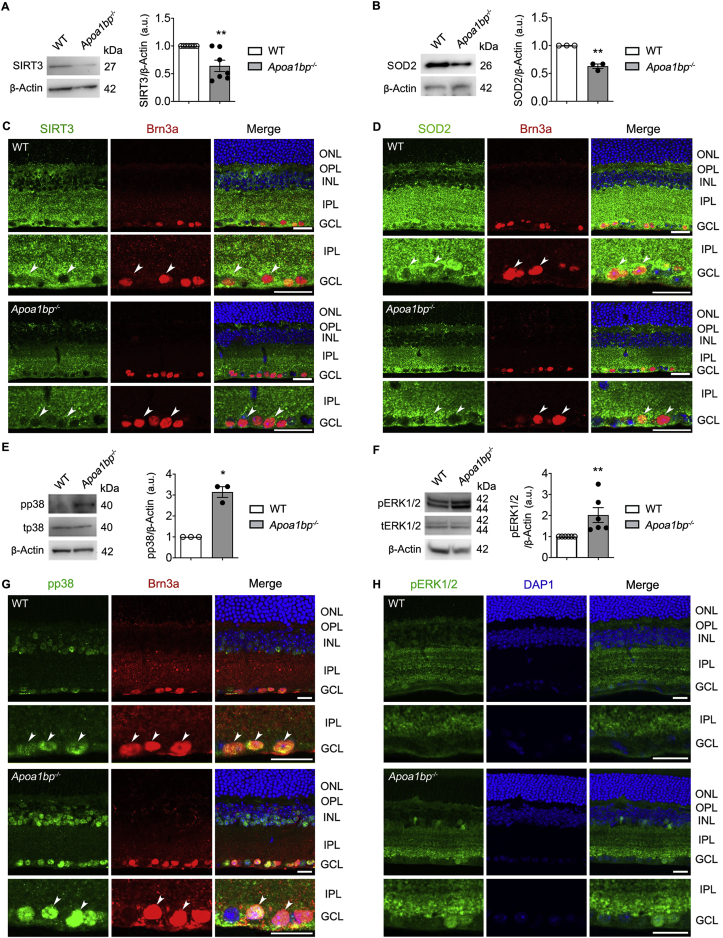
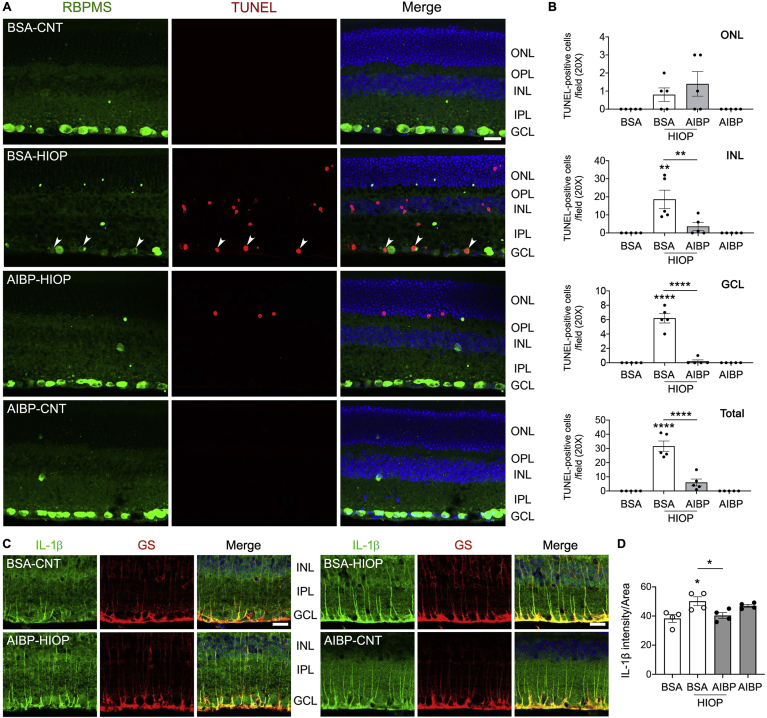
Glaucoma is a leading cause of blindness worldwide in individuals 60 years of age and older. Despite its high prevalence, the factors contributing to glaucoma progression are currently not well characterized. Glia-driven neuroinflammation and mitochondrial dysfunction play critical roles in glaucomatous neurodegeneration. Here, we demonstrated that elevated intraocular pressure (IOP) significantly decreased apolipoprotein A-I binding protein (AIBP; gene name Apoa1bp) in retinal ganglion cells (RGCs), but resulted in upregulation of TLR4 and IL-1β expression in Müller glia endfeet. Apoa1bp-/- mice had impaired visual function and Müller glia characterized by upregulated TLR4 activity, impaired mitochondrial network and function, increased oxidative stress and induced inflammatory responses. We also found that AIBP deficiency compromised mitochondrial network and function in RGCs and exacerbated RGC vulnerability to elevated IOP. Administration of recombinant AIBP prevented RGC death and inhibited inflammatory responses and cytokine production in Müller glia in vivo. These findings indicate that AIBP protects RGCs against glia-driven neuroinflammation and mitochondrial dysfunction in glaucomatous neurodegeneration and suggest that recombinant AIBP may be a potential therapeutic agent for glaucoma.

Keywords: AIBP; Glaucoma; Mitochondria; Müller glia; Neuroinflammation; Retinal ganglion cell.


Conflict of interest statement

W.K. Ju, S.H. Choi, and Y.I. Miller are co-inventors named on patents and patent applications by the University of California, San Diego. Y.I. Miller is a scientific co-founder of Raft Pharmaceuticals LLC. The terms of this arrangement have been reviewed and approved by the University of California, San Diego in accordance with its conflict of interest policies. The other authors declare that they have no conflict of interest.

Figures

Image 1
Graphical abstract
Fig. 1
Fig. 1
AIBP expression is decreased in glaucomatous retinas and pressure-induced RGCs. (A) Apoa1bp gene expression in control and injured retina at 1 day after acute IOP elevation. N = 4 mice. (B) AIBP protein expression in control and injured retina at 1 day after acute IOP elevation. N = 3 mice. (C) Representative images showed AIBP (green) and TUJ1 (red) immunoreactivities at 1 day after acute IOP elevation. Arrows indicate AIBP immunoreactivity co-labeled with TUJ1 in RGC somas and arrowhead indicates AIBP co-labeled with TUJ1 in RGC axon bundle. (D) AIBP protein expression in control and injured RGCs at 3 day after elevated HP. n = 3 independent experiments with cultures. (E) Representative images showed AIBP (green), TUJ1 (red) and Brn3a (yellow) immunoreactivities. (F) In higher magnification images, arrows indicate AIBP immunoreactivity co-labeled with TUJ1 in RGC somas and arrowhead indicates AIBP co-labeled with TUJ1 in RGC axon bundle. (G) Quantitative fluorescent intensity showed a significant decrease in AIBP immunoreactivity in the inner retina of glaucomatous DBA/2J mice. N = 4 mice. (H) Representative images showed ABCA1 (green), AIBP (red) and Brn3a (yellow) immunoreactivities. Concave arrowheads indicate ABCA1-positive RGCs co-labeled with AIBP and Brn3a. (I) Quantitative fluorescent intensity showed a significant decrease in ABCA1 immunoreactivity in the GCL of glaucomatous DBA/2J mice. N = 4 mice. Error bars represent SEM. Statistical significance determined using Student's t-test. *P < 0.05; **P < 0.01; ***P < 0.001. Blue is Hoechst 33342 staining. Scale bar: 20 μm. CNT, control; GCL, ganglion cell layer; HIOP, high intraocular pressure; EHP, elevated hydrostatic pressure; INL, inner nuclear layer; IPL, inner plexiform layer; N'P, no pressure; ONL, outer nuclear layer; OPL, outer plexiform layer. (For interpretation of the references to colour in this figure legend, the reader is referred to the Web version of this article.)
Fig. 2
Fig. 2
AIBP deficiency exacerbates vulnerability to elevated IOP in RGCs and triggers visual dysfunction. RGC loss was measured in the retina of 4 month-old WT and age-matched Apoa1bp−/− mice at 4 weeks after acute IOP elevation, and visual function were measured in 4-month-old Apoa1bp−/− mice. (A) The average of IOP elevation in WT mice. N = 5–7 mice. (B) Representative images from whole-mount immunohistochemistry showed Brn3a-positive RGCs in WT and Apoa1bp−/− following acute IOP elevation. (C) Quantitative analysis by RGC counting using whole-mount immunohistochemistry for Brn3a in WT and Apoa1bp−/− following acute IOP elevation. N = 5–7 mice. (D) Visual function test in WT and naïve Apoa1bp−/− mice by optomotor response analyses. N = 10–15 mice. (E) Visual function test in WT and naïve Apoa1bp−/− mice by VEP analyses. Note that there were no changes of VEP responses and latency in WT and naïve Apoa1bp−/− mice. N = 15 mice. (F) Total recordings of VEP responses. Left: total recordings of the VEP response of WT mice. Right: total recordings of the VEP response of naïve Apoa1bp−/− mice. (G) Representative images of CTB (red) labeling in the SCs of in WT and naïve Apoa1bp−/− mice. N = 3 mice. (H) Quantitative analysis of CTB fluorescence density in the SCs of WT and naïve Apoa1bp−/− mice. N = 3 mice. Error bars represent SEM. Statistical significance determined using one-way ANOVA or Student's t-test. *P < 0.05; **P < 0.01; ***P < 0.001; ****P < 0.0001. Scale bar: 100 μm (B and I); 20 μm (D). CNT, control; HIOP, high intraocular pressure; ns, not significant; SC, superior colliculus. (For interpretation of the references to colour in this figure legend, the reader is referred to the Web version of this article.)
Fig. 3
Fig. 3
Glaucomatous and Apoa1bp−/− Müller glia endfeet upregulate TLR4 and IL-1β expression. Immunohistochemical analyses for TLR4 and IL-1β were conducted on retina wax sections in glaucomatous and Apoa1bp−/− retina. (A and B) Representative images showed TLR4 and IL-1β immunoreactivities in Müller glia of the inner retinas from human patient with POAG, and glaucomatous DBA/2J and naïve Apoa1bp−/− mice. (C and D) Quantitative fluorescent intensity showed a significant increase in TLR4 and IL-1β immunoreactivities in Müller glia endfeets from human patient with POAG (n = 5 retina sections per group), and glaucomatous DBA/2J and naïve Apoa1bp−/− mice compared with control groups (n = 4 mice per group). Error bars represent SEM. Statistical significance determined using Student's t-test. **P < 0.01; ***P < 0.001; ****P < 0.0001. Blue is Hoechst 33342 staining. Scale bar: 20 μm (A and B). GCL, ganglion cell layer; INL, inner nuclear layer; IPL, inner plexiform layer; NFL, nerve fiber layer. (For interpretation of the references to colour in this figure legend, the reader is referred to the Web version of this article.)
Fig. 4
Fig. 4
AIBP deficiency induces mitochondrial fragmentation, outer membrane onion-like swirls, lower crista density, and reduces ATP production in Müller glia endfeet. (A) SBEM WT volume showing typical cytoplasmic structures; mitochondria (yellow trace) highlighted. (B) SBEM Apoa1bp−/− volume showing mitochondria (yellow trace) with lower crista density (red arrowheads) and dark outer membrane onion-like swirls (blue trace). (C) WT surface rendering (Volume: 4830 μm3 30μmx23 μmx7μm; voxel size: 3nm × 3nm × 50nm) highlighting long tubular mitochondria (yellow) (cytoplasmic membrane--blue). (D) Surface rendering (Volume: 4408 μm3, 29μmx19 μmx8μm; voxel size 3nm × 3nm × 50nm) showing short fragmented mitochondria (yellow) in Apoa1bp−/−. (E-G) Expedited and accurate segmentation and analysis of mitochondria. (E-F) Cross image planes (a–d) showing the need for 3DEM. 357 electron micrographs (50-nm step) were serially collected to follow many mitochondria through the large volume. (G) Approach to determine mitochondrial length (red) and variable shapes. (H) Surface rendering showing long tubular forms of mitochondria in WT. (I) Surface rendering showing smaller, round forms of mitochondria in Apoa1bp−/−. (J) The volume of mitochondria was not significantly different in the Apoa1bp−/−. (K) The mitochondrial volume density in the Apoa1bp−/− was almost identical to the WT. (L) No significant difference in the number of mitochondria between WT and Apoa1bp−/−. (M) The form factor for Apoa1bp−/− mitochondria was significantly lower, confirming less elongation. (N) The mitochondrial length was significantly lower in the Apoa1bp−/−. (O) The crista density was significantly lower in the Apoa1bp−/−. (P) The rate of ATP production per mitochondrial volume was lower in the Apoa1bp−/−. (Q) The modeled rate of ATP production per mitochondrion was no different in the Apoa1bp−/−. (R) There was a significant lowering of ATP availability per unit cellular volume in the Apoa1bp−/−. N = 3 Müller glia from 2 mice per group. Scale bars: 1 μm (A and B), 50 nm (C–I). (For interpretation of the references to colour in this figure legend, the reader is referred to the Web version of this article.)
Fig. 5
Fig. 5
AIBP deficiency impairs mitochondrial dynamics and OXPHOS activity in the retina. Mitochondrial AIBP expression was assessed in the retina of a mouse model of acute IOP elevation and alteration of mitochondrial dynamics and OXPHOS were assessed in the retina of WT and Apoa1bp−/− mice. (A) Using fractionation of cytosolic and mitochondrial extracts, mitochondrial AIBP protein expression in control and injured retina at 1 day after acute IOP elevation. N = 4 mice. (B) OPA1 and MFN2 protein expression in the retina of WT and Apoa1bp−/− mice. N = 3 mice. (C) Representative images showed OPA1 (green), cytochrome c (red) and Brn3a (yellow) immunoreactivities in the wax sections from WT and Apoa1bp−/− retinas. Arrowheads indicate accumulation of OPA1 co-labeled with cytochrome c in RGC somas in WT mice and arrows indicate OPA1-labeled Müller glia endfeet. N = 3 mice. (D) DRP1 and pDRP1 S637 expression in the retina of WT and Apoa1bp−/− mice. N = 3 mice. (E) Representative images showed DRP1 (green) and Brn3a (red) immunoreactivities in the wax sections from WT and Apoa1bp−/− retinas. Arrowheads indicate accumulation of DRP1 co-labeled with Brn3a in RGC somas in WT and Apoa1bp−/− mice. N = 3 mice. (F) OXPHOS Cxs protein expression in the retina of WT and Apoa1bp−/− mice. N = 3 mice. Error bars represent SEM. Statistical significance determined using Student's t-test. *P < 0.05; **P < 0.01; ****P < 0.0001. Blue is Hoechst 33342 staining. Scale bar: 20 μm. CNT, control; Cx, complex; GCL, ganglion cell layer; HIOP, high intraocular pressure; HP, hydrostatic pressure; INL, inner nuclear layer; IPL, inner plexiform layer; ONL, outer nuclear layer; OPL, outer plexiform layer. (For interpretation of the references to colour in this figure legend, the reader is referred to the Web version of this article.)
Fig. 6
Fig. 6
AIBP deficiency triggers mitochondrial fragmentation, swelling and rounding, and ER swelling in RGC somas. (A) Tomographic volume of WT RGC showing typical mitochondrial and ER structures. 2xinset displays well-formed mitochondria and ER (white arrowheads). (B) Tomographic volume of Apoa1bp−/− RGC showing rounded mitochondria with lower crista density and swollen ER. 2xinset displays swollen ER (white arrowheads), including one contacting a mitochondrion. (C) Apoa1bp−/− volume showing two adjacent mitochondria and ER sandwiched at their fission site. (D) Mitochondrial outer membrane (blue trace), IBM (yellow trace) and ER (green fill), partly dilated (arrow). Bulge in top mitochondrion (white arrowhead) caused by expansion of both outer and IBM. Inward bulge in bottom mitochondrion (black arrowhead) caused by expansion of the IBM only. (E) 3D Surface-rendering overlaid on a Apoa1bp−/− volume. (F) Even though many ER strands are dilated, mitochondrial fission can proceed in the Apoa1bp−/−. (G) Abnormal mitochondria with onion-like swirling membrane (white arrow) were common in the Apoa1bp−/−. (H) Onion-like swirl (blue) not part of the IBM (yellow). (I) Surface rendering of SBEM sub-volume (volume: 5814 μm3, 34μmx19 μmx9μm, voxel size:3nm × 3nm × 50nm) showing cytoplasmic membrane (green), neurites (green), nucleus (blue) long tubular form (yellow) and branched mitochondria (red) in the WT. (J) Surface rendering (volume: 7752 μm3, 34μmx19 μmx12μm, voxel size: 3nm × 3nm × 50nm) showing the cytoplasmic membrane, nucleus, dendrites and axons, and smaller round form (yellow) and branched (red) mitochondria in Apoa1bp−/−. (K–O) Measurements of structural features of mitochondria. (K) Volume of mitochondria was significantly greater in Apoa1bp−/−. (L) Mitochondrial volume density was higher in Apoa1bp−/-. (M) No significant difference in the number of mitochondria. (N) Form factor was significantly lower in the Apoa1bp−/−, confirming rounded mitochondria. (O) Mitochondria lengths were significantly decreased in the Apoa1bp−/−. N = 3 RGCs from 2 mice per group. Error bars represent SEM. Statistical significance determined using Student's t-test. *P < 0.05; ****P < 0.0001. Scale bars: 500 nm (A-H), 2 μm (I-J). (For interpretation of the references to colour in this figure legend, the reader is referred to the Web version of this article.)
Fig. 7
Fig. 7
AIBP deficiency reduces cristae density, ATP production and mitofilin protein expression in RGC mitochondria. (A) The mean crista density was significantly lower in the mitochondria of Apoa1bp−/− RGC somas. (B) The mean modeled rate of ATP production per mitochondrion was higher in the Apoa1bp−/− RGC soma. (C) The mean rate of ATP production per unit mitochondrial volume was lower in the Apoa1bp−/− RGC soma. (D) There was no significant lowering of modeled availability of ATP per unit cellular volume (P = 0.39). N = 3 RGCs from 2 mice per group. (E-J) The crista density was lower in the Apoa1bp−/− mitochondria due in part to onion-like outer membrane protuberances. Mitochondria-associated ER strands were often dilated. (E) A 4.2 nm-thick slice from a WT tomographic volume of RGC showing typical cristae. A well-formed ER strand is nearby (arrowhead). (F) Surface rendering of the segmented volume emphasizes the density of the cristae (shades of brown). The mitochondrial outer membrane is shown in translucent maroon. (G) A 4.2 nm-thick slice from an Apoa1bp−/− tomographic volume of RGC showing cristae that is less densely packed and an onion-like protuberance. An adjacent ER strand is dilated. (H) Surface rendering of the segmented volume emphasizes the less-dense cristae packing and the 3 protuberances (black) that occupy part of the volume that would normally have been occupied by cristae. (I) Surface rendering without the protuberances emphasizes the part of the volume not occupied by cristae (arrow points to one of these volumes). (J) Surface rendering showing only the protuberances to highlight their size relative to the mitochondrial volume. (K) Mitofilin protein expression was assessed by Western blot analysis in WT and Apoa1bp−/− retinas. N = 4 mice. (L) Mitofilin gene expression was assessed by quantitative PCR analysis in WT and Apoa1bp−/− retinas. N = 3 mice. Error bars represent SEM. Statistical significance determined using Student's t-test. *P < 0.05. Scale bars: 500 nm. (For interpretation of the references to colour in this figure legend, the reader is referred to the Web version of this article.)
Fig. 8
Fig. 8
AIBP deficiency induces oxidative stress and activates MAPK signaling in the retina. Oxidative stress and MAPKs signaling were assessed in the retina of WT and Apoa1bp−/− mice. (A and B) SIRT3 and SOD2 protein expression in the retina of WT and Apoa1bp−/− mice. N = 3–7 mice. (C and D) Representative images showed SIRT3 (green), SOD2 (green) and Brn3a (red) immunoreactivities in the wax sections from WT and Apoa1bp−/− retinas. Arrowheads indicate accumulation of SIRT3 or SOD2 co-labeled with Brn3a in RGC somas in WT and Apoa1bp−/− mice. N = 3 mice. (E and F) Phospho-p38 (pp38) and phospho-ERK1/2 (pERK1/2) protein expression in the retina of WT and Apoa1bp−/− mice. N = 3–6 mice. (G and H) Representative images showed pp38 (green), pERK1/2 (green) and Brn3a (red) immunoreactivities in WT and Apoa1bp−/− retinas. Arrowheads indicate accumulation of phospho-p38 co-labeled with Brn3a in RGC somas in WT and Apoa1bp−/− mice. N = 3 mice. Error bars represent SEM. Statistical significance determined using Student's t-test. *P < 0.05; **P < 0.01. Blue is Hoechst 33342 staining. Scale bar: 20 μm. GCL, ganglion cell layer; INL, inner nuclear layer; IPL, inner plexiform layer; ONL, outer nuclear layer; OPL, outer plexiform layer. (For interpretation of the references to colour in this figure legend, the reader is referred to the Web version of this article.)
Fig. 9
Fig. 9
AIBP promotes RGC survival and prevents glia-mediated inflammatory responses against elevated pressure. Apoptotic cell death was assessed in a mouse model of acute IOP elevation, and IL-1β immunoreactivity was assessed in retinal Müller glia. (A and B) Recombinant AIBP protein or BSA (1 μL, 0.5 mg/ml) was intravitreally injected at 2 days before acute IOP elevation and assessed TUNEL-positive cells in the retina of WT mice at 1 day after acute IOP elevation. Following RBPMS (green) immunohistochemistry, TUNEL (red) staining was conducted. (A) Representative images showed RBPMS-positive RGCs in the GCL and TUNEL-positive cells in the retinas. (B) Quantitative analysis by TUNEL-positive cell counting. N = 5 mice. (C) Representative images showed IL-1β immunoreactivity in the inner retina. (D) Quantitative analyses for fluorescent intensity showed that AIBP treatment significantly decreased in IL-1β immunoreactivity in Müller glia endfeets against elevated IOP. n = 4 mice. Error bars represent SEM. Statistical significance determined using one-way ANOVA or Student's t-test. *P < 0.05; **P < 0.01; ***P < 0.001; ****P < 0.0001. Blue is Hoechst 33342 staining. Scale bar: 20 μm. BSA, bovine serum albumin; CNT, control; GCL, ganglion cell layer; EHP, elevated hydrostatic pressure; HIOP, high intraocular pressure; INL, inner nuclear layer; IPL, inner plexiform layer; NP, no pressure; ONL, outer nuclear layer; OPL, outer plexiform layer. (For interpretation of the references to colour in this figure legend, the reader is referred to the Web version of this article.)

References

    1. Chen H. Commensal microflora-induced T cell responses mediate progressive neurodegeneration in glaucoma. Nat. Commun. 2018;9:3209. - PMC - PubMed
    1. Williams P.A., Marsh-Armstrong N., Howell G.R., Lasker I.I.o.A., Glaucomatous Neurodegeneration P. Neuroinflammation in glaucoma: a new opportunity. Exp. Eye Res. 2017;157:20–27. - PMC - PubMed
    1. Ritter M. Cloning and characterization of a novel apolipoprotein A-I binding protein, AI-BP, secreted by cells of the kidney proximal tubules in response to HDL or ApoA-I. Genomics. 2002;79:693–702. - PubMed
    1. Fang L. Control of angiogenesis by AIBP-mediated cholesterol efflux. Nature. 2013;498:118–122. - PMC - PubMed
    1. Marbaix A.Y. Extremely conserved ATP- or ADP-dependent enzymatic system for nicotinamide nucleotide repair. J. Biol. Chem. 2011;286:41246–41252. - PMC - PubMed

Publication types