Observational Study
. 2021 Jan;14(1):288-298.
doi: 10.1111/cts.12858. Epub 2020 Sep 3.

Genistein-Calcitriol Mitigates Hyperosmotic Stress-Induced TonEBP, CFTR Dysfunction, VDR Degradation and Inflammation in Dry Eye Disease

Affiliations
Observational Study

Genistein-Calcitriol Mitigates Hyperosmotic Stress-Induced TonEBP, CFTR Dysfunction, VDR Degradation and Inflammation in Dry Eye Disease

Trailokyanath Panigrahi et al. Clin Transl Sci. 2021 Jan.

Abstract

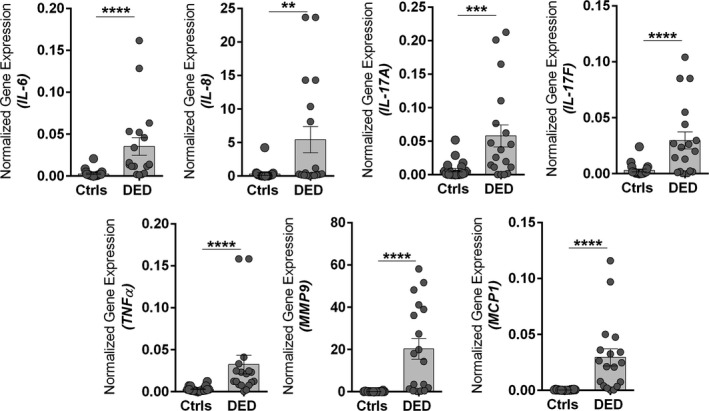
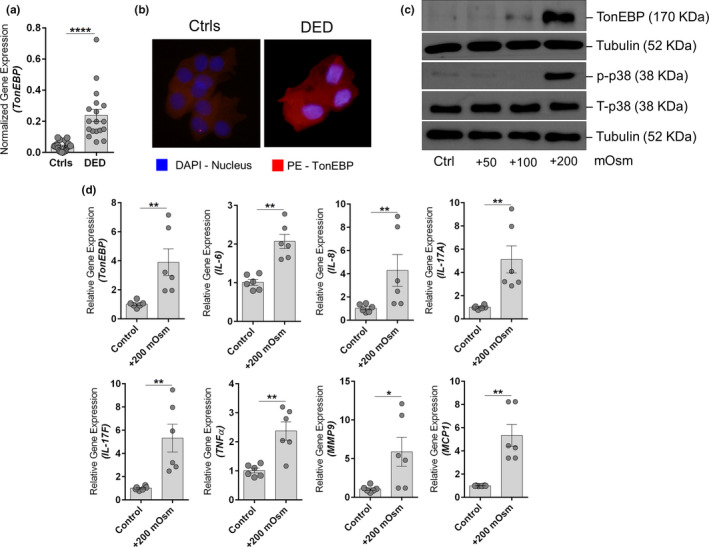
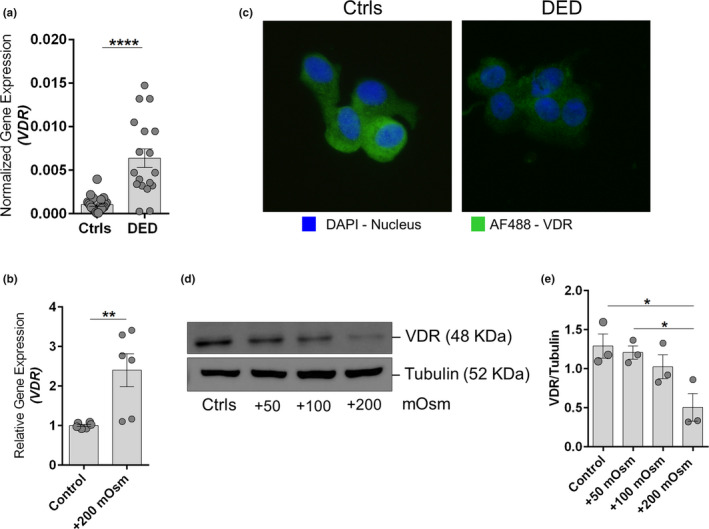
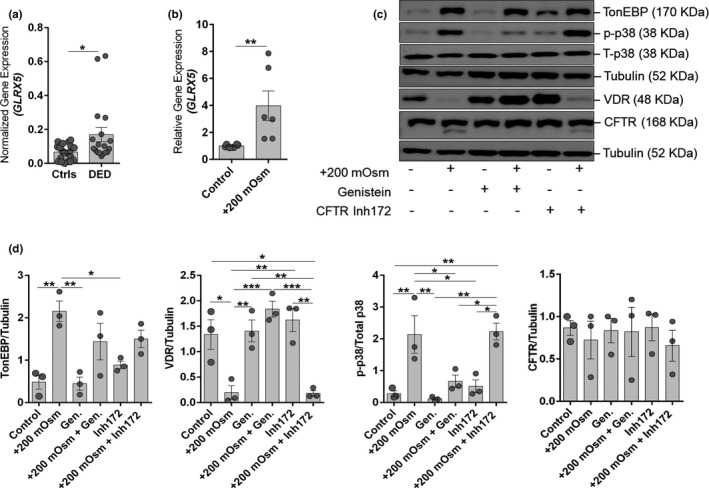
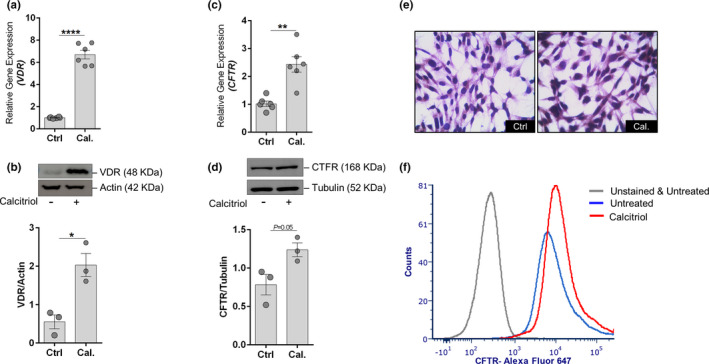
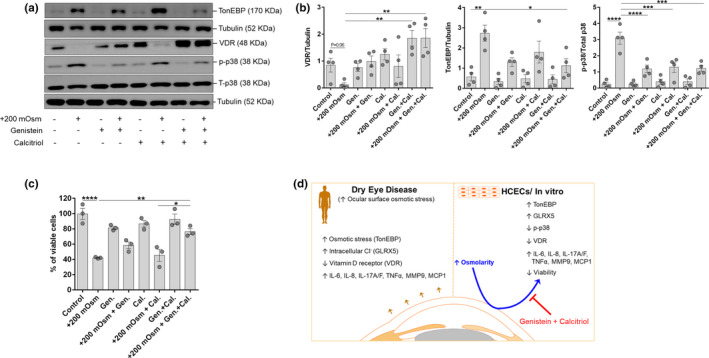
Dry eye disease (DED) signs and symptoms are causally associated with increased ocular surface (OS) inflammation. Modulation of key regulators of aberrant OS inflammation is of interest for clinical management. We investigated the status and the potential to harness key endogenous protective factors, such as cystic fibrosis transmembrane conductance regulator (CFTR) and vitamin D receptor (VDR) in hyperosmotic stress-associated inflammation in patients with DED and in vitro. Conjunctival impression cytology samples from control subjects (n = 11) and patients with DED (n = 15) were used to determine the status of hyperosmotic stress (TonEBP/NFAT5), inflammation (IL-6, IL-8, IL-17A/F, TNFα, MMP9, and MCP1), VDR, and intracellular chloride ion (GLRX5) by quantitative polymerase chain reaction and/or immunofluorescence. Human corneal epithelial cells (HCECs) were used to study the effect of CFTR activator (genistein) and vitamin D (calcitriol) in hyperosmotic stress (HOs)-induced response in vitro. Western blotting was used to determine the expression of these proteins, along with p-p38. Significantly, higher expression of inflammatory factors, TonEBP, GLRX5, and reduced VDR were observed in patients with DED and in HOs-induced HCECs in vitro. Expression of TonEBP positively correlated with expression of inflammatory genes in DED. Increased TonEBP and GLRX5 provides confirmation of osmotic stress and chloride ion imbalance in OS epithelium in DED. These along with reduced VDR suggests dysregulated OS homeostasis in DED. Combination of genistein and calcitriol reduced HOs-induced TonEBP, inflammatory gene expression, and p-p38, and abated VDR degradation in HCECs. Henceforth, this combination should be further explored for its relevance in the management of DED.


Conflict of interest statement

The authors declare no competing interests for this work.

Figures

Figure 1
Figure 1
Increased ocular surface inflammation in patients with dry eye disease (DED). The graphs indicate mRNA expression levels of IL‐6, IL‐8, IL‐17A, IL‐17F, TNFα, MMP9, and MCP1 normalized to expression of GAPDH (housekeeping gene) in conjunctival impression cytology samples of control (Ctrl) subjects (n = 11) and patients with DED (n = 9). Scatter plot with bar indicates mean ± SEM and data points from two technical replicates for each subject. **P < 0.01, ***P < 0.001, ****P < 0.0001, Mann–Whitney U test.
Figure 2
Figure 2
Hyperosmotic stress status and effects in patients with dry eye disease (DED) and human corneal epithelial cells (HCECs). (a) Graphs indicate the mRNA expression level of TonEBP normalized to expression of GAPDH (housekeeping gene) in conjunctival impression cytology (CIC) samples of control (Ctrl) subjects (n = 11) and patients with DED (n = 9). Scatter plot with bar indicates mean ± SEM and data points from two technical replicates for each subject. ****P < 0.0001, Mann–Whitney U test. (b) The panels exhibit the protein expression TonEBP in cells obtained by CIC from control subjects (n = 3) and patients with DED (n = 3) using immunofluorescence (40× magnification; DAPI – nuclear stain; PE – TonEBP). Images shown are representative of three different fields from three subjects in each group. Note: Sufficient cells for immunofluorescence imaging from CIC samples could only be obtained from three of the six CIC samples collected from DED subjects. (c) Panels shows the protein level of TonEBP, phosphorylated p38, total p38, and tubulin in HCECs following exposure to different doses of hyperosmotic stress (+50 mOsm, +100 mOsm, and +200 mOsm) for 24 hours in vitro. Tubulin was used as protein loading controls. The blots shown are representative images of three independent experiments. (d) Graphs indicate mean mRNA expression of TonEBP, IL‐6, IL‐8, IL‐17A, IL‐17F, TNFα, MMP9, and MCP1 normalized to expression of β‐Actin (housekeeping gene) in human HCECs in vitro following exposure to hyperosmotic stress (+200 mOsm) for 6 hours. The categories include untreated cells (Ctrl), cells under hyperosmotic stress (+200 mOsm). Scatter plot with bar indicates mean ± SEM and data points from two technical replicates for each of the three independent experiments. *P < 0.05, **P < 0.01, Mann–Whitney U test. The graphs shown in panel (d) are controls and + 200 mOsm groups from experiments shown in Figure S4 b.
Figure 3
Figure 3
Decreased vitamin D receptor expression in patients with dry eye disease (DED) and in human corneal epithelial cells (HCECs) under hyperosmotic stress. (a) The graph indicates mRNA expression level of vitamin D receptor (VDR) normalized to expression of GAPDH (housekeeping gene) in conjunctival impression cytology (CIC) samples of control (Ctrl) subjects (n = 11) and patients with DED (n = 9). Scatter plot with bar indicates mean ± SEM and data points from two technical replicates for each subject. ****P < 0.0001; Mann–Whitney U test. (b) Graph indicates mean mRNA expression of VDR normalized to expression of β‐Actin (housekeeping gene) in HCECs in vitro following exposure to hyperosmotic stress (+200 mOsm) for 6 hours. Scatter plot with bar indicates mean ± SEM and data points from two technical replicates for each of the three independent experiments. **P < 0.01; Mann–Whitney U test. (c) The panels exhibit the protein expression VDR in cells obtained by CIC from control subjects (n = 3) and patients with DED (n = 3) using immunofluorescence (40× magnification; DAPI – nuclear stain; AF488 – VDR). Images shown are representative of three different fields from three subjects in each group. Note: Sufficient cells for immunofluorescence imaging from CIC samples could only be obtained from three of the six CIC samples collected from DED subjects. (d) Panels shows the protein level of VDR and tubulin in HCECs following exposure to different doses of hyperosmotic stress (+50 mOsm, +100 mOsm, and +200 mOsm) for 24 hours in vitro. Tubulin was used as protein loading controls. The blots shown are representative images of three independent experiments. (e) Graph indicates quantification of protein expression of the immunoblot by densitometry analysis. The expression of the VDR protein is indicated as ratio of respective protein to tubulin (indicated in the Y‐axis). Scatter plot with bar indicates mean ± SEM and data point from each of the three independent experiments. *P < 0.05, one‐way analysis of variance (ANOVA) with Tukey’s multiple comparisons test. The categories include untreated cells (Control), cells under hyperosmotic stress (+200 mOsm).
Figure 4
Figure 4
Increased intracellular chloride ion responsive gene expression in patients with dry eye disease (DED) and in human corneal epithelial cells (HCECs) undergoing hyperosmotic stress and activation of cystic fibrosis transmembrane conductance regulator (CFTR) alleviates hyperosmotic stress induced effects in human corneal epithelial cells. (a) Graph indicate the mRNA expression level of GLRX5 normalized to expression of GAPDH (housekeeping gene) in conjunctival impression cytology samples of control subjects (n = 11) and patients with DED (n = 9). Scatter plot with bar indicates mean ± SEM and data points from two technical replicates for each subject. *P < 0.05, Mann–Whitney U test. (b) Graph indicates mRNA expression of GLRX5 normalized to expression of β‐Actin (housekeeping gene) in human HCECs in vitro following exposure to hyperosmotic stress (+200 mOsm) for 6 hours. Scatter plot with bar indicates mean ± SEM and data points from two technical replicates for each of the three independent experiments. **P < 0.01, Mann–Whitney U test. (c) Panel shows the protein level of TonEBP, vitamin D receptor (VDR), phosphorylated p38, total p38, CFTR, and tubulin in HCECs following exposure to hyperosmotic stress (+200 mOsm) with or without genistein (CFTR activator) or CFTR inh172 (CFTR inhibitor) for 24 hours in vitro. Tubulin was used as protein loading control. The blots shown are representative images of three independent experiments. (d) Panels exhibits quantification of protein expression of the immunoblot by densitometry analysis. The expression of the protein is indicated as ratio of respective protein to Tubulin (indicated in the Y‐axis). The expression of p38 was quantified by normalizing its level to total p38 expression (indicated in the Y‐axis). Scatter plot with bar indicates mean ± SEM and data point from each of the three independent experiments. *P < 0.05, **P < 0.01, ***P < 0.001, one‐way analysis of variance (ANOVA) with Tukey’s multiple comparisons test.
Figure 5
Figure 5
Calcitriol induces the expression of cystic fibrosis transmembrane conductance regulator (CFTR) in human corneal epithelial cells (HCECs). (a) Graph shows the mRNA expression level of vitamin D receptor (VDR) in HCECs treated with calcitriol for 6 hours. Scatter plot with bar indicates mean ± SEM and data points from two technical replicates for each of the three independent experiments. ****P < 0.0001, Mann–Whitney U test. (b) Panels shows the protein level of VDR in HCECs following calcitriol treatment for 24 hours in vitro. The bar graph represents the densitometry quantification of VDR protein normalized to its loading control beta‐actin. Scatter plot with bar indicates mean ± SEM and data point from each of the three independent experiments. *P < 0.05, unpaired t test with Welch’s correction. (c) Graph shows the mRNA expression level of CFTR in HCECs treated with calcitriol for 6 hours. Scatter plot with bar indicates mean ± SEM and data points from two technical replicates for each of the three independent experiments. **P < 0.01, Mann–Whitney U test. (d) Panels shows the protein level of CFTR in HCECs following calcitriol treatment for 24 hours in vitro. The bar graph represents the densitometry quantification of CFTR protein normalized to its loading control beta‐actin. Scatter plot with bar indicates mean ± SEM and data point from each of the three independent experiments. P = 0.05, unpaired t test with Welch’s correction. (e) Panels shows light microscopy images (40× magnification) of HCECs immunostained for CFTR following calcitriol treatment for 24 hours in vitro. Images shown are representative of three different fields from three independent experiments. (f) Histogram shows cell surface expression of CFTR using flow cytometry in HCECs following calcitriol treatment for 24 hours in vitro. Histogram shown is a representative of three independent experiments.
Figure 6
Figure 6
Combined effect of genistein (Gen.) and calcitriol (Cal.) mitigates hyperosmotic stress‐induced effects in human corneal epithelial cells. (a) Panel shows the protein level of TonEBP, vitramin D receptor (VDR), phosphorylated p38, total p38 and Tubulin in human corneal epithelial cells (HCECs) following exposure to hyperosmotic stress (+200 mOsm) with or without genistein and/or calcitriol for 24 hours in vitro. Tubulin was used as protein loading control. The blots shown are representative images of four independent experiments. (b) Panels exhibits quantification of protein expression of the immunoblot by densitometry analysis. The expression of the protein is indicated as ratio of respective protein to Tubulin (indicated in the Y‐axis). The expression of p38 was quantified by normalizing its level to total p38 expression (indicated in the Y‐axis). Scatter plot with bar indicates mean ± SEM and data point from each of the four independent experiments. *P < 0.05, **P < 0.01, ***P < 0.001, ****P < 0.0001, one‐way analysis of variance (ANOVA) with Tukey’s multiple comparisons test. (c) The graph indicates percentage of viable cells following exposure of HCECs under hyperosmotic stress (+200 mOsm) with or without genistein and/or calcitriol for 24 hours in vitro. The viability of cells was determined by crystal violet assay and scatter plot with bar indicates mean ± SEM and data point from each of the three independent experiments. *P < 0.05, **P < 0.01, ****P < 0.0001, one‐way ANOVA with Tukey’s multiple comparisons test. (d) Schema summarizes the observations made in the study. Briefly, increased osmotic stress, intracellular chloride ion and inflammatory factors, and reduced VDR in patients with DED and in HCECs exposed to hyperosmotic stress. Combined use of genistein and calcitriol mitigated hyperosmotic stress induced effects in human corneal epithelial cells, indicating the potential for its use in the management of dry eye disease.

References

    1. Craig, J.P. et al TFOS DEWS II definition and classification report. Ocul. Surf. 15, 276–283 (2017). - PubMed
    1. Stapleton, F. et al TFOS DEWS II epidemiology report. Ocul. Surf. 15, 334–365 (2017). - PubMed
    1. Belmonte, C. et al TFOS DEWS II pain and sensation report. Ocul. Surf. 15, 404–437 (2017). - PMC - PubMed
    1. Jones, L. et al TFOS DEWS II management and therapy report. Ocul. Surf. 15, 575–628 (2017). - PubMed
    1. Rosenthal, P. , Baran, I. & Jacobs, D.S. Corneal pain without stain: is it real? Ocul. Surf. 7, 28–40 (2009). - PubMed

Publication types

MeSH terms