. 2020 Jun 22;13(4):693-709.
doi: 10.1093/ckj/sfaa048. eCollection 2020 Aug.

The ERA-EDTA Registry Annual Report 2017: a summary

Affiliations

The ERA-EDTA Registry Annual Report 2017: a summary

Anneke Kramer et al. Clin Kidney J. .

Abstract

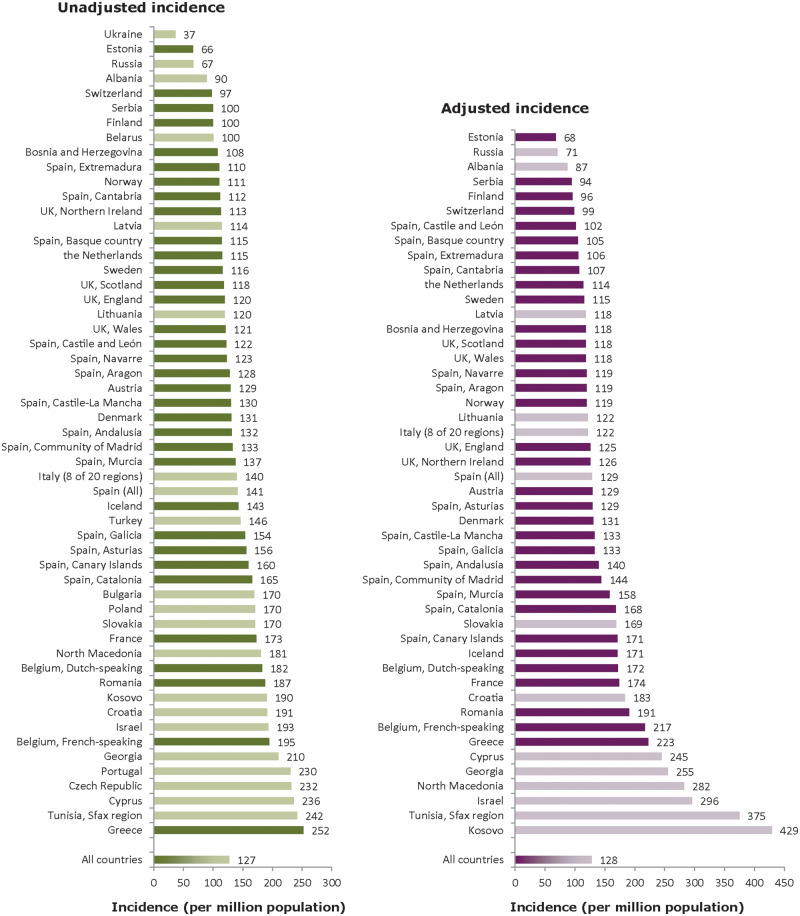
Background: This article presents a summary of the 2017 Annual Report of the European Renal Association-European Dialysis and Transplant Association (ERA-EDTA) Registry and describes the epidemiology of renal replacement therapy (RRT) for end-stage renal disease (ESRD) in 37 countries.

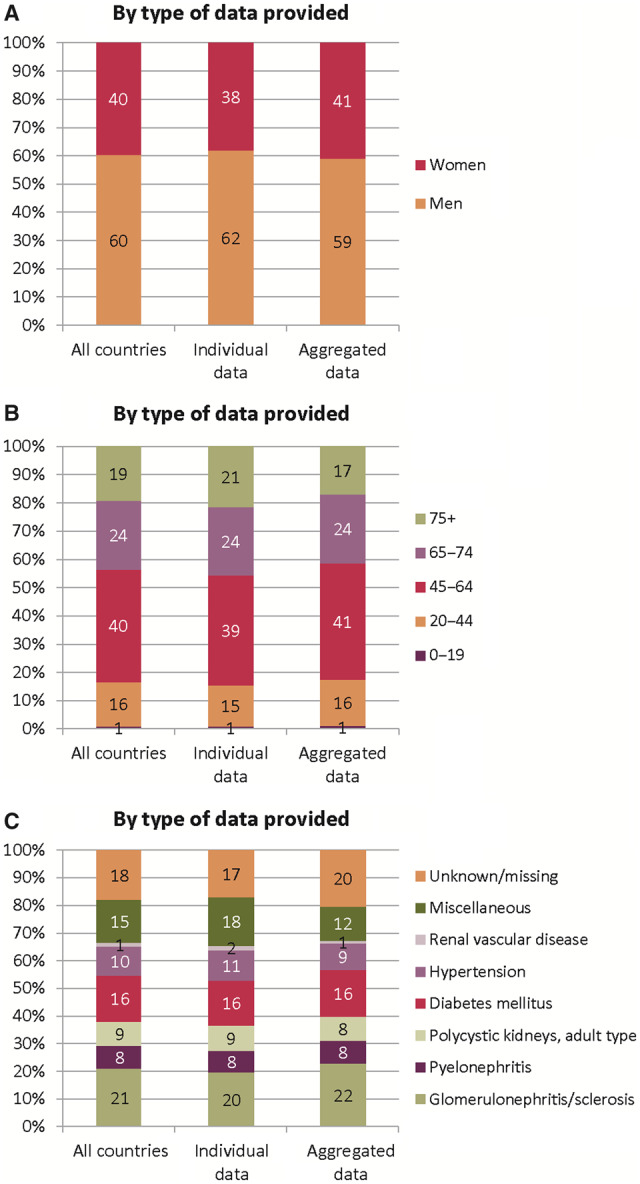
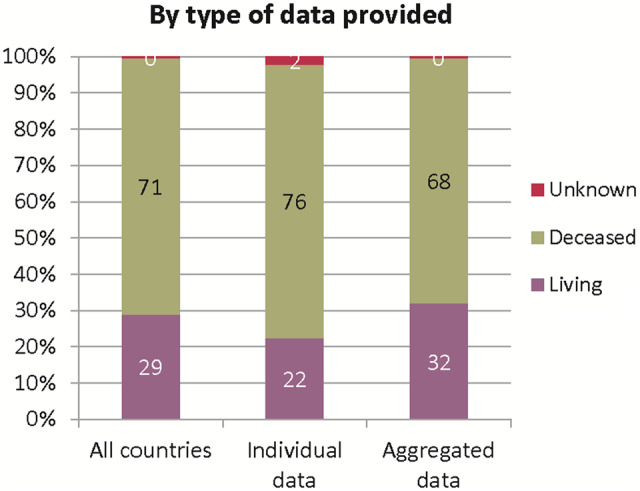
Methods: The ERA-EDTA Registry received individual patient data on patients undergoing RRT for ESRD in 2017 from 32 national or regional renal registries and aggregated data from 21 registries. The incidence and prevalence of RRT, kidney transplantation activity and survival probabilities of these patients were calculated.

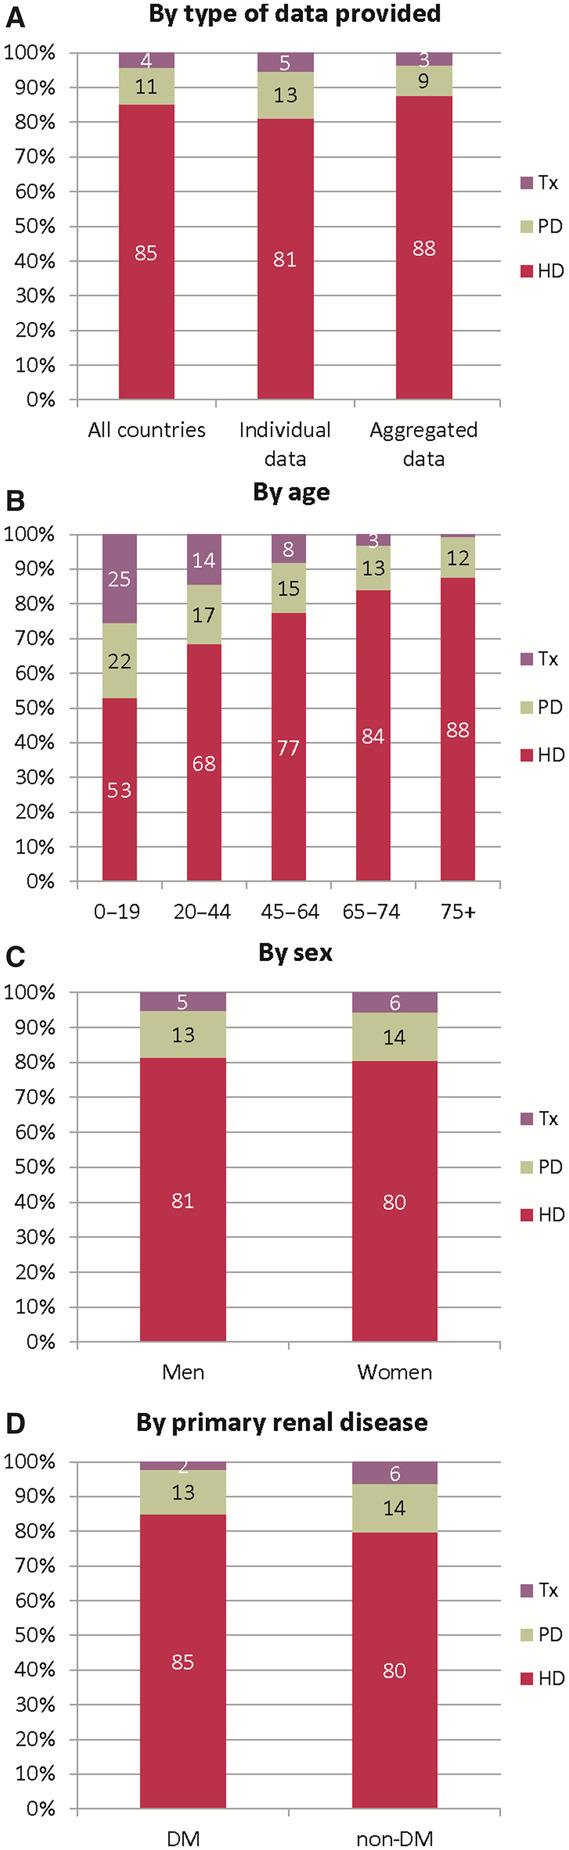
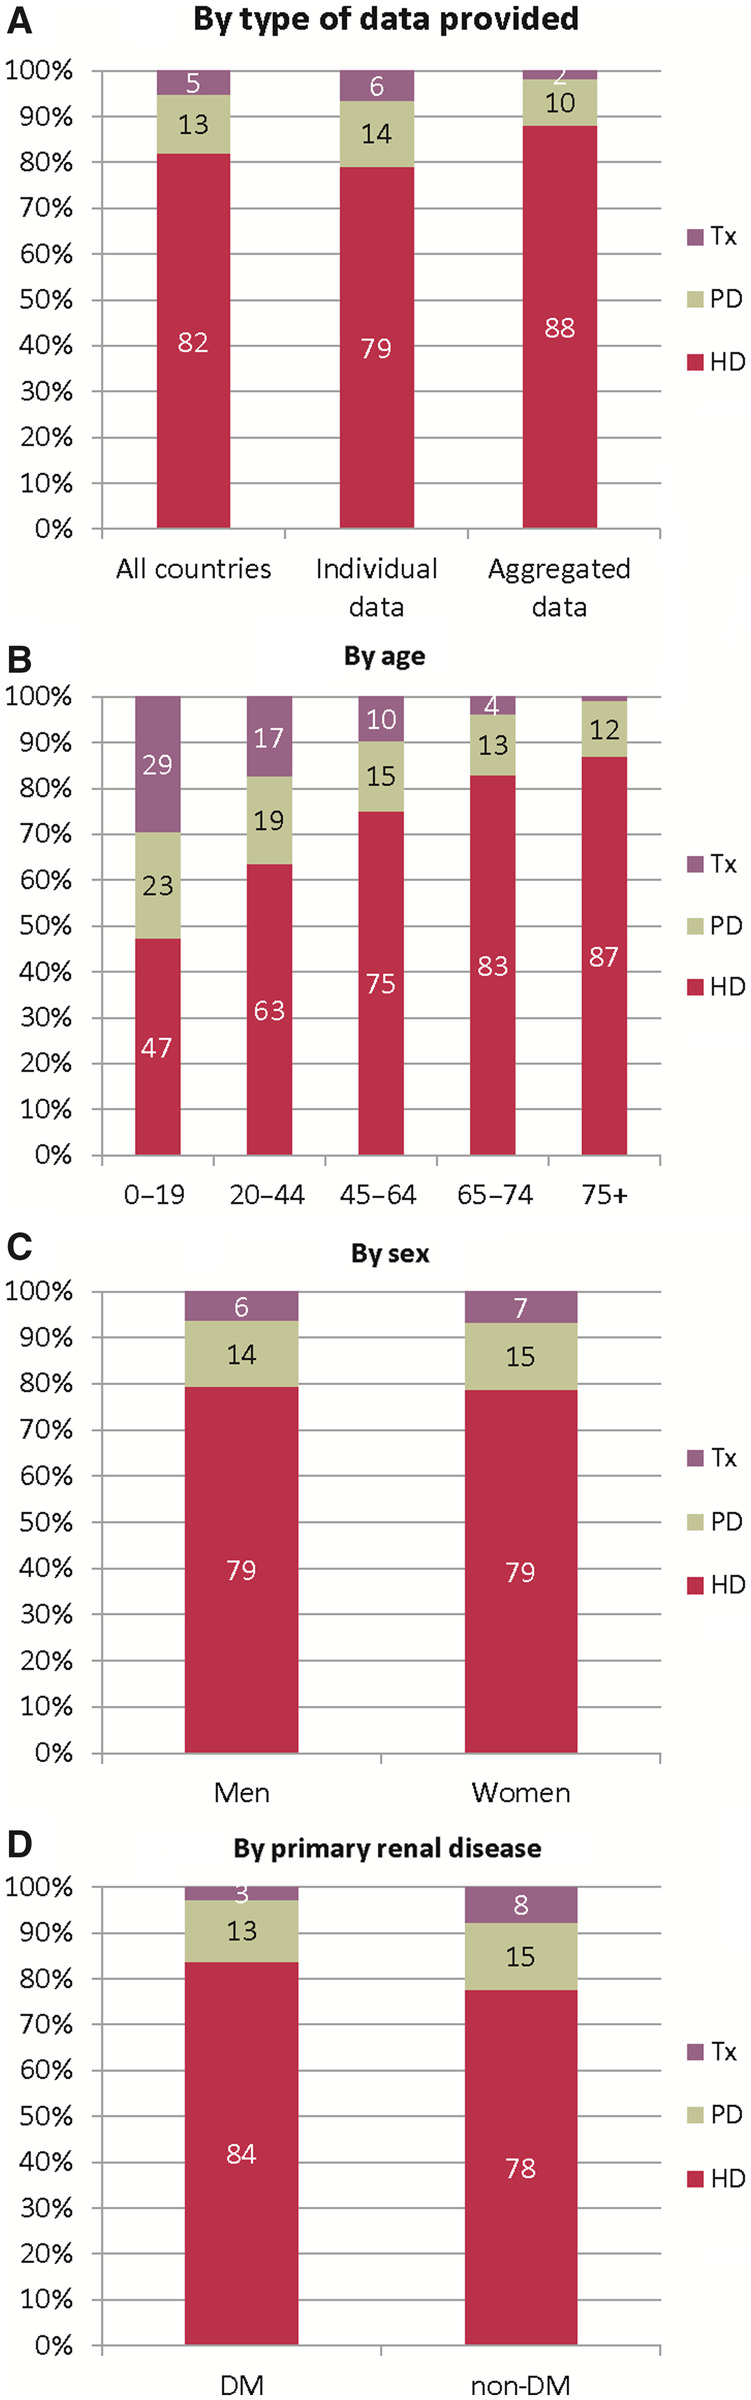
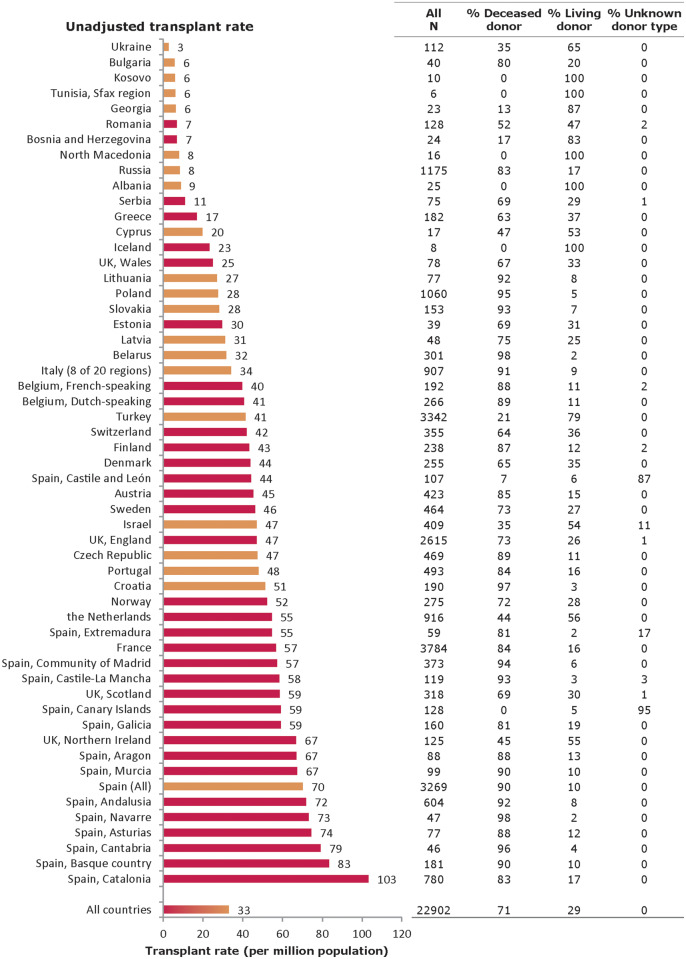
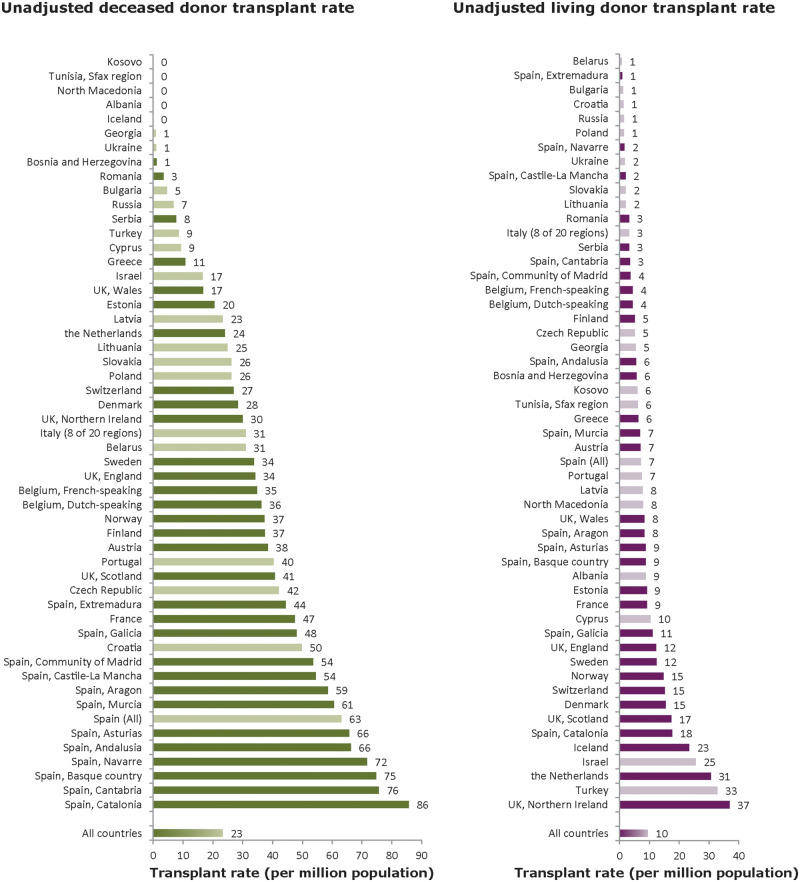
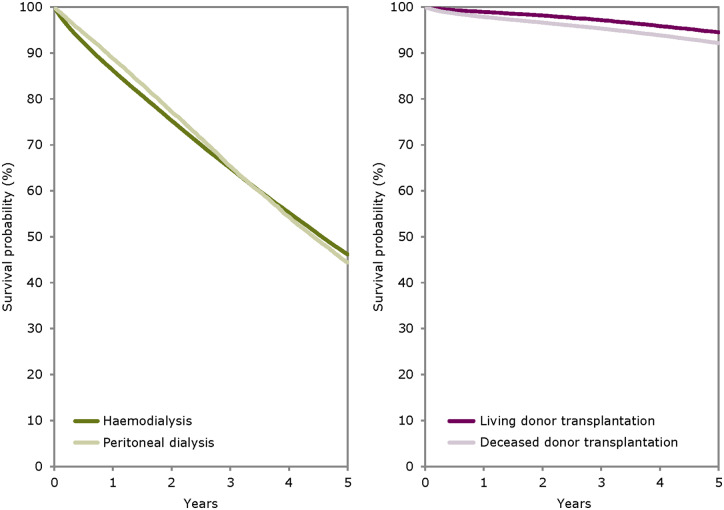
Results: In 2017, the ERA-EDTA Registry covered a general population of 694 million people. The incidence of RRT for ESRD was 127 per million population (pmp), ranging from 37 pmp in Ukraine to 252 pmp in Greece. A total of 62% of patients were men, 52% were ≥65 years of age and 23% had diabetes mellitus as the primary renal disease. The treatment modality at the onset of RRT was haemodialysis for 85% of patients. On 31 December 2017, the prevalence of RRT was 854 pmp, ranging from 210 pmp in Ukraine to 1965 pmp in Portugal. The transplant rate in 2017 was 33 pmp, ranging from 3 pmp in Ukraine to 103 pmp in the Spanish region of Catalonia. For patients commencing RRT during 2008-12, the unadjusted 5-year patient survival probability for all RRT modalities combined was 50.8%.

Keywords: dialysis; end-stage renal disease; epidemiology; kidney transplantation; survival analysis.


Figures

FIGURE 1
FIGURE 1
Incidence (pmp) of RRT in 2017, at Day 1, by country/region, unadjusted. The incidence for the Czech Republic, Poland, Russia, Slovakia and Sfax region (Tunisia) only includes patients receiving dialysis. For England (UK), the incidence is underestimated by 2% (Table 1).
FIGURE 2
FIGURE 2
Unadjusted (left panel) and adjusted (right panel) incidence of RRT pmp in 2017, at Day 1, by country/region. Registries providing individual patient data are shown as dark bars and registries providing aggregated data as light bars. Adjustment of incidence was performed by standardizing the rates to the age and sex distribution of the 27 European Union (EU27) countries' population. The incidence for the Czech Republic, Poland, Russia, Slovakia and Sfax region (Tunisia) only includes patients receiving dialysis. For England (UK), the incidence is underestimated by 2% (Table 1).
FIGURE 3
FIGURE 3
(A) Sex, (B) age and (C) primary renal disease distribution by type of data provided for incident patients accepted for RRT in 2017, at Day 1. See Appendix A1 for a list of countries and regions providing individual patient data or aggregated data.
FIGURE 4
FIGURE 4
Treatment modality distribution, at Day 1, by (A) type of data provided, (B) age, (C) sex and (D) primary renal disease (DM and non-DM) for incident patients accepted for RRT in 2017. (BD) Based on the data from registries providing individual patient data. See Appendix A1 for a list of countries and regions providing individual patient data or aggregated data. Tx, kidney transplant.
FIGURE 5
FIGURE 5
Treatment modality distribution, at Day 91, by (A) type of data provided, (B) age, (C) sex and (D) primary renal disease (DM and non-DM) for incident patients accepted for RRT in 2017. (BD) Based on the data from registries providing individual patient data. See Appendix A1 for a list of countries and regions providing individual patient data or aggregated data. Tx, kidney transplant.
FIGURE 6
FIGURE 6
Prevalence (pmp) of RRT on 31 December 2017 by country/region. The prevalence of Israel, Slovakia and Sfax region (Tunisia) only includes patients receiving dialysis. For England (UK), the prevalence is underestimated by 1% (Table 2).
FIGURE 7
FIGURE 7
Unadjusted (left panel) and adjusted (right panel) prevalence (pmp) of RRT on 31 December 2017 by country/region. Registries providing individual patient data are shown as dark bars and registries providing aggregated data as light bars. Adjustment of the prevalence was performed by standardizing the prevalence to the age and sex distribution of the EU27 population. The prevalence of Israel only includes patients receiving dialysis. For England (UK), the prevalence is underestimated by 1% (Table 2).
FIGURE 8
FIGURE 8
(A) Sex, (B) age and (C) primary renal disease distribution by type of data provided for prevalent patients on RRT on 31 December 2017. See Appendix A1 for a list of countries and regions providing individual patient data or aggregated data.
FIGURE 9
FIGURE 9
Treatment modality distribution by (A) type of data provided, (B) age, (C) sex and (D) primary renal disease (DM and non-DM) for prevalent patients on RRT on 31 December 2017. (BD) Based on the data from registries providing individual patient data. See Appendix A1 for a list of countries and regions providing individual patient data or aggregated data. Tx, kidney transplant.
FIGURE 10
FIGURE 10
Kidney transplants performed in 2017, presented as counts and pmp (unadjusted) by country/region. Registries providing individual patient data are shown as red bars and registries providing aggregated data as orange bars. The total count for Austria is based on residents and non-residents. For Romania, Serbia and England (UK), the overall kidney transplant rate is underestimated by 30, 15 and 7%, respectively.
FIGURE 11
FIGURE 11
Donor-type distribution for kidney transplants performed in 2017, by type of data provided. See Appendix A1 for a list of countries and regions providing individual patient data or aggregated data.
FIGURE 12
FIGURE 12
Deceased donor (left panel) and living donor (right panel) kidney transplants performed in 2017 pmp, by country/region, unadjusted. Registries providing individual patient data are shown as dark bars and registries providing aggregated data as light bars. The total count for Austria is based on residents and non-residents. For Romania and England (UK), the kidney transplant rate is underestimated by 30 and 7%, respectively. For Serbia, the transplant rate is underestimated by 16% for deceased donor transplants and by 12% for living donor transplants.
FIGURE 13
FIGURE 13
Survival of patients starting HD and PD between 2008 and 2012 from Day 91 (left panel) and patients receiving a first kidney transplant from a living or deceased donor between 2008 and 2012 (right panel). Survival on dialysis was censored for kidney transplantation and adjusted using fixed values for age (67 years), sex (63% men) and primary renal disease (24% DM, 19% hypertension/renal vascular disease, 11% glomerulonephritis and 46% other causes). Survival after kidney transplantation was adjusted using fixed values for age (50 years), sex (63% men) and primary renal disease (14% DM, 10% hypertension/renal vascular disease, 23% glomerulonephritis and 53% other causes). These figures are based on data from the following registries providing individual patient data: Austria, Belgium (Dutch-speaking), Belgium (French-speaking), Denmark, Finland, France, Greece, Iceland, Norway, Spain (Andalusia), Spain (Aragon), Spain (Asturias), Spain (Basque Country), Spain (Cantabria), Spain (Castile and León), Spain (Castile-La Mancha), Spain (Catalonia), Spain (Extremadura), Spain (Galicia), Spain (Community of Madrid), Sweden, The Netherlands, UK (England, Northern Ireland, Wales) and UK (Scotland).
FIGURE 14
FIGURE 14
Expected remaining lifetimes of prevalent dialysis and kidney transplant patients (cohort 2013–17) and the general population (cohort 2013–17), by age. This figure is based on data from the following registries providing individual patient data: Austria, Belgium (Dutch-speaking), Belgium (French-speaking), Denmark, Finland, France, Greece, Iceland, Norway, Spain (Andalusia), Spain (Aragon), Spain (Asturias), Spain (Basque Country), Spain (Cantabria), Spain (Castile and León), Spain (Castile-La Mancha), Spain (Catalonia), Spain (Extremadura), Spain (Galicia), Spain (Community of Madrid), Sweden, The Netherlands and UK (all countries).

References

    1. ERA-EDTA Registry. ERA-EDTA Registry Annual Report 2017. Amsterdam: Amsterdam UMC, Department of Medical Informatics, 2019
    1. Kramer A, Pippias M, Noordzij M. et al. The European Renal Association–European Dialysis and Transplant Association (ERA-EDTA) Registry Annual Report 2016: a summary. Clin Kidney J 2019; 12: 702–720 - PMC - PubMed