Association of Mobile Phone Location Data Indications of Travel and Stay-at-Home Mandates With COVID-19 Infection Rates in the US
- PMID: 32897373
- PMCID: PMC7489834
- DOI: 10.1001/jamanetworkopen.2020.20485
Association of Mobile Phone Location Data Indications of Travel and Stay-at-Home Mandates With COVID-19 Infection Rates in the US
Abstract
Importance: A stay-at-home social distancing mandate is a key nonpharmacological measure to reduce the transmission rate of severe acute respiratory syndrome coronavirus-2 (SARS-CoV-2), but a high rate of adherence is needed.
Objective: To examine the association between the rate of human mobility changes and the rate of confirmed cases of SARS-CoV-2 infection.
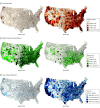
Design, setting, and participants: This cross-sectional study used daily travel distance and home dwell time derived from millions of anonymous mobile phone location data from March 11 to April 10, 2020, provided by the Descartes Labs and SafeGraph to quantify the degree to which social distancing mandates were followed in the 50 US states and District of Columbia and the association of mobility changes with rates of coronavirus disease 2019 (COVID-19) cases.
Exposure: State-level stay-at-home orders during the COVID-19 pandemic.
Main outcomes and measures: The main outcome was the association of state-specific rates of COVID-19 confirmed cases with the change rates of median travel distance and median home dwell time of anonymous mobile phone users. The increase rates are measured by the exponent in curve fitting of the COVID-19 cumulative confirmed cases, while the mobility change (increase or decrease) rates were measured by the slope coefficient in curve fitting of median travel distance and median home dwell time for each state.
Results: Data from more than 45 million anonymous mobile phone devices were analyzed. The correlation between the COVID-19 increase rate and travel distance decrease rate was -0.586 (95% CI, -0.742 to -0.370) and the correlation between COVID-19 increase rate and home dwell time increase rate was 0.526 (95% CI, 0.293 to 0.700). Increases in state-specific doubling time of total cases ranged from 1.0 to 6.9 days (median [interquartile range], 2.7 [2.3-3.3] days) before stay-at-home orders were enacted to 3.7 to 30.3 days (median [interquartile range], 6.0 [4.8-7.1] days) after stay-at-home social distancing orders were put in place, consistent with pandemic modeling results.
Conclusions and relevance: These findings suggest that stay-at-home social distancing mandates, when they were followed by measurable mobility changes, were associated with reduction in COVID-19 spread. These results come at a particularly critical period when US states are beginning to relax social distancing policies and reopen their economies. These findings support the efficacy of social distancing and could help inform future implementation of social distancing policies should they need to be reinstated during later periods of COVID-19 reemergence.
Conflict of interest statement
Figures


References
-
- Centers for Disease Control and Prevention COVID-19 cases in the U.S. Accessed April 12, 2020. https://www.cdc.gov/coronavirus/2019-ncov/cases-updates/cases-in-us.html
-
- Lai S, Ruktanonchai NW, Zhou L, et al. Effect of non-pharmaceutical interventions for containing the COVID-19 outbreak: an observational and modelling study. medRxiv. Preprint posted online March 13, 2020. doi:10.1101/2020.03.03.20029843 - DOI
Publication types
MeSH terms
LinkOut - more resources
Full Text Sources
Medical
Miscellaneous

