Clinical Trial
. 2020 Dec 1;130(12):6700-6717.
doi: 10.1172/JCI120288.

Inhibition of IRF5 hyperactivation protects from lupus onset and severity

Affiliations
Clinical Trial

Inhibition of IRF5 hyperactivation protects from lupus onset and severity

Su Song et al. J Clin Invest. .

Abstract

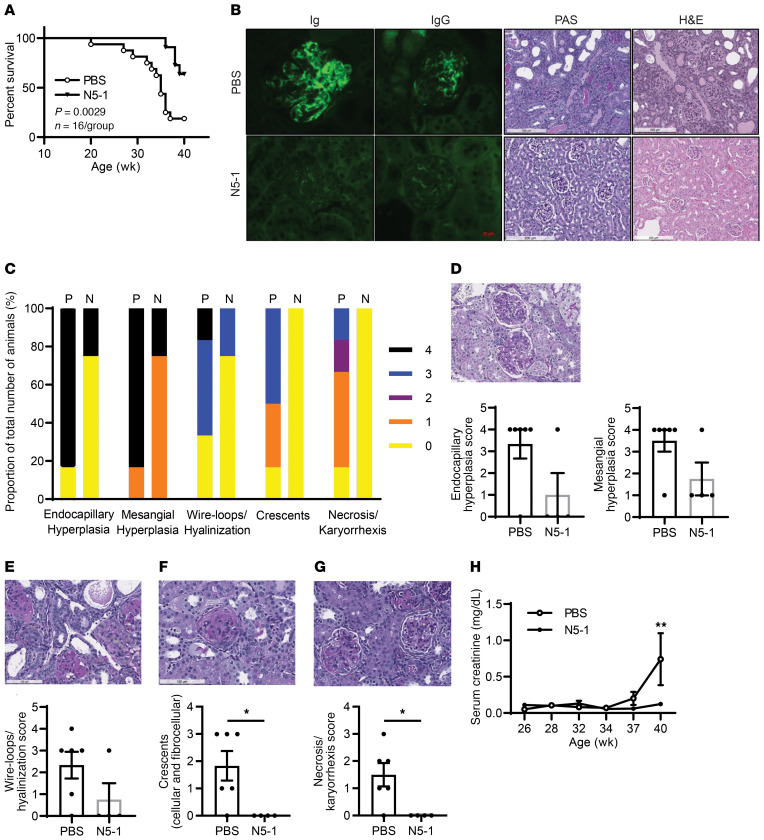
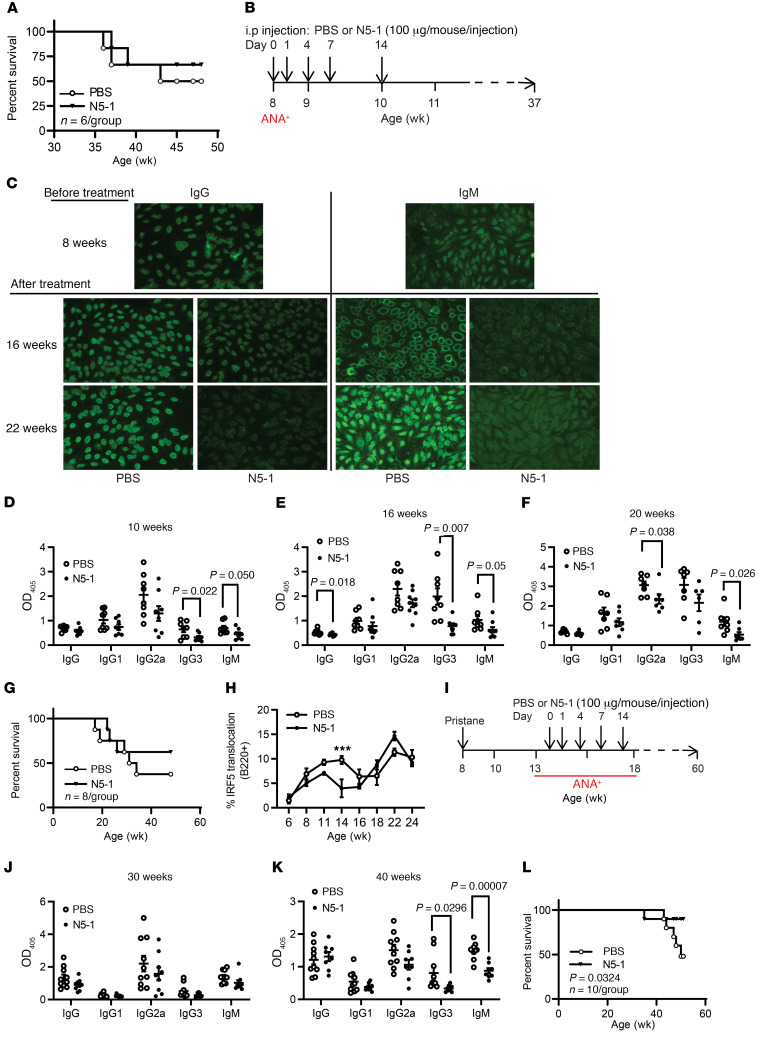
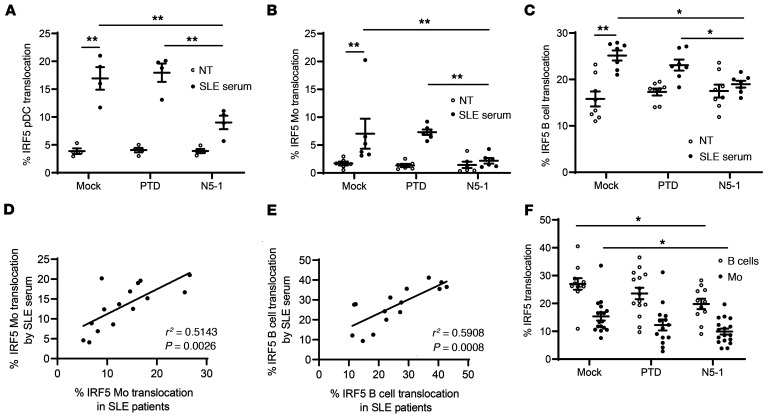
The transcription factor IFN regulatory factor 5 (IRF5) is a central mediator of innate and adaptive immunity. Genetic variations within IRF5 are associated with a risk of systemic lupus erythematosus (SLE), and mice lacking Irf5 are protected from lupus onset and severity, but how IRF5 functions in the context of SLE disease progression remains unclear. Using the NZB/W F1 model of murine lupus, we show that murine IRF5 becomes hyperactivated before clinical onset. In patients with SLE, IRF5 hyperactivation correlated with dsDNA titers. To test whether IRF5 hyperactivation is a targetable function, we developed inhibitors that are cell permeable, nontoxic, and selectively bind to the inactive IRF5 monomer. Preclinical treatment of NZB/W F1 mice with an inhibitor attenuated lupus pathology by reducing serum antinuclear autoantibodies, dsDNA titers, and the number of circulating plasma cells, which alleviated kidney pathology and improved survival. Clinical treatment of MRL/lpr and pristane-induced lupus mice with an inhibitor led to significant reductions in dsDNA levels and improved survival. In ex vivo human studies, the inhibitor blocked SLE serum-induced IRF5 activation and reversed basal IRF5 hyperactivation in SLE immune cells. We believe this study provides the first in vivo clinical support for treating patients with SLE with an IRF5 inhibitor.

Keywords: Autoimmune diseases; Autoimmunity; Immunology.


Conflict of interest statement

Conflict of interest: BJB is an inventor on a US patent application (US20200071370A1, Cell-penetrating peptides that inhibit IRF5 nuclear localization), assigned to Rutgers. BJB and S. Sun are inventors on a US provisional patent application (62/844,894, Inhibition of IRF5 protects from lupus onset and severity), assigned to Feinstein Institutes.

Figures

Figure 1
Figure 1. IRF5 is hyperactivated in immune cells from patients with SLE and in NZB/W F1 lupus-prone mice.
IRF5 activation was assessed by nuclear localization in CD45+CD14+ monocytes (Mo) (A) and CD45+CD19+ B cells (B) from healthy donors and patients with SLE in the New Jersey cohort using imaging flow cytometry. Data represent the percentage of IRF5 nuclear translocation; circles represent independent donors. (C and D) IRF5 localization determined in monocytes (C) and B cells (D) from healthy donors and patients with SLE in the New York cohort with clinically inactive (score = 0/1) or active (score = 2/3) disease. (E and F) Percentage of IRF5 nuclear translocation in monocytes and B cells from patients with SLE stratified by SLEDAI (E) and dsDNA antibody titers (F). (GK) Correlation between the percentage of IRF5 translocation in B cells or monocytes and dsDNA titers (G and H) or serum IFN-α levels (J and K) by linear regression analysis. (L and M) IRF5 nuclear translocation in CD11b+ monocytes from cohort 1 (L) and cohort 2 (M) consisting of aging female NZB/W F1 and BALB/c mice. Black circles, NZB/W F1 mice; white circles, BALB/c. n = 3 mice/group/cohort. (N) Inhibition of IRF5 activation (10–21 weeks old) by N5-1 in CD11b+ monocytes. (O and P) Same as in L and M, except in B220+ B cells from cohort 1 (O) and cohort 2 (P). (Q) Same as in N, except inhibition of IRF5 activation is shown in B220+ B cells. (R and S) IRF5 translocation in CD3+CD4+ T cells (R) and CD3+CD8+ T cells (S) from aging female NZB/W F1 and BALB/c mice. n = 6 mice/group. Data represent the mean ± SEM. *P ≤ 0.05, **P ≤ 0.01, ***P ≤ 0.001, and ****P ≤ 0.0001, by 2-way ANOVA with Bonferroni’s post hoc test.
Figure 2
Figure 2. Design of IRF5 peptide mimetics.
(A) Homology model of the IRF5 DBD with location of N-terminal peptides and amino acid characteristics. (B) Position of N- and C-terminal peptides highlighted within the full-length IRF5 V5 sequence. The color code is based on the amino acid characteristics defined in A. (C) Biacore T200 SPR analysis of peptide mimetics. Data are representative of 4 independent experimental replicates per peptide. (D and E) IRF5 nuclear translocation quantified in healthy donor PBMCs preincubated with 10 μM peptide for 1 hour and stimulated with 500 ng/mL R848 for 2 hours using imaging flow cytometry. Plots show quantification in CD45+CD14+ monocytes (D) and CD45+CD19+ B cells (E). n = 3 independent samples from healthy donors. (F) Kinetics analysis of N5-1 peptide binding to IRF5 by SPR. Data are representative of 4 independent experimental replicates. (G) Purified human monocytes were preincubated with 2.5 μM FITC-PTD, –N5-1, or –C5-2 for 1 hour followed by permeabilization and staining for intracellular IRF3, IRF5, or IRF7 with TRITC-conjugated antibodies. FRET units were calculated from fluorescence emissions (see Supplemental Methods). n = 3 independent samples from healthy donors. (HL) In vivo monitoring of the interaction between FITC–N5-1 and endogenous IRF3, IRF5, or IRF7 in THP1 cells by acceptor photobleaching FRET microscopy. (H and I) Fold change in donor pixel intensity was monitored in the photobleached regions (JL) and plotted over time. Photobleached regions are indicated by white arrows. Images were acquired before and after acceptor photobleaching. Representative images of FITC–N5-1 and TRITC-IRF5 (J), TRITC-IRF3 (K), and TRITC-IRF7 (L) are shown (original magnification, ×60). Data are representative of 3 independent biological replicate experiments performed in triplicate. Data represent the mean ± SD. *P ≤ 0.05, **P ≤ 0.01, and ***P ≤ 0.001, by 1-way ANOVA.
Figure 3
Figure 3. N5-1 is predicted to bind to the C-terminal IAD of an inactive IRF5 monomer and inhibit phosphorylation of Ser462.
(A) Schematic diagram of N5-1 (pink) binding to the C-terminal IAD of IRF5 from peptide docking using the Schrodinger suite (see Supplemental Methods). N5-1 stabilizes the nonphosphorylated, inactive IRF5 monomer. Serine phosphorylation sites are shown by orange circles. (B) PBMCs were preincubated with 10 μM inhibitor for 1 hour and stimulated with R848. p-IRF5 phosphorylation at Ser462 was detected by flow cytometry following gating on CD14+ monocytes. The fold change in p-IRF5 relative to unstimulated mock samples is shown. n = 5 independent samples from healthy donors. Data represent the mean ± SD. *P ≤ 0.05 and **P ≤ 0.01, by 1-way ANOVA. (C) On the basis of the binding of N5-1 to full-length inactive IRF5, we propose that the DBD masks the IAD of IRF5 and that the AID masks the C-terminal phosphorylation sites, thus stabilizing a closed, unphosphorylated conformation of the IRF5 monomer (left panel). In this conformation, the DBD α3 helix, which contains all the conserved residues and is responsible for protein-DNA contacts, is shielded. Upon phosphorylation, the AID unfolds, which unmasks the C-terminal phosphorylation sites and frees helix 5 for dimerization (right panel). The DBD will also be released from this folded, inactive position and exposed to DNA for binding. The colors correspond to the specified regions of IRF5 in the crystal structure (above) and the stick model (below). The DBD is indicated in green, the IAD in blue, and the AID in purple. The N5-1 sequence is shown in red in both models.
Figure 4
Figure 4. IRF5 peptide inhibitors readily enter primary immune cells to inhibit R848-induced IRF5 nuclear translocation.
(A) Representative flow cytometry histograms showing uptake of 10 μM FITC-conjugated PTD or N5-1 after incubation of human PBMCs with an inhibitor for 1 hour. For inhibitor uptake, an FITC intensity of greater than 104 in CD14+ monocytes (light gray) and 103 in CD19+ B cells (dark gray) was considered positive. (B) Percentage of total monocytes and B cells positive for FITC-conjugated N5-1. n = 4 independent samples from healthy donors. (C) Representative images of cellular uptake of 10 μM FITC-conjugated PTD or N5-1 in monocytes (top row), B cells (bottom row), and pDCs (bottom panel). Inhib, inhibitor. (D) Representative images of IRF5 cellular localization in monocytes (CD14) and B cells (CD19) after preincubation of PBMCs with 10 μM mock, PTD, N5-1, or C5-2 inhibitors followed by stimulation with 500 ng/mL R848 for 2 hours. (E and F) Quantification of IRF5 nuclear translocation in monocytes (E) and B cells (F) was done by imaging flow cytometry. n = 6 independent samples from healthy donors. (G) Representative Western blot of nuclear extracts from primary human monocytes following treatment with 2.5 μM mock, PTD, N5-1, or C5-2 inhibitors and stimulation with 500 ng/mL R848 for 2 hours. (H) Quantification of nuclear IRF5 from G relative to lamin B1. n = 3 independent samples from healthy donors. Data are representative of 3 or more independent experimental replicates. Data represent the meant ± SEM. **P ≤ 0.01 and ***P ≤ 0.001, by 1-way ANOVA.
Figure 5
Figure 5. N5-1 protects NZB/W mice from spontaneous onset of lupus.
(A) Representative Western blot of nuclear extracts from RAW264.7 macrophages pretreated for 1 hour with N5-1 followed by LPS for 2 hours. Noncultured cells, 0 hours before pretreatment; cultured cells, 3 hours after treatment. (B) Quantification of nuclear IRF5 in A relative to lamin B1 from 3 independent replicates. Statistical significance was determined by 1-way ANOVA. (C) In vivo inhibition of IL-6 secretion by N5-1 in WT (Irf5+/+), heterozygous (Het) (Irf5+/–), and KO (Irf5–/–) mice. Sera were harvested 1.5 hours after R848 administration. n = 3–4 mice/group. Statistical significance was determined by 1-way ANOVA. (D) N5-1 dosing strategy for NZB/W F1 mice. (E) Anti-dsDNA Ig titers (1:500 serum dilution) in mice at 20 weeks of age. (F) ANA immunofluorescence scoring for sera from 11 PBS- and 10 N5-1–treated mice. 0, negative signal; 4, strongest signal. Statistical significance was determined by Mann-Whitney U test. (G) Representative ANA images from 27-week-old treated mice (×20 objective and ×10 eyepiece). (H and I) Percentage of circulating IgDB220CD138+ PCs (H) and B220+CD11c+CD11b+ ABCs (I). n = 4 mice/time point. Statistical significance was determined by 2-way ANOVA and Bonferroni’s multiple-comparison test. (H) F(7,35) = 10.27, P < 0.0001, age; F(1,35) = 4.125, P = 0.049, treatment; F(7,35) = 1.627, P = 0.1603, interaction. *P = 0.0133 vs. PBS, week 38; ††P < 0.0081 and ††††P < 0.0001 vs. PBS, week 14. (I) F(5,32) = 20.63, P < 0.0001, age; F(1,32) = 4.402, P = 0.0439, treatment; F(5,32) = 4.146, P = 0.0051, interaction. ***P = 0.0001 versus PBS, week 35; ††P = 0.0033, †††P = 0.0002 and ††††P < 0.0001 vs. PBS, week 14; ##P = 0.0005 and ###P = 0.0029 vs. N5-1, week 14. (J and K) Inhibition by N5-1 of IRF5 activation in cohort 2 (14–21 weeks old). CD11b+ monocytes (J) and B220+ (K) B cells. n = 4 mice/group. Statistical significance was determined by 1-way ANOVA. Data represent the mean ± SEM. *P ≤ 0.05, **P ≤ 0.01, ***P ≤ 0.001, and ****P ≤ 0.0001.
Figure 6
Figure 6. N5-1 reduces kidney pathology and increases overall survival.
(A) Kaplan-Meier survival curves. Differences were determined by Gehan-Breslow-Wilcoxon test. n = 11 mice/group. (B) Representative microscopic images of kidney sections; fluorescence deposition of Ig and IgG (×40 magnification), periodic acid–Schiff (PAS) staining, and H&E staining (×10 magnification). (C) Summarized scoring of renal inflammation and damage shown in DG from 6 PBS-treated mice and 4 N5-1–treated mice. (DG) Microscopic images of kidney sections assessed by PAS staining (original magnification, ×20) showing images of endocapillary and mesangial hyperplasia (D), wire-loops/hyalinization (E), crescents (F), and necrosis/karyorrhexis (G). Scoring for 100 glomeruli per case is shown. (H) Serum creatinine levels were plotted over the course of the disease. n = 8 mice/group. *P ≤ 0.05, by Mann-Whitney U test.
Figure 7
Figure 7. Therapeutic efficacy of N5-1 in ANA-positive NZB/W F1, MRL/lpr, and pristane-induced lupus mice.
(A) Kaplan-Meier survival curves of NZB/W F1 mice treated at 27 weeks of age. Differences were determined by Gehan-Breslow-Wilcoxon test. n = 6 mice/group. (B) N5-1 dosing strategy for MRL/lpr mice. (C) Representative ANA images from 8-week-old pretreated mice and 16- and 22-week-old treated mice (×20 objective and ×10 eyepiece). (DF) Anti–dsDNA IgG isotype titers (1:500 serum dilution) were measured at 10, 16, and 20 weeks of age. (G) Kaplan-Meier survival curves of treated MRL/lpr mice. Differences determined by Gehan-Breslow-Wilcoxon test. n = 8 mice/group. (H) Analysis of IRF5 nuclear translocation in B220+ B cells from PBS- and N5-1–treated MRL/lpr mice. n = 8 mice/group. (I) N5-1 dosing strategy for pristane-injected mice. (J and K) Anti–dsDNA IgG isotype titers (1:500 serum dilution) were determined at 30 (J) and 40 (K) weeks of age. (L) Kaplan-Meier survival curves of pristane-induced BALB/c mice. Differences were determined by Gehan-Breslow-Wilcoxon test. n = 10 mice/group. (DF, H, J, and K) ***P ≤ 0.0001, by Mann-Whitney U test.
Figure 8
Figure 8. N5-1 inhibits SLE serum–induced IRF5 activation and reverses IRF5 hyperactivation in SLE immune cells.
(A) Healthy donor PBMCs (n = 6) were preincubated with an inhibitor (10 μM) followed by stimulation with 2% SLE serum for 2 hours. The percentage of IRF5 nuclear translocation is shown in pDCs (A), monocytes (B), and B cells (C) from imaging flow cytometry. (D and E) Correlation between the percentage of IRF5 translocation in SLE serum–stimulated monocytes (D) or B cells (E) and in vivo IRF5 activation in matched SLE monocytes or B cells, respectively, by linear regression analysis. (F) SLE PBMCs were mock or inhibitor treated (10 μM) for 1 hour, and IRF5 activation in monocytes and B cells was quantified by imaging flow cytometry. The percentage of IRF5 nuclear translocation is shown. Data represent the mean ± SEM. Differences between groups were determined by 2-way ANOVA with Bonferroni’s multiple-comparison test. *P ≤ 0.05 and **P ≤ 0.01.

Comment in

References

    1. Barnes BJ, Moore PA, Pitha PM. Virus-specific activation of a novel interferon regulatory factor, IRF-5, results in the induction of distinct interferon alpha genes. J Biol Chem. 2001;276(26):23382–23390. doi: 10.1074/jbc.M101216200. - DOI - PubMed
    1. Schoenemeyer A, et al. The interferon regulatory factor, IRF5, is a central mediator of toll-like receptor 7 signaling. J Biol Chem. 2005;280(17):17005–17012. doi: 10.1074/jbc.M412584200. - DOI - PubMed
    1. Takaoka A, et al. Integral role of IRF-5 in the gene induction programme activated by Toll-like receptors. Nature. 2005;434(7030):243–249. doi: 10.1038/nature03308. - DOI - PubMed
    1. Kaur A, Lee LH, Chow SC, Fang CM. IRF5-mediated immune responses and its implications in immunological disorders. Int Rev Immunol. 2018;37(5):229–248. doi: 10.1080/08830185.2018.1469629. - DOI - PubMed
    1. Ban T, Sato GR, Tamura T. Regulation and role of the transcription factor IRF5 in innate immune responses and systemic lupus erythematosus. Int Immunol. 2018;30(11):529–536. - PubMed

Publication types